

vk.com/id446425943 |
Rusagro |
Russia |
|
Consumer: Consumer Products |
|
Grain: Drying excessive volumes
The grain harvest is going to be down 18% YoY to 111mn tonnes this season, according to IKAR, from the record high 135mn tonnes in MY18. The dry weather in the flagship regions was a key headwind.
In absence of trade limitations, exports could reach an impressive 40mn tonnes, tightening the domestic supply balance.
Grain prices will be 20% YoY higher in 2019F, in our view, reflecting the global recovery from a low base, weaker USDRUB, and easing supply.
In the last five seasons, the grain harvest in Russia was on a constant rising trend, reaching a record high 135mn tonnes in MY18. The planting area was stable at 46.7mn ha, while favourable weather conditions and the gradual industrialisation of the segment brought impressive yields. Although consumption grew with a 5% CAGR in MY14-18, it lagged the strong harvests and offered incremental export volumes (a record 55mn tonnes in MY18), securing the leading spot for Russia on the wheat market. Exports are of a uniform nature from Russia and the constant overhang caused an average 17% YoY decline in 4Q16-1Q18 prices.
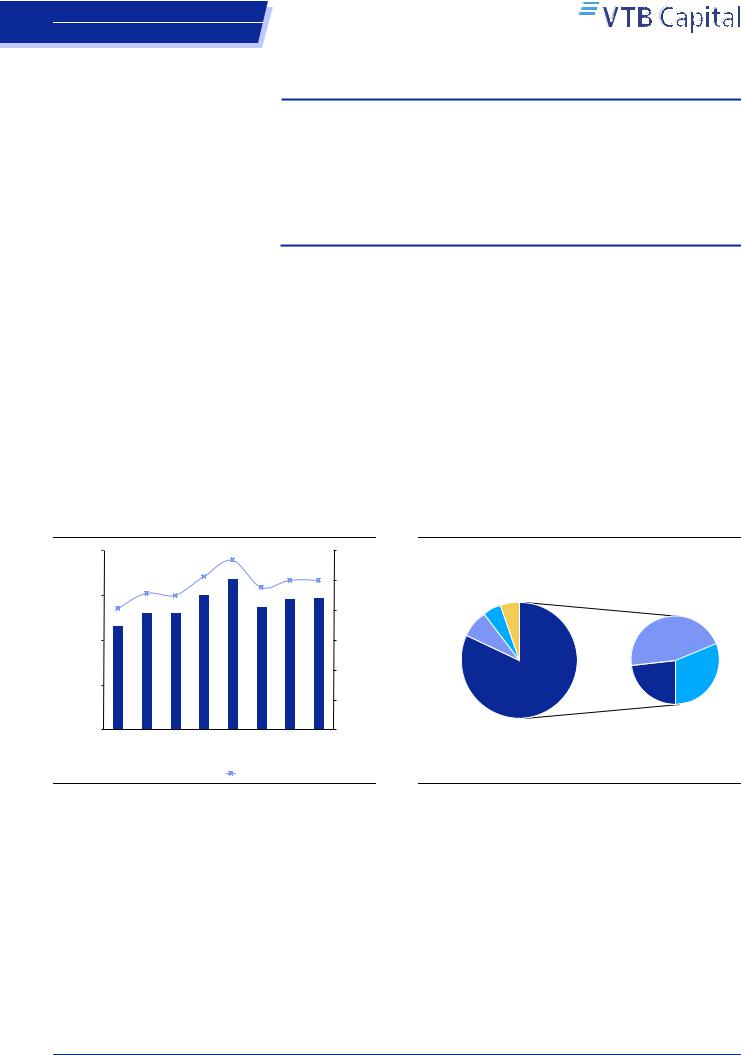
In spring-summer 2018, Russia saw dry weather conditions, particularly in the southern regions which are the prime exporters. As a result, IKAR forecasts blended grain yields to decline 16% YoY to 2.4 tonnes per ha and the consolidated harvest to decrease 18% YoY to 111mn tonnes. The quality of supply remains modest, with 64% of total grain coming from low-yield wheat while the crop sees 77% contribution from lower-quality fourth and feed grades. The current season harvest is lower than our mid-cycle assumption for the harvest of closer to 120mn tonnes.
Figure 10: Grain harvest and yields in Russia
|
160 |
|
|
|
|
|
2.8 |
|
|
|
|
|
|
|
|
|
|
2.6 |
135 |
2.4 |
|
2.5 |
2.5 |
|
|
|
|
|
|
|
|
||||
|
|
|
2.3 |
2.2 |
121 |
|
|
|
119 |
||
|
120 |
|
|
111 |
117 |
||||||
|
2.0 |
|
|
|
|
|
|||||
|
105 |
105 |
|
|
|
|
|
||||
|
|
|
|
|
|
|
|||||
|
|
|
|
|
|
|
|
|
|||
tonnes |
|
93 |
|
|
|
|
|
|
|
|
|
80 |
|
|
|
|
|
|
|
|
|
|
|
mn |
|
|
|
|
|
|
|
|
|
|
|
|
40 |
|
|
|
|
|
|
|
|
|
|
|
- |
MY14 |
MY15 |
MY16 |
MY17 |
MY18 |
MY19F |
|
MY20F |
MY21F |
|
|
|
|
|||||||||
|
|
|
|
|
Harvest (lhs) |
Yield (rhs) |
|
|
|||
|
|
|
|
|
|
|
|||||
|
|
|
|
|
|
|
|||||
Source: IKAR, VTB Capital Research
Figure 11: Grain harvest breakdown, MY19
3.0 |
|
|
|
|
|
|
|
|
2.5 |
Corn, |
Other, |
|
|||||
|
|
|||||||
|
Barley, 10% |
11% |
|
|
|
|
||
2.0 |
|
|
|
|
|
4th grade, |
|
|
|
15% |
|
|
|
|
|
|
|
1.5 |
MT/ha |
46% |
|
|||||
|
|
|
|
|
|
|
||
|
|
|
|
|
|
|
|
|
1.0 |
|
|
|
|
|
|
|
|
|
|
|
|
|
|
|
|
|
|
|
|
|
|
|
|
3rd grade, |
Feed, |
|
|
|
|
|
|
|
||
|
|
|
|
|
|
|
||
0.5 |
Wheat, 64% |
|
|
|
|
23% |
31% |
|
|
|
|
|
|
|
|
|
|
|
|
|
|
|
|
|
|
|
-
Source: IKAR, VTB Capital Research
For MY19, Russian grain exports are forecasted by IKAR to decline to some 40mn tonnes from the record seen last year at 54mn tonnes. We consider the figure as strong and sustainable in light of the stabilised crop rotation and in the absence of adverse weather conditions. Among the prime upside factors for grain production and exports, we highlight the greater share of corn in planting and the return of abandoned land. Corn represents 5% of the rotation, while the best in class examples are set at 50%, while we see corn yields for MY19F some 20% higher. However, the crop requires more complex farming processes and awaits a greater level of industrialisation in Russia (the top-10 land banks with a 12% share of the consolidated area). In addition, the current area under management in Russia is now 80mn ha vs. 116mn ha during Soviet times.
21 November 2018 |
8 |

vk.com/id446425943 |
Rusagro |
Russia |
|
Consumer: Consumer Products |
|
Figure 12: Grain exports from Russia
mn tonnes
60
19%
50
40 13%
32
30 26
20
10
-
MY14 |
MY15 |

 Export (lhs)
|
22% |
22% |
|
|
|
|
|
54 |
|
|
|
|
|
18% |
18% |
17% |
|
|
|
|
|
||
15% |
|
39 |
40 |
40 |
|
36 |
37 |
||||
|
|
|
|||
|
|
|
|
MY16 |
MY17 |
MY18 |
MY19F |
MY20F |
MY21F |
 Ending stocks as % of consumption (rhs)
|
Figure 13: Largest global grain exporters |
|
|||||
22% |
|
100 |
90 |
|
|
|
|
|
|
|
|
|
|
||
|
|
|
|
|
|
|
|
18% |
|
75 |
28 |
|
|
|
|
|
|
|
|
|
|
||
14% |
|
|
|
|
|
|
|
10% |
tonnes |
50 |
|
48 |
45 |
|
|
|
|
|
|
|
|||
6% |
|
|
17 |
14 |
39 |
|
|
mn |
|
|
|
|
30 |
||
|
25 |
62 |
|
|
|
||
2% |
|
|
|
|
33 |
|
|
|
|
|
27 |
28 |
23 |
||
|
|
|
|
|
|||
0%-2% |
|
|
|
|
|
|
5 |
|
|
0 |
|
5 |
3 |
4 |
|
|
|
|
US |
Ukraine |
Argentina |
Russia |
EU |
|
|
|
Wheat |
|
Corn |
Barley |
|
Source: IKAR, VTB Capital Research |
|
Source: USDA, VTB Capital Research |
Since May 2018, domestic grain prices have been on a recovering trend, with the third and fourth grades higher by 40% and 65% through 2018, respectively. The support for prices comes across the board as global grain stocks are easing and USD prices were 10% YoY higher in 11mo18, USDRUB is 12% weaker, and the harvest went down amid suitably robust export volumes and absence of trading limitations. Reflecting those factors and depressed comparison base, we model 4th grade grain prices to gain 20% YoY in 2019F.
Figure 14: Grain prices
18 |
|
|
|
|
|
|
|
|
|
|
|
290 |
16 |
|
|
|
|
|
|
|
|
|
|
15 |
270 |
14 |
|
|
|
|
|
|
|
|
|
|
|
250 |
|
|
|
|
|
|
|
|
|
|
230 |
|
|
RUB/kg |
|
|
|
|
|
|
|
|
|
|
230 |
|
|
|
|
|
|
|
|
|
|
|
|
||
|
|
|
|
|
|
|
|
|
|
|
210USD/ton |
|
12 |
|
|
|
|
|
|
|
|
|
|
12 |
|
10 |
|
|
|
|
|
|
|
|
|
|
|
190 |
|
|
|
|
|
|
|
|
|
|
|
|
|
8 |
|
|
|
|
|
|
|
|
|
|
|
170 |
|
|
|
|
|
|
|
|
|
|
|
|
|
6 |
|
|
|
|
|
|
|
|
|
1Q19F |
3Q19F |
150 |
1Q14 |
3Q14 |
1Q15 |
3Q15 |
1Q16 |
3Q16 |
1Q17 |
3Q17 |
1Q18 |
3Q18 |
|
 Wheat, 4th grade (lhs)
  Wheat FOB, Novoros (lhs)
  Wheat FOB, Novoros (rhs)
Source: Bloomberg, IKAR, VTB Capital Research
Figure 15: Key grain exporters from Russia, MY18
RIF, 13%
International Grain
Company, 9%
Aston, 7%
Other, 60%
Cargill, 5%
Louis Dreyfus,
5%
Source: IKAR, VTB Capital Research
21 November 2018 |
9 |
vk.com/id446425943 |
Rusagro |
Russia |
|
Consumer: Consumer Products |
|
Meat: On the verge of self-sufficiency
The consumption of meat is set to rise 2% YoY to 76.4kg per capita in 2018F. The ‘rational norm of consumption’ is 75kg and developed markets see a blended level of 95kg.
Meat segments have shares of industrial players at 90% in consumption by 2020F. Further growth is likely to come from exports and sector consolidation.
Pork and poultry prices go up with CAGRs of 4% and 7% in 2018-20F, the latter from a more depressed comparison base.
|
|
|
|
|
|
|
|
|
|
|
The recovery in |
household budgets means that we see a 2% YoY increase in the per |
|||||||||||||
|
|
|
|
|
|
|
|
|
|
|
capita consumption of meat to 76.4 kg in 2018F. This is more than the ‘rational norm |
||||||||||||||
|
|
|
|
|
|
|
|
|
|
|
of consumption’ of 75kg established by the Russian Ministry of Health, while per |
||||||||||||||
|
|
|
|
|
|
|
|
|
|
|
capita consumption in the developed markets is 79-116kg. The product mix has |
||||||||||||||
|
|
|
|
|
|
|
|
|
|
|
stabilised of late, with poultry and pork demonstrating comparable YoY recoveries and |
||||||||||||||
|
|
|
|
|
|
|
|
|
|
|
representing 45% and 35% of total consumption in 2018F. Meat is considered by |
||||||||||||||
|
|
|
|
|
|
|
|
|
|
|
consumers to be among the most important components of the consumer basket and |
||||||||||||||
|
|
|
|
|
|
|
|
|
|
|
we see real growth at a comparable pace in the medium term amid robust meat |
||||||||||||||
|
|
|
|
|
|
|
|
|
|
|
intakes already. |
|
|
|
|
|
|
|
|
|
|
|
|
||
Figure 16: Meat consumption per capita in Russia |
|
|
Figure 17: Annual meat consumption by country, |
|
|
||||||||||||||||||||
|
|
|
|
|
|
|
|
|
|
|
|
|
|
|
|
2018F |
|
|
|
|
|
|
|
|
|
|
90 |
|
|
|
|
|
|
|
|
|
|
|
|
|
|
|
125 |
|
|
|
|
|
116 |
|
|
|
|
|
|
|
|
|
|
|
|
|
|
|
|
|
|
|
|
|
|
|
|
|
|
|
|
|
75.3 |
|
|
|
|
|
|
|
75.0 |
76.4 |
77.8 |
79.2 |
|
|
|
|
|
|
|
|
|
|
|
|
|
|
|
|
|
|
|
73.0 |
|
|
|
|
|
100 |
|
|
|
|
96 |
|
|
|
|||||
|
72.3 |
72.1 |
|
|
|
|
|
|
|
|
|
|
|
|
|
||||||||||
|
|
|
|
|
|
|
|
|
|
|
|
|
|
|
|
|
|
||||||||
|
16.4 |
|
|
|
|
|
13.6 |
|
13.4 |
13.5 |
13.7 |
13.9 |
|
|
capitaper |
|
|
76 |
79 |
85 |
|
|
75 |
|
|
|
15.8 |
14.3 |
|
|
|
|
|
|
75 |
|
|
|
|
|
|||||||||||
capita |
60 |
|
|
|
|
|
26.8 |
27.5 |
|
|
|
|
|
|
|
|
|
|
|||||||
|
|
|
|
|
|
|
|
|
|
|
|
|
|
|
|
|
|
|
|||||||
|
|
|
|
|
|
|
|
|
|
|
|
|
|
|
|
|
|
|
|
|
|
|
|
|
|
|
|
|
|
|
|
|
|
|
|
|
|
|
|
|
|
|
|
56 |
|
|
|
|
|
|
|
per |
26.6 |
23.2 |
23.4 |
|
24.6 |
|
25.7 |
26.2 |
|
|
|
|
kg |
50 |
|
|
|
|
|
|
|
|
|||
|
|
|
|
|
|
|
|
|
|
|
|
|
|
|
|
|
|
||||||||
|
|
|
|
|
|
|
|
|
|
|
|
|
|
|
|
|
|
|
|
|
|
|
|
||
kg |
30 |
|
|
|
|
|
|
|
|
|
|
|
|
|
|
|
25 |
|
|
|
|
|
|
|
|
|
|
|
|
|
|
|
|
|
|
|
|
|
|
|
|
|
|
|
|
|
|
|
|
|
|
|
30.2 |
31.3 |
32.3 |
|
32.5 |
|
33.5 |
34.3 |
34.9 |
35.4 |
|
|
|
0 |
Ukraine |
|
EU |
|
|
|
|
|
|||
|
|
|
|
|
|
Russia |
Canada |
Australia |
USA |
Rationalnorm |
|||||||||||||||
|
|
|
|
|
|
|
|||||||||||||||||||
|
0 |
|
|
Poultry |
Pork |
Beef |
|
Other |
|
|
|
|
|
|
|||||||||||
|
|
|
|
|
|
|
|
|
|
|
|
|
|
|
|
|
|
|
|
|
|
|
|
|
|
|
2013 |
2014 |
2015 |
2016 |
2017 |
|
2018F |
2019F |
2020F |
|
|
|
|
|
|
|
|
|
|
|
|
||||
|
|
|
|
|
|
|
|
|
|
|
|
|
|
|
|
|
|||||||||
|
|
|
|
|
|
|
|
|
|
|
|
|
|
|
|
|
|
|
|
|
|
|
|
|
|
|
|
|
|
|
|
|
|
|
|
|
|
|
|
|
|
|
|
|
|
|
|
|
|
|
|
Source: National Pork Union, VTB Capital Research |
|
|
|
|
|
|
Source: USDA, VTB Capital Research |
|
|
|
|
|
|||||||||||||
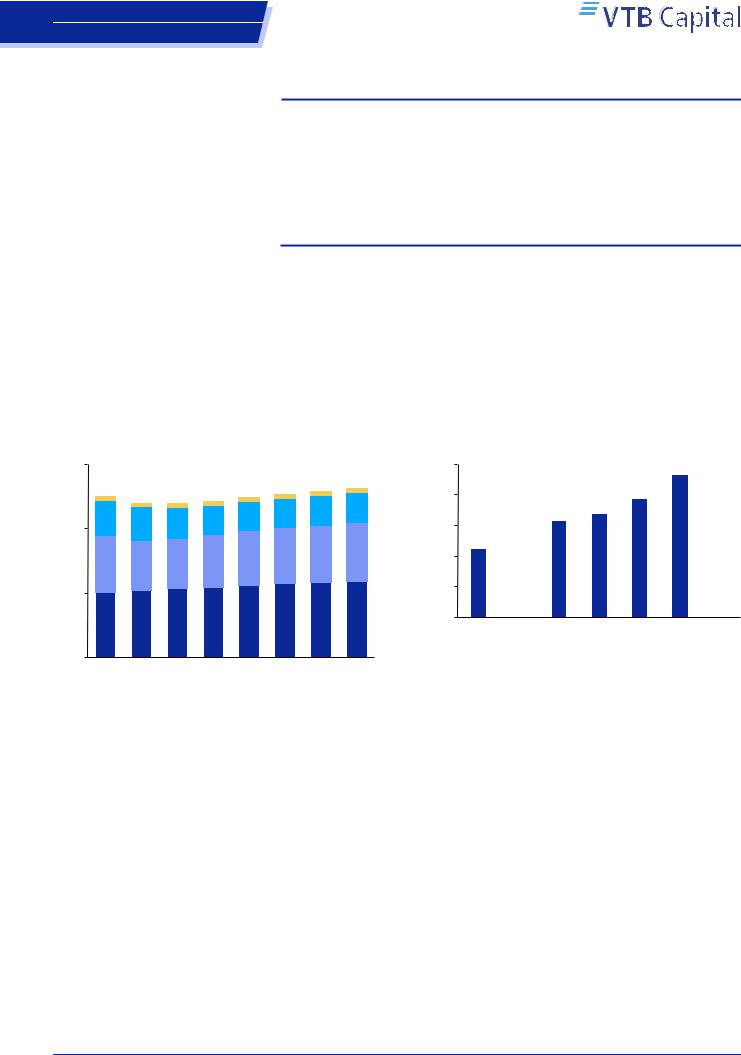
Poultry is a fully industrialised segment, with the share of large-scale breeders stabilising at 90% of total consumption. The supply-demand balance has been easing of late, enjoying a gradual increase in consumption and also financially insolvent participants exiting the market. In the medium term, we see incremental demand being matched by capacity build-up at existing farms and do not factor in a material increase in exports (250,000 tonnes by 2020F). The prime headwinds remain a significant dependency on imported hatching eggs and soy meal, which eats into profitability margins (as compared with key competitors on the foreign markets).
Our forecast points to the share of industrial breeders in total pork consumption at 81% in 2018F. We see the potential for an additional 0.5mn tonnes of capacity build up, which is likely to be covered by the projects which the top five companies have announced. Those volumes are likely to replace imports, which are almost entirely eliminated by 2020F. Households’ contribution drops from 15% in 2017 to 12% by 2020F, in our model, as those producers are not cost sensitive and demand for their meat is supported by growing health awareness.
21 November 2018 |
10 |
vk.com/id446425943 |
|
|
Rusagro |
|
|
|||||
Russia |
|
|
|
|
|
|
|
|
||
Consumer: Consumer Products |
|
|
|
|
|
|
||||
Figure 18: Poultry market balance |
|
|
|
|
||||||
5,600 |
|
|
|
|
|
|
4,987 |
5,072 |
5,155 |
5,239 |
|
|
|
|
|
|
|
3% |
3% |
3% |
|
|
|
|
|
|
4,715 4,721 |
4% |
7% |
6% |
||
|
|
|
|
4,567 |
7% |
|
||||
|
|
4,087 4,260 |
5% |
5% |
7% |
|
|
|
||
4,200 |
|
10% |
7% |
7% |
|
|
|
|
||
3,613 |
12% |
11% |
7% |
|
|
|
|
|
|
|
|
|
|
|
|
|
|
||||
tonnes 2,800 |
8% |
|
|
|
|
|
|
|
||
12% |
8% |
|
|
|
|
|
|
|
||
|
|
|
|
|
|
|
|
|||
9% |
|
|
|
|
|
|
|
|
|
|
|
|
|
|
|
|
|
|
|
|
|
000 |
|
|
81% |
83% |
88% |
90% |
91% |
89% |
89% |
89% |
1,400 |
79% |
80% |
|
|
|
|
|
|
||
|
|
|
|
|
|
|
|
|
||
- |
2011 |
2012 |
2013 |
2014 |
2015 |
2016 |
2017 |
2018F |
2019F |
2020F |
|
||||||||||
Industrial |
Small businesses |
Households |
Import |
|
||||||
Source: Rosstat, VTB Capital Research
Figure 19: Pork market balance |
|
|
|
|
|
|||||||
|
4,200 |
|
|
|
|
|
|
|
|
|
3,965 |
4,065 |
|
|
3,802 |
3,825 |
|
|
|
3,784 |
3,867 |
1% |
|||
|
|
|
|
|
3,589 |
2% |
12% |
|||||
|
|
3,643 |
|
|
|
3,401 |
3,432 |
7% |
4% |
13% |
||
|
|
|
|
|
26% |
8% |
|
14% |
|
|
||
|
3,150 |
33% |
33% |
|
13% |
10% |
17% |
15% |
|
|
|
|
|
|
|
|
|
|
18% |
|
|
|
|
||
tonnes |
|
|
|
|
20% |
21% |
|
|
|
|
|
|
|
|
|
|
|
|
|
|
|
|
|
||
2,100 |
28% |
24% |
|
|
|
|
|
|
|
|
|
|
000 |
|
|
|
|
|
|
|
|
77% |
81% |
85% |
88% |
|
|
|
|
|
|
|
|
|
|
|||
|
|
|
|
|
|
66% |
71% |
76% |
|
|
||
|
1,050 |
|
42% |
|
52% |
|
|
|
|
|
||
|
|
37% |
|
|
|
|
|
|
|
|
||
|
- |
2011 |
2012 |
|
2013 |
2014 |
2015 |
2016 |
2017 |
2018F |
2019F |
2020F |
|
|
|
||||||||||
|
|
Industrial |
Small businesses |
Households |
Import |
|||||||
Source: Rosstat, VTB Capital Research
For 2018F, we forecast poultry prices growing 17% YoY, reflecting the soft comparison base (down 13% YoY last year) and the uplift in the cost base driven by higher prices for soft commodities and a weaker USDRUB. Prices for pork are less volatile (a 3% YoY CAGR in 2017-18F) as demand for live weight hogs is strong due to key breeders launching slaughter houses and the lesser supply of animals to the market. In the medium term, we model pork prices rising in line with CPI (4% annually) and poultry lower than that (2%) in order to return to historically average premiums between the two main types of meat.
The industrialised nature of poultry and pork production leaves limited opportunity for new greenfield projects in the longer term, on the assumption that Russian meat does not become more competitive or is not admitted to the key import markets, i.e. Asian and Middle East countries. However, the segment offers sizable consolidation possibilities with the top five players holding 38% on the poultry and 31% on the pork markets. The volatile operating environment over the last four years has meant that a number of sizable players have seen their solvency deteriorate. This has improved the conditions to conduct M&A deals and could be a robust source of sector consolidation for the most efficient operators.
Figure 20: Poultry and pork prices in Russia
105
98 99 101
|
95 |
|
94 |
95 |
|
|
|
|
|
|
97 |
||
|
|
|
|
|
||
|
|
87 |
92 |
|
|
94 |
|
|
|
85 |
89 |
||
/ kg |
85 |
88 |
|
|
||
|
|
|
|
|||
|
|
|
84 |
84 |
|
|
RUB |
|
|
|
|
||
75 |
|
|
|
|
|
|
|
|
|
|
|
|
|
|
69 |
|
|
|
|
|
|
65 |
|
|
|
|
|
|
61 |
|
|
|
|
|
|
55 |
|
|
|
|
|
|
2013 |
2014 |
2015 |
2016 |
2017 |
2018F 2019F 2020F |
|
|
Frozen Poultry |
Pork, live weight |
|||
Source: IKAR, VTB Capital Research
Figure 21: Consolidation on meat markets in Russia
100% |
Miratorg, 11% |
Cherkizovo, 10% |
|
||
|
Cherkizovo, 6% |
Resurs, 9% |
80% |
Rusagro, 5% |
Prioskolye, 9% |
|
Agro-Belogorye, 5% |
|
|
Velikoluksky, 5% |
Belaya Ptitsa, 5% |
|
|
|
60% |
|
Belgrankorm, 5% |
|
|
|
40% |
Other, 69% |
|
|
Other, 62% |
|
|
|
|
20% |
|
|
0% |
Pork |
Poultry |
|
Source: National Pork Union, National Poultry Union, VTB Capital Research
21 November 2018 |
11 |