

vk.com/id446425943
Russia
Consumer: Consumer Products
21 November 2018
Rusagro, GDR (AGRO LI, USD)
Buy (6 Jul 2018, 14:07 UTC)
Previous: Hold (14 May 2018, 10:05 UTC)
Target price, 12mo: 14.50
Last price: 10.58 (19 Nov 2018, close)
Expected total return: 41%
Upside, 12mo: 37%
DY, next 12mo: 4.4%
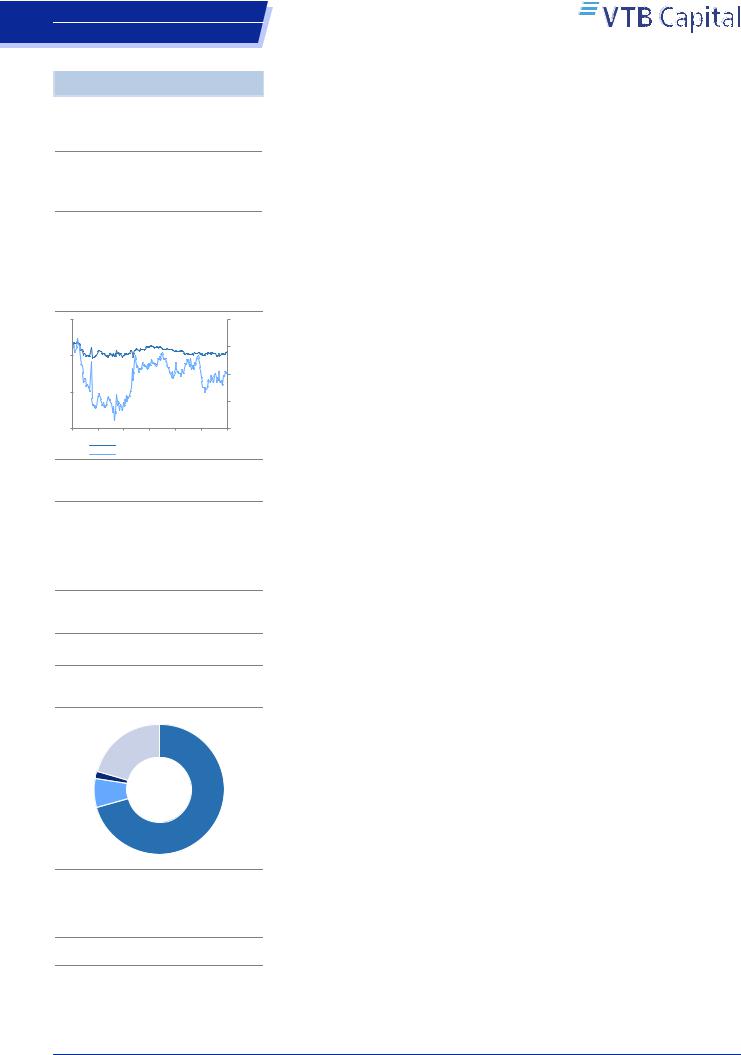
Share price performance, 12-mo
14 |
|
|
|
|
5% |
12 |
|
|
|
|
0% |
10 |
|
|
|
|
-5% |
8 |
|
|
|
|
-10% |
6 |
|
|
|
|
-15% |
4 |
|
|
|
|
-20% |
2 |
|
|
|
|
-25% |
0 |
|
|
|
|
-30% |
Nov |
Jan |
Mar |
May |
Jul |
Sep |
AGRO LI, USD, lhs
Relative to RTS Index, %, rhs
Equities |
|
|
|
|
|
|
1M |
3M |
12M |
3Y |
|
|
|
||||
|
Price |
2% |
3% |
-8% |
-11% |
|
Price relative |
1% |
-4% |
-9% |
-31% |
|
ADTV (USD mn) |
0.36 |
0.36 |
0.29 |
1.90 |
|
Key financial highlights |
|
|
||
|
Fiscal year end |
12/17 |
12/18F |
12/19F |
12/20F |
|
P/E, x |
11.6x |
8.5x |
6.3x |
5.8x |
|
EV/EBITDA, x |
7.3x |
6.3x |
4.8x |
4.0x |
|
P/B, x |
1.0x |
0.9x |
0.8x |
0.7x |
|
FCF yield, % |
-0.3% |
-8.6% |
2.1% |
19.0% |
|
DY (ords), % |
6.4% |
3.6% |
5.6% |
8.6% |
|
Net sales, RUB mn |
79,058 |
83,568 |
101,614 |
109,464 |
|
EBITDA, RUB mn |
13,955 |
17,475 |
23,218 |
25,814 |
|
Net income, RUB |
8,273 |
10,945 |
14,709 |
16,187 |
|
mn |
|
|
|
|
|
Net sales, chg |
-6% |
6% |
22% |
8% |
|
EBITDA, chg |
-23% |
25% |
33% |
11% |
|
Net income, chg |
-30% |
32% |
34% |
10% |
|
EPS(ords), RUB |
61.51 |
81.38 |
109.4 |
120.3 |
|
DPS (ord.), RUB |
45.70 |
24.82 |
39.18 |
59.77 |
|
BPS(ords), RUB |
689.4 |
762.6 |
856.2 |
946.5 |
|
EBITDA margin, % |
17.7% |
20.9% |
22.8% |
23.6% |
|
ROE, % |
9% |
11% |
13% |
13% |
|
Net Debt, RUB mn |
6,603 |
15,828 |
18,483 |
8,533 |
|
ND/EBITDA, x |
0.5x |
0.9x |
0.8x |
0.3x |
|
Net int. cover, x |
3.0x |
4.7x |
6.0x |
7.5x |
Multiples and yields are calculated based on period-average prices where available.
Source: Bloomberg, Company data, VTB Capital Research
Change of Target Price
Rusagro
Sugar Rush!
The new marketing year sees an improvement in operational economics at Rusagro after two seasons of a downbeat environment. The key tailwinds come from the lower supply of soft commodities in Russia, higher global and local prices, a weaker local currency and the nearterm launches of greenfield capacities. For 2019F, we see EBITDA up 33% YoY at RUB 23bn and profitability returning to our mid-cycle forecast of 23%. The strategy update featured an upbeat tone on the expansion, attractive M&A opportunities, and exports to the Asian markets. We raise our 2018-22F estimates 6% across key P&L lines and increase our 12-month Target Price 7% to USD 14.50. That now offers a 41% ETR and we reiterate our Buy recommendation. The stock demands 2019F EV/EBITDA of 4.8x and we consider it as not fully reflecting the recovering business and strong focus on organic growth.
New cycle. We forecast the domestic production of sugar to decline 15% YoY to 5.6mn tonnes in the current season vs. consumption of 6.1mn tonnes, bringing a material easing in ending stocks and leaving behind two years of oversupply. The grain harvest is also 18% YoY lower, at 111mn tonnes, we think, while exports are likely to be maintained at an impressive level, at some 40mn tonnes. Coupled with the recovery in global prices and weaker USDRUB, easing balances bring a 30-60% YoY surge in the current prices of key soft commodities. Thus, the sector is enjoying a recovery in profitability margins from the depressed levels and closer to our mid-cycle range.
Strategic pivot to Asia. Among the announced organic growth projects, we factor only the new breeding capacities in Central Russia and the Russian Far East that are set to see meat volumes surge 1.8x in the next three years. During the strategy update, management highlighted the acquisition of Solnechnye Producty as highly likely, with Rusagro already having operating control and funding working capital. The consolidation of the production and crushing assets could make Rusagro the second largest market player, while the oil and fats EBITDA could go to RUB 6bn, effectively tripling our 2018 forecast. Rusagro is now developing a strategy for the next 7-10 years: Asian markets are its prime focus, with the company considering various partnerships and construction of breeding assets in China.
Financial forecasts and valuation. Favourable prices, margin improvements and new volumes are behind our revised forecast of a 33% YoY increase in EBITDA to RUB 23bn in 2019F. The EBITDA margin goes up 2pp YoY to 23%, closer to our mid-cycle level. For 2018-22F, we raise our key P&L lines 6% on average, and so increase our 12-month Target Price 7% to USD 14.50. On the ETR of 41% that implies, we reiterated our Buy recommendation. The stock demands 2019F EV/EBITDA of 4.8x, but we think that overlooks the build-up in financials and aggressive focus on growth.
Risks. Downside risks are oversupplied commodities markets, poor weather, animal diseases, delays in facility launches and unfavourable M&As.
Nikolay Kovalev, Equities Analyst
+7 495 287 68 65 // nikolay.kovalev@vtbcapital.com
Alexander Gnusarev, Equities Analyst
+7 495 660 67 99 // Alexander.Gnusarev@vtbcapital.com
Prices cited in the body of this report are as of the last close before, or the close on, 19 Nov 2018 (except where indicated otherwise). VTB Capital analysts update their recommendations periodically as required. This research report was prepared by the analyst(s) named above who is(are) associated with Entity and is distributed by JSC VTB Capital and VTB Capital PLC and their non-U.S. affiliates outside the United States. This VTB Capital research report is distributed to investors located within United States by Xtellus Capital Partners, Inc. (“Xtellus”) as a “third-party research report” as defined in Rule 2241(a)(14) and Rule 2242(a)(17) of the U.S. Financial Industry Regulatory Authority. Please refer to the Disclosures section of this report for other important disclosures, including the analyst certification and information required by regulation.

vk.com/id446425943
Russia
Consumer: Consumer Products
Rusagro
Table of contents |
|
Investment summary.................................................................................................. |
4 |
Sugar market: Sweet come back............................................................................... |
6 |
Grain: Drying excessive volumes ............................................................................. |
8 |
Meat: On the verge of self-sufficiency.................................................................... |
10 |
Financial forecasts: Path to mid-cycle EBITDA..................................................... |
12 |
Disclosures ............................................................................................................... |
16 |
21 November 2018 |
2 |
vk.com/id446425943
Russia
Consumer: Consumer Products
VTB Capital Facts & Forecasts
Russia
Consumer / Consumer Products
Rusagro
Prices as of: 19 November 2018
Ticker |
CCY |
Current |
12mo TP |
Rating |
AGRO LI |
USD |
10.58 |
14.50 |
Buy |
Share price performance, 12-mo
15 |
10% |
10 |
0% |
|
|
|
-10% |
5 |
-20% |
|
|
0 |
-30% |
Nov Jan Mar May Jul Sep
AGRO LI, USD, lhs
Relative to RTS Index, %, rhs
Company description
Rusagro is one of Russia's leading agricultural producers, with RUB 79bn of sales and adjusted EBITDA of RUB 14bn in 2017. The company is the second largest sugar producer and pig breeder in Russia, and controls 0.7mn ha of agricultural land. With a high degree of vertical integration, Rusagro was able to deliver an average EBITDA margin of 24% in 2013-17.
Company website
http://www.rusagrogroup.ru/en
Shareholder structure
Free-float |
Moshkovich |
|
20% |
||
family |
||
|
71% |
Treasury shares 2%
Management
7%
Source: Company data, VTB Capital Research
Research team
Nikolay Kovalev / +7 495 287 68 65
Alexander Gnusarev / +7 495 660 67 99
Rusagro
Last model update on: 21 November 2018
|
IFRS |
2016 |
2017 |
2018F |
2019F |
2020F |
|
2021F |
|
|
Company data |
|
|
|
|
|
|
|
|
|
Weighted avg # shares, mn |
134.5 |
134.5 |
134.5 |
134.5 |
134.5 |
|
134.5 |
|
|
Avg market cap, RUB mn |
129,417 |
95,599 |
93,378 |
93,378 |
93,378 |
|
93,378 |
|
|
EV, RUB mn |
134,000 |
102,379 |
109,382 |
112,037 |
102,087 |
|
88,148 |
|
|
Ratios & analysis |
|
|
|
|
|
|
|
|
|
P/E, x |
10.9x |
11.6x |
8.5x |
6.3x |
5.8x |
|
4.9x |
|
|
EV/EBITDA, x |
7.4x |
7.3x |
6.3x |
4.8x |
4.0x |
|
3.0x |
|
|
P/B, x |
1.4x |
1.0x |
0.9x |
0.8x |
0.7x |
|
0.7x |
|
|
FCF yield, % |
-9.8% |
-0.3% |
-8.6% |
2.1% |
19.0% |
|
23.7% |
|
|
Dividend yield (ords), % |
5.5% |
6.4% |
3.6% |
5.6% |
8.6% |
|
9.7% |
|
|
Dividend yield (prefs), % |
|
|
|
|
|
|
|
|
|
EPS(ords), RUB |
87.99 |
61.51 |
81.38 |
109.4 |
120.3 |
|
142.1 |
|
|
CFPS, RUB |
87.80 |
131.4 |
96.49 |
141.1 |
195.4 |
227.7 |
|
|
|
Free CFPS, RUB |
(94.32) |
(1.95) |
(59.65) |
14.67 |
132.2 |
164.5 |
|
|
|
DPS (ords), RUB |
52.97 |
45.70 |
24.82 |
39.18 |
59.77 |
67.54 |
|
|
|
Payout ratio (ords), % |
60.2% |
74.3% |
30.5% |
35.8% |
49.7% |
47.5% |
|
|
|
BPS(ords), RUB |
695.8 |
689.4 |
762.6 |
856.2 |
946.5 |
1,056 |
|
|
|
Revenues growth, % |
16% |
-6% |
6% |
22% |
8% |
10% |
|
|
|
EBITDA, chg |
-25% |
-23% |
25% |
33% |
11% |
13% |
|
|
|
EPS growth, % |
-52% |
-30% |
32% |
34% |
10% |
18% |
|
|
|
EBIT margin, % |
15% |
9% |
13% |
15% |
16% |
17% |
|
|
|
EBITDA margin, % |
21.6% |
17.7% |
20.9% |
22.8% |
23.6% |
|
24.2% |
|
|
Net margin, % |
14.0% |
10.5% |
13.1% |
14.5% |
14.8% |
15.9% |
|
|
|
ROE, % |
12.7% |
8.9% |
10.7% |
12.8% |
12.7% |
|
13.5% |
|
|
ROIC, % |
11.0% |
2.7% |
7.7% |
10.0% |
11.4% |
13.0% |
|
|
|
Capex/Revenues, % |
20% |
22% |
25% |
17% |
8% |
7% |
|
|
|
Capex/Depreciation, x |
2.9x |
2.4x |
3.2x |
2.2x |
1.0x |
|
0.9x |
|
|
Net debt/Equity, % |
5% |
7% |
15% |
16% |
7% |
-4% |
|
|
|
Net debt/EBITDA, x |
0.2x |
0.5x |
0.9x |
0.8x |
0.3x |
|
(0.2x) |
|
|
Net interest cover, x |
3.4x |
3.0x |
4.7x |
6.0x |
7.5x |
|
9.6x |
|
|
Income statement summary, RUB mn |
|
|
|
|
|
|
|
|
|
Revenues |
84,257 |
79,058 |
83,568 |
101,614 |
109,464 |
120,216 |
|
|
|
Cost of sales |
(58,916) |
(58,116) |
(56,709) |
(68,608) |
(73,074) |
(79,814) |
|
|
|
SG&A and other opexp. |
(11,250) |
(13,905) |
(13,703) |
(14,262) |
(14,795) |
(15,678) |
|
|
|
EBITDA |
18,205 |
13,955 |
17,475 |
23,218 |
25,814 |
29,119 |
|
|
|
Depreciation & amortization |
(5,820) |
(7,155) |
(6,537) |
(7,617) |
(8,209) |
(9,138) |
|
|
|
Operating profit |
14,475 |
4,049 |
13,156 |
18,745 |
21,594 |
24,724 |
|
|
|
EBIT |
12,385 |
6,800 |
10,938 |
15,601 |
17,605 |
19,982 |
|
|
|
Net interest income/(exp.) |
852 |
1,930 |
1,272 |
642 |
203 |
898 |
|
|
|
Profit before tax |
14,213 |
5,951 |
14,438 |
19,398 |
21,808 |
|
25,633 |
|
|
Income tax |
(268) |
(418) |
(1,265) |
(1,533) |
(1,621) |
|
(1,768) |
|
|
Net income |
11,834 |
8,273 |
10,945 |
14,709 |
16,187 |
|
19,112 |
|
|
Cash flow statement summary, RUB mn |
|
|
|
|
|
|
|
|
|
Cash flow from operations |
11,809 |
17,673 |
12,978 |
18,973 |
26,286 |
|
30,625 |
|
|
Working capital changes |
(5,140) |
3,253 |
(5,461) |
(5,868) |
(1,907) |
|
(1,479) |
|
|
Capex |
(16,918) |
(17,199) |
(21,000) |
(17,000) |
(8,500) |
|
(8,500) |
|
|
Other investing activities |
10,729 |
2,218 |
3,604 |
3,224 |
2,535 |
|
2,981 |
|
|
Free cash flow |
(12,685) |
(262) |
(8,022) |
1,973 |
17,786 |
|
22,125 |
|
|
Share issue (reacquisition) |
16,335 |
- |
- |
- |
- |
- |
|
|
|
Dividends paid |
(7,124) |
(6,146) |
(3,338) |
(5,269) |
(8,039) |
(9,084) |
|
|
|
Net change in borrowings |
(11,667) |
(907) |
2,667 |
(7,583) |
(7,333) |
(7,083) |
|
|
|
Other financing cash flow |
3,341 |
2,574 |
- |
- |
- |
- |
|
|
|
Movement in cash |
2,350 |
(1,891) |
(5,089) |
(7,655) |
4,950 |
8,939 |
|
|
|
Balance sheet summary, RUB mn |
|
|
|
|
|
|
|
|
|
Cash and equivalents |
23,982 |
23,318 |
18,230 |
10,575 |
15,525 |
24,463 |
|
|
|
PP&E |
45,791 |
56,390 |
70,853 |
80,236 |
80,527 |
79,889 |
|
|
|
Goodwill |
2,225 |
1,826 |
1,826 |
1,826 |
1,826 |
1,826 |
|
|
|
Other assets |
81,244 |
75,875 |
82,829 |
90,457 |
92,936 |
94,859 |
|
|
|
Total assets |
153,242 |
157,410 |
173,738 |
183,094 |
190,814 |
201,038 |
|
|
|
Interest bearing debt |
44,503 |
46,651 |
51,651 |
46,651 |
41,651 |
36,651 |
|
|
|
Other liabilities |
15,151 |
18,031 |
19,523 |
21,283 |
21,855 |
22,299 |
|
|
|
Total liabilities |
59,653 |
64,682 |
71,174 |
67,934 |
63,507 |
58,950 |
|
|
|
Total shareholder's equity |
93,349 |
92,552 |
102,388 |
114,983 |
127,131 |
141,911 |
|
|
|
Minority interest |
240 |
176 |
176 |
176 |
176 |
|
176 |
|
|
Net working capital |
27,157 |
22,089 |
27,550 |
33,418 |
35,325 |
36,804 |
|
|
|
Net Debt |
4,343 |
6,603 |
15,828 |
18,483 |
8,533 |
(5,406) |
|
|
|
Capital |
137,851 |
139,203 |
154,039 |
161,634 |
168,782 |
178,563 |
|
|
21 November 2018 |
3 |

vk.com/id446425943
Russia
Consumer: Consumer Products
Rusagro
Investment summary
The new marketing year sees an improvement in operational economics at Rusagro after two seasons of a downbeat environment. The key tailwinds come from the lower supply of soft commodities in Russia, higher global and local prices, a weaker local currency and the near-term launches of greenfield capacities. For 2019F, we see EBITDA up 33% YoY at RUB 23bn and profitability returning to our mid-cycle forecast of 23%. The strategy update featured an upbeat tone on the expansion, attractive M&A opportunities, and exports to the Asian markets. We raise our 2018-22F estimates 6% across key P&L lines and increase 12-month Target Price 7% to USD 14.50. That now offers a 41% ETR and we reiterate our Buy recommendation. The stock demands 2019F EV/EBITDA of 4.8x and we consider it as not fully reflecting the launch of new cycle for soft commodities, recovering business and strong focus on organic growth and export opportunities.
We forecast the domestic production of sugar to decline 15% YoY to 5.6mn tonnes in the current season vs. consumption of 6.1mn tonnes, bringing a material easing in ending stocks (down 30% YoY to 1mn tonnes by July 2019) and leaving behind two years of oversupply. The grain harvest is also 18% YoY lower, at 111mn tonnes, according to IKAR, while exports are likely to be maintained at an impressive level, at some 40mn tonnes, making Russia the largest global trader of wheat. Coupled with the recovery in global prices and weaker USDRUB, easing balances bring a 30-60% YoY surge in the current domestic prices of key soft commodities. Thus, the sector is enjoying a recovery in profitability margins from the depressed levels and closer to our mid-cycle range performance. Meat consumption in Russia is flattish as the current intake of 76kg per capita is slightly higher than the rational norm of consumption and real incomes are still pressured. For 2019, we factor poultry and pork prices growing below CPI, reflecting the elevated comparison base (up 11% YoY on average in 2018).
Among the announced organic growth projects, we factor only the new breeding capacities in Central Russia and the Russian Far East that are set to see meat volumes surge 1.8x in the next three years. During the strategy update, management highlighted the acquisition of Solnechnye Producty as highly likely, with Rusagro already having operating control and funding working capital. The consolidation of the production and crushing assets could make Rusagro the second largest market player, while the oil and fats EBITDA is set to go to RUB 6bn, according to the management, effectively tripling our 2018 forecast. Rusagro is now developing a strategy for the next 7-10 years: Asian markets are its prime focus, with the company considering various partnerships and construction of bleeding assets in China and adjacent regions.
Favourable prices, margin improvements and new volumes are behind our revised forecast of a 33% YoY increase in EBITDA to RUB 23bn in 2019F. The EBITDA margin goes up 2pp YoY to 23%, closer to our mid-cycle level. The company is undergoing a peak in the capital expenditures and we factor RUB 38bn in 2018-19 while leverage is capped at 0.9x net debt / EBITDA. For 2018-22F, we raise our key P&L lines 6% on average, and so increase our 12-month Target Price 7% to USD 14.50. On the ETR of 41% that implies, we reiterate our Buy recommendation. The stock demands 2019F EV/EBITDA of 4.8x, but we think that overlooks the launch of new cycle in the soft commodities, build-up in financials and aggressive focus on growth and export opportunities.
21 November 2018 |
4 |
vk.com/id446425943
Russia
Consumer: Consumer Products
Rusagro
Figure 1: Rusagro DCF
RUB mn |
2018F |
2019F |
2020F |
2021F |
2022F |
TV |
EBIT |
10,938 |
15,601 |
17,605 |
19,982 |
21,194 |
22,041 |
Taxes |
(958) |
(1,233) |
(1,308) |
(1,378) |
(1,437) |
(1,494) |
Fully-taxed EBIT |
9,980 |
14,368 |
16,297 |
18,603 |
19,757 |
20,547 |
Depreciation |
6,537 |
7,617 |
8,209 |
9,138 |
9,759 |
10,149 |
Changes in working capital |
(5,461) |
(5,868) |
(1,907) |
(1,479) |
(1,577) |
(1,535) |
Capital expenditure |
(21,000) |
(17,000) |
(8,500) |
(8,500) |
(8,500) |
(10,149) |
Unleveraged free cash flow |
(9,944) |
(882) |
14,098 |
17,762 |
19,439 |
19,012 |
Discount rate (required WACC) |
15.0% |
15.0% |
15.0% |
15.0% |
15.0% |
15.0% |
Cumulative discount |
0.87 |
0.76 |
0.66 |
0.57 |
0.50 |
0.50 |
Terminal growth rate |
|
|
|
|
|
4.0% |
Discounted cash flows |
(8,647) |
(667) |
9,268 |
10,153 |
9,662 |
85,861 |
RUB mn |
01-Jan-18 |
20-Nov-18 |
12-mo TP |
|
|
|
Fair EV |
105,631 |
129,550 |
|
|
|
|
Minority interest |
176 |
132 |
|
|
|
|
Net debt, eop |
6,603 |
15,102 |
|
|
|
|
Fair equity value |
98,852 |
114,316 |
134,721 |
|
|
|
Number of GDRs |
135 |
135 |
135 |
|
|
|
Fair value per GDR, RUB |
735 |
850 |
1,002 |
|
|
|
Exchange rate |
|
65.62 |
69.10 |
|
|
|
Fair value per GDR, USD |
|
12.95 |
14.50 |
|
|
|
Current GDR price, USD |
|
10.58 |
10.58 |
|
|
|
Upside |
|
22% |
37% |
|
|
|
ETR |
|
|
41% |
|
|
|
Source: Bloomberg, VTB Capital Research
Figure 2: Rusagro implied multiples
|
2018F |
2019F |
2020F |
2021F |
2022F |
EV/Sales |
1.6x |
1.3x |
1.2x |
1.1x |
1.0x |
EV/EBITDA |
7.4x |
5.6x |
5.0x |
4.4x |
4.2x |
P/E |
10.4x |
7.8x |
7.1x |
6.0x |
5.4x |
P/CF |
8.8x |
6.0x |
4.3x |
3.7x |
3.5x |
Source: VTB Capital Research
Figure 3: Rusagro current multiples
|
2018F |
2019F |
2020F |
2021F |
2022F |
EV/Sales |
1.3x |
1.1x |
0.9x |
0.7x |
0.6x |
EV/EBITDA |
6.3x |
4.8x |
4.0x |
3.0x |
2.4x |
P/E |
8.5x |
6.3x |
5.8x |
4.9x |
4.4x |
P/CF |
7.2x |
4.9x |
3.6x |
3.0x |
2.9x |
Source: VTB Capital Research
21 November 2018 |
5 |
vk.com/id446425943 |
Rusagro |
Russia |
|
Consumer: Consumer Products |
|
Sugar market: Sweet come back
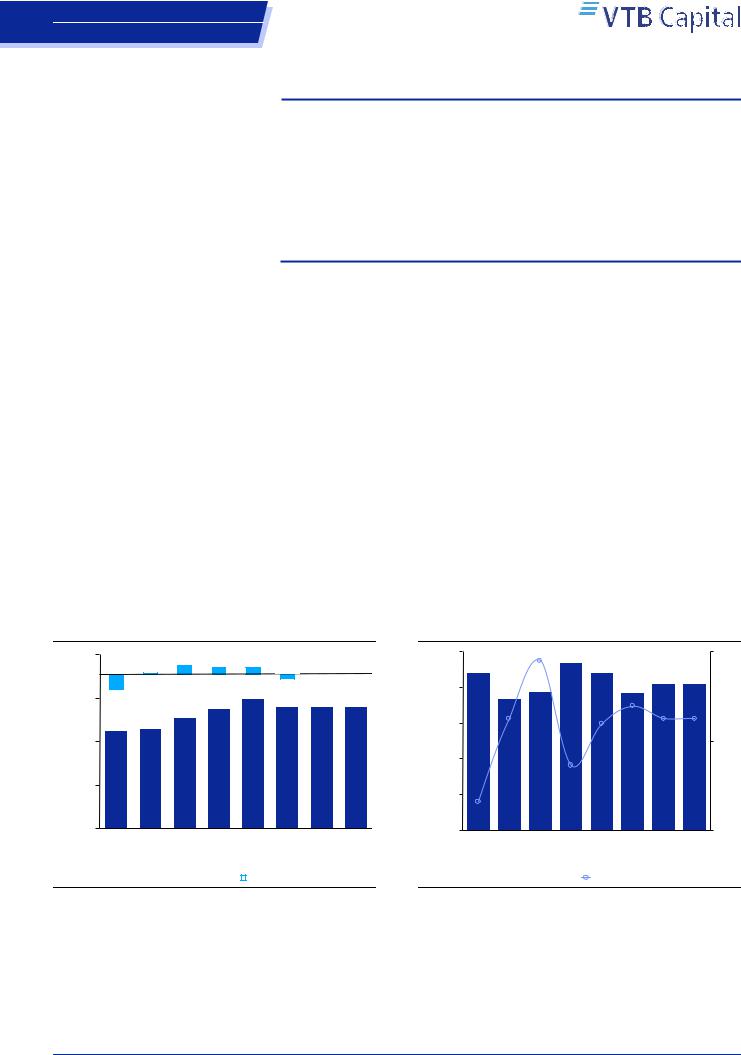
Figure 4: Beet planting area
1,600 |
|
|
|
|
|
1% |
|
11% |
8% |
|
||||
|
|
|
|
|
|
|
|
|
||||||
1,200 |
|
|
|
|
|
|
|
|
|
|
|
|
||
|
|
|
|
|
|
|
|
|
|
|
|
|
||
|
|
|
|
|
|
|
|
|
|
|
|
|
||
-21% |
|
|
|
1,022 |
1,108 |
|||||||||
|
|
|
|
|
|
|
918 |
|
|
|
||||
000'ha |
|
906 |
|
|
|
|
|
|
|
|||||
800 |
|
|
|
|
|
|
|
|
|
|
|
|
|
|
|
|
|
|
|
|
|
|
|
|
|
|
|
|
|
|
400 |
|
|
|
|
|
|
|
|
|
|
|
|
|
|
0 |
|
|
MY14 |
MY15 |
|
MY16 |
|
MY17 |
|||||
|
|
|
|
|
|
|||||||||

 Cultivated area
Source: IKAR, VTB Capital Research
The 6% cut in beet planting area and 13% lower harvest yields have brought a 15% decline in sugar production and market normalisation after two years of oversupply.
Our base case assumes sugar production at 5.6mn tonnes in MY19F, 10% below consumption. Ending stocks go down 30% YoY to mid-cycle 1mn tonnes.
We see sugar prices recovering 20% YoY in 2019F to RUB 34/kg from the depressed base. Such prices would bring EBITDA margins of some 25% for farmers and the refiners of beet sugar.
The sugar market in Russia was oversupplied in the last two marketing years, on the back of the excess planting area and favourable weather conditions. The surge in domestic sugar prices in 2014-15 made beet the most profitable crop in farmers’ rotation mix and thereafter caused a 9% CAGR in the planting area to 1.2mn ha in MY18. Harvest yields also rose to historical highs of 45.7 tonnes per ha, resulting in the beet sugar supply reaching an unmatched 6.4mn tonnes per year in 2016-17 vs. the internal consumption 6.0mn tonnes.
Refining from beet is inferior to that from cane, in terms of profitability, and exports from Russia face significant headwinds. As a result, ending stocks reached a record level of 1.4mn tonnes at July 2018 and put material pressure on RUB prices, which declined on average 17% YoY in the last two seasons (August 2016-July 2018). As refineries have more power on the sugar market in Russia than farmers, we saw the EBITDA margin for sugar producers slide to a minimum of 10% while beet became loss making for farmers.
Worsening returns made beet suppliers cut their planting area under beet 6% YoY for the current harvesting campaign (August-November 2018). Dry weather conditions during the summer were also behind the 13% YoY decline in harvest yields for beet, with the worst performance in the Russian south (it corrected some 30% YoY). However, the sugar content is impressive this year, bringing a 40bp YoY improvement to 14.8%.
8% |
|
|
|
|
1,197 |
-6% |
|
|
|
1,126 |
1,126 |
1,126 |
||
|
|
MY18 |
MY19F |
MY20F |
MY21F |
|
Chng, YoY |
|
|
|
|
|
|
||
|
|
|
||
Figure 5: Beet harvest and sugar content yields
50 |
44.2 |
15.8% |
47.0 |
|
|
|
|
40 |
37.0 |
38.8 |
|
|
|
|
14.5%
MT/ha |
30 |
|
|
|
20 |
|
|
|
|
|
|
|
|
|
|
|
|
|
13.5% |
|
10 |
|
|
|
|
12.6% |
|
|
|
|
0 |
|
|
|
|
MY14 |
MY15 |
MY16 |
MY17 |

 Beet harvest yield (lhs)
Source: IKAR, VTB Capital Research
16%
44.3
41.041.0
38.5
14.8%
14.5% 14.5%
14.4%
14%
12%
MY18 |
MY19F |
MY20F |
MY21F |
Sugar content yield (rhs)
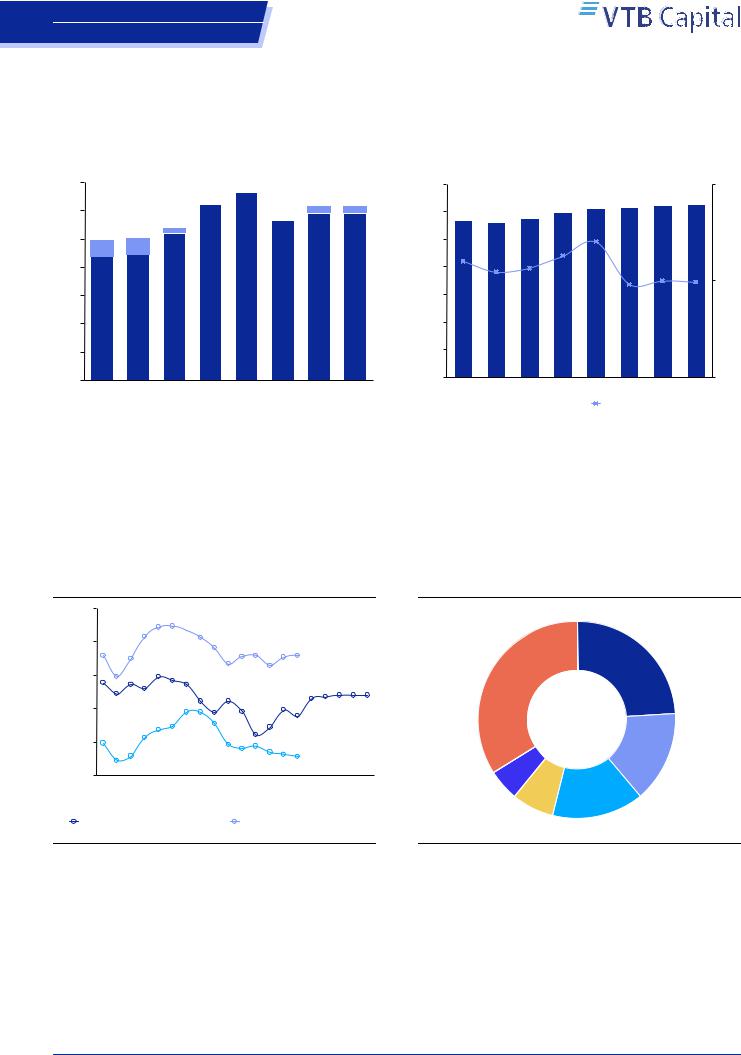
The cut in planting area and lower harvest yields for beet mean a 15% YoY drop in the production of beet sugar to 5.6mn tonnes in MY19F, we forecast. With consumption of 6.1mn tonnes, the market supply-demand balance sees a material normalisation and ending stocks go down 30% YoY to 1.0mn tonnes as of July 2019F, representing 16% of annualised consumption and a mid-cycle level to us. Russia is going to get through the marketing year without having to import cane sugar, which ten years ago accounted for up to 40% of consumption.
21 November 2018 |
6 |
vk.com/id446425943 |
Rusagro |
|
|
|
|
|
|
|
|
|
|
|
|
|
|
|
|||||||
|
Russia |
|
|
|
|
|
|
|
|
|
|
|
|
|
|
|
|
|
|
|
|
||
|
Consumer: Consumer Products |
|
|
|
|
|
|
|
|
|
|
|
|
|
|
|
|
||||||
|
|
|
|
|
|
|
|
Our base case points to normalised beet sugar production of almost 6mn tonnes, |
|||||||||||||||
|
|
|
|
|
|
|
|
broadly matching domestic consumption in MY19-21F. To balance the market, we |
|||||||||||||||
|
|
|
|
|
|
|
|
factor in 0.3mnt of imported cane during the low season for beet supply (March-July) |
|||||||||||||||
|
|
|
|
|
|
|
|
and to support utilisation at refineries. |
|
|
|
|
|
|
|
|
|||||||
|
Figure 6: Sugar production in Russia |
|
|
Figure 7: Sugar consumption and ending stocks |
|
||||||||||||||||||
|
|
7 |
|
|
|
6.3 |
|
6.6 |
|
|
|
7 |
|
|
|
|
|
|
|
|
|
|
2 |
|
|
6 |
|
|
|
|
6.2 |
6.2 |
|
|
6 |
|
|
|
|
5.8 |
6.0 |
6.1 |
6.1 |
6.2 |
6.3 |
|
|
|
|
|
|
|
|
|
5.6 |
|
|
|
5.7 |
5.6 |
|
|
|
|
|
||||||
|
|
|
|
|
5.4 |
|
|
|
|
|
|
|
|
|
|
||||||||
|
|
|
|
|
|
|
|
|
|
|
|
|
|
|
|
|
|
|
|
|
|
|
|
|
|
5 |
5.0 |
5.1 |
|
|
|
|
|
5 |
|
|
|
|
|
|
1.4 |
|
|
|
|
||
|
|
|
|
|
|
|
|
|
|
|
|
|
|
|
|
1.3 |
|
|
|
|
|
||
|
|
|
|
|
|
|
|
|
|
|
|
|
1.2 |
|
|
|
|
|
|
|
|||
|
|
|
|
|
|
|
|
|
|
|
tonnesmn |
|
1.1 |
1.1 |
|
|
|
|
|
tonnesmn |
|||
|
tonnesmn |
4 |
|
|
|
|
|
|
|
|
4 |
|
|
|
|
|
|
|
|
||||
|
|
|
|
|
|
|
|
|
|
|
|
|
|
|
1.0 |
1.0 |
1.0 |
||||||
|
|
|
|
|
|
|
|
|
|
|
|
|
|
|
|
|
1 |
||||||
|
|
|
|
|
|
|
|
|
|
|
|
|
|
|
|
|
|
|
|
||||
|
|
|
|
|
|
|
|
|
|
|
|
|
|
|
|
|
|
|
|
|
|
|
|
|
|
3 |
|
|
|
|
|
|
|
|
|
3 |
|
|
|
|
|
|
|
|
|
|
|
|
|
2 |
|
|
|
|
|
|
|
|
|
2 |
|
|
|
|
|
|
|
|
|
|
|
|
|
1 |
|
|
|
|
|
|
|
|
|
1 |
|
|
|
|
|
|
|
|
|
|
|
|
|
0 |
MY14 |
MY15 MY16 MY17 |
MY18 MY19F MY20F MY21F |
0 |
MY14 |
MY15 |
MY16 MY17 |
MY18 MY19F MY20F MY21F |
0 |
||||||||||||
|
|
|
|
|
|||||||||||||||||||
|
|
|
|
|
Beet sugar production |
|
Cane Sugar production |
|
|
|
|
|
|
Total consumption (lhs) |
Sugar stock, eop (rhs) |
|
|||||||
|
|
|
|
|
|
|
|
|
|
|
|
|
|||||||||||
|
|
|
|
|
|
|
|
|
|
|
|
|
|
|
|
|
|
|
|
|
|||
|
Source: IKAR, VTB Capital Research |
|
|
|
Source: IKAR, VTB Capital Research |
|
|
|
|
|
|
||||||||||||
Domestic sugar prices were on a rapid declining trend in 2016-17, seeing an overhang from the excessive supply and stocks. The reflection point came with the launch of the new season in September and current prices are running 40% YoY higher. For 2019F, we factor an average sugar price of RUB 34/kg resulting in an EBITDA margin of 25%, both for beet growers and refineries. We do not anticipate significant changes in the consolidation level on the Russian sugar market, meaning greater downside risks for farmers in case of a looser supply-demand balance for sugar.
Figure 8: Sugar prices
60
54.354.653.4
51.4 51.2
51.2
|
50 |
45.9 |
|
|
|
|
|
|
|
48.1 |
|
45.645.8 |
|
45.345.9 |
|
|
|
|
|
|
||
|
|
44.9 |
|
|
|
|
|
|
|
|
|
|
|
|
|
|
||||||
/ kg |
40 |
37.739.5 |
37.2 |
|
39.538.437.2 |
|
|
43.3 |
|
|
42.8 |
|
33.0 |
33.5 34.0 |
34.034.0 |
|||||||
RUB |
|
|
|
|
|
|
|
|
32.2 |
|
32.1 |
|
|
|
|
|||||||
30 |
|
|
|
35.9 |
|
|
|
|
|
|
|
29.6 |
|
|
||||||||
|
34.4 |
|
|
|
28.9 |
|
28.8 |
|
29.1 |
|
|
27.8 |
|
|
|
|
|
|
||||
|
|
|
|
|
|
|
|
|
|
|
|
|
|
|
|
|
||||||
|
|
|
|
|
|
|
|
|
|
|
|
|
|
|
|
|
|
|||||
|
|
|
|
|
21.4 |
23.624.6 |
|
28.9 |
|
|
|
22.2 |
24.4 |
|
|
|
|
|
|
|
|
|
|
|
19.6 |
|
|
|
|
|
|
25.5 |
|
|
|
|
|
|
|
|
|
|
|
||
|
|
|
|
|
|
|
|
|
|
|
|
|
|
|
|
|
|
|
|
|||
|
20 |
|
|
|
|
|
|
|
|
|
|
|
|
|
|
|
|
|
|
|
||
|
|
15.7 |
|
|
|
|
|
|
19.318.118.8 |
|
|
|
|
|
|
|
|
|
||||
|
|
|
|
|
|
|
|
|
|
|
|
|
|
|
|
|
|
|
||||
|
|
|
|
|
|
|
|
|
|
|
16.916.3 |
15.6 |
|
|
|
|
|
|
||||
|
|
|
14.5 |
|
|
|
|
|
|
|
|
|
|
|
|
|
|
|
|
|||
|
10 |
|
|
|
|
|
|
|
|
|
|
|
|
|
|
|
|
|
|
|
||
|
|
|
|
|
|
|
|
|
|
|
|
|
|
|
|
|
|
|
|
|
||
|
1Q15 |
2Q15 |
3Q15 |
4Q15 |
1Q16 |
2Q16 |
3Q16 |
4Q16 |
1Q17 |
2Q17 |
3Q17 |
4Q17 |
1Q18 |
2Q18 |
3Q18 |
4Q18F |
1Q19F |
2Q19F |
3Q19F |
4Q19F |
||
|
|
|||||||||||||||||||||
|
White Sugar, Krasnodar, EXW |
|
|
Alternative price from cane |
|
|
||||||||||||||||
 ICE Contract 11
Source: Bloomberg, IKAR, VTB Capital Research
Figure 9: Sugar market consolidation
Prodimex, 24%
Others, 34%
Rusagro, 15%
Agrokompleks
Tkacheva, 5%
Syukden, 7% |
Dominant, 15% |
|
Source: Souzrossakhar, VTB Capital Research
21 November 2018 |
7 |