

vk.com/id446425943 |
CAPITAL MARKETS RESEARCH |
|
Credit Markets Review and Outlook
Credit Markets Review and Outlook
By John Lonski, Chief Economist, Moody’s Capital Markets Research, Inc.
Market Implied Ratings Differ on the Likely Direction of Baa3
Ratings
Baa3-grade issuers constitute the bottom rung of the investment-grade ratings ladder. Once a Baa3 rating is subject to a “fallen angel” downgrade to speculative-grade, investors who are mandated to hold only investment-grade obligations must sell the now high-yield debt.
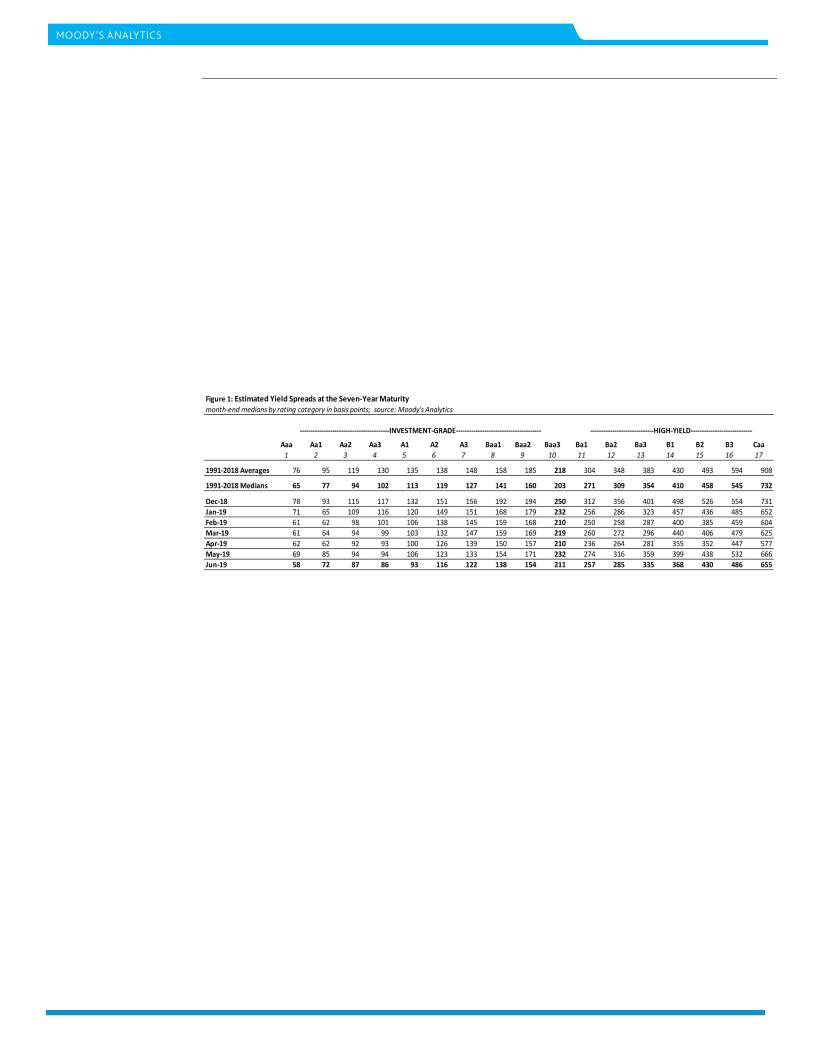
Because Baa3 ratings border high-yield space, it is conceivable that buyers of Baa3 obligations might demand additional yield as compensation for the above-average risk of a fallen-angel downgrade. According to Moody’s Analytics’ 1991 through 2018 history of 336 estimated month-end yields and spreads at the seven-year maturity, the median spread over Treasuries jumps up from the 160 basis points of Baa2 to the 203 bp of Baa3. The next lowest rating’s notch of Ba1, or the top rung of the highyield rating’s ladder, shows a long-term median spread of 271 bp.
When moving down the investment-grade ratings ladder notch-by-notch, the biggest jump in the median spread is the 43 bp from Baa2 to Baa3. The next largest is the 19 bp from the 141 bp of Baa1 to the 160 bp of Baa2. For the seven gaps between notches above Baa2, the average difference between the median spreads is 11 bp for the period of 1991 through 2018.
When moving down the high-yield rating’s ladder, the most pronounced increases in spreads occurred at the lowest speculative-grade ratings. The 1991-2018 sample of median high-yield spreads shows a relatively wide gap of 68 bp between Baa3 and Ba1. Thereafter the spread widened by 38 bp to the 309 bp of Ba2 and, then, by 46 bp to the 354 bp of Ba3. The next big jump by the median spread was the 87 bp from the 458 bp of B2 to the 545 of B3. The most jarring widening of all was the 186 bp increase from B3 to the 732 bp of Caa. The latter category includes bonds very close to, if not already in, default.
Only the Baa3 Spread Was Wider than Its Long-Term Median as of the End of June
The latest available estimate of median spreads applies to the end of June 2019. June 2019’s Baa3 spread of 211 bp exceeds its 1991-2018 median by 8 bp. By contrast, each of the other rating categories shows a spread that is thinner than their respective 1991-2018 median.
More specifically, June 2019’s spreads for investment-grade ratings above Baa3 were eight basis points less, on average, compared to their medians of 1991-2018. In addition, June 2019’s spreads for high-yield rating categories trailed their 1991-2018 medians by 38 bp, on average. High-yield’s deepest shortfalls relative to the long-term medians applied to the two lowest rating categories. June 2019’s median yield spread of 486 bp for B3 was 60 bp under its 1991-2018 median, while June 2019’s 655 bp spread for Caa was 77 bp under its long-term median.
2 |
JULY 11, 2019 |
CAPITAL MARKETS RESEARCH / MARKET OUTLOOK / MOODYS.COM |

vk.com/id446425943 |
CAPITAL MARKETS RESEARCH |
|
Credit Markets Review and Outlook
Corporate Bond Yields and EDFs Provide the Basis for Market Implied Ratings
Bond implied ratings provide an estimate of the corporate bond market’s view of where a senior unsecured bond credit rating should reside. By contrast, the expected default frequency metric can estimate an issuer’s implied bond rating by way of an issuer’s vulnerability to default.
Though a bond implied rating is entirely market driven, an EDF-implied rating is only partly market driven. An issuer’s EDF, or probability of default, will be greater (i) the lower is an issuer’s market value of net worth and (ii) the more volatile is the market value of an issuer’s business assets. The market value of net worth equals the market value of an issuer’s business assets less the issuer’s outstanding debt. Unlike the EDF-implied rating, the bond implied rating does not directly consider the issuer’s indebtedness.
Bond Implied Ratings Offer a Somewhat Negative View of Baa3 Credits
Friday, July 5 will be the date of reference for the following discussion concerning the difference between the market implied and actual ratings of US/Canadian issuers whose senior unsecured bond rating is Baa3, or the bottom rung of the investment-grade ratings ladder. All ratings below Baa3 are labeled speculative-grade or high-yield.
July 5’s available corporate bond prices included 105 nonfinancial-company issuers having a senior, unsecured rating of Baa3. Among July 5’s batch of Baa3-rated issuers, 24, or 23%, had a bond implied rating above Baa3. For these 24 “under-rated” issuers, the derived average and median premia above Baa3 were 1.25 and 1.00 notches, respectively. (One notch above Baa3 equals Baa2, while two notches above Baa3 corresponds to Baa1.)
The bond implied ratings of 39, or 37%, of July 5’s Baa3 sample equaled Baa3. The remaining 42, or 40%, of July 5’s sample of actual Baa3 rated issuers produced a bond implied rating that was less than Baa3.
A rating of less-than-Baa3 is necessarily equivalent to a high-yield, or speculative-grade, bond rating. For the 42 prospective “high-yield” issuers, the average discount to the Baa3 rating was 1.55 notches and the median discount was 1.00 notches. (Relative to a Baa3 rating, a one-notch discount equals Ba1, a twonotch discount equals Ba2.)
For July 5’s entire 105 company sample of Baa3-rated issuers, the average bond implied rating was 0.33 notches under Baa3. However, the sample’s median bond implied rating equaled Baa3.
EDF-Derived Market Implied Ratings Offered a More Positive View of Baa3 Credits
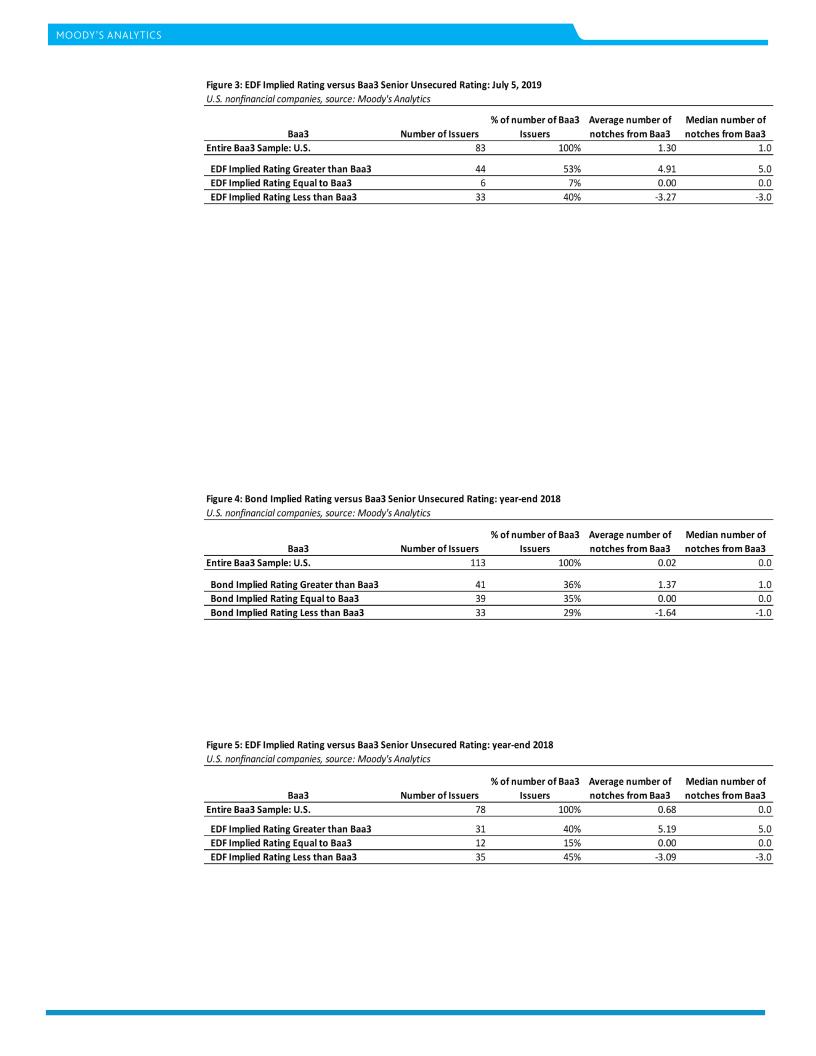
In stark contrast, July 5’s EDF-derived senior-unsecured ratings exceeded the accompanying Baa3-grade rating by 1.30 notches, on average, while showing a medium premium of one notch.
Of July 5’s 83 EDF-implied ratings for nonfinancial-company Baa3-grade issuers, 44, or 53%, produced an implied rating that exceeded Baa3 by 4.91 notches, on average. (A1 and A2 correspond to five and four notches above Baa3, respectively.)
Only six, or 7%, of the EDF-implied ratings were equal to Baa3. The remaining 33, or 40%, of July 5’s EDF-implied ratings were less than Baa3, where each of the 33 implied a high-yield rating. For the 33 issuers, whose Baa3 rating was deemed too high by the EDF methodology, the average discount to Baa3 was 3.27 notches and the median discount was 3.00 notches. Discounts of 3 and 4 notches to Baa3 are equivalent to high-yield ratings of Ba3 and B1.
July 5’s entire 83-issuer sample of EDF implied ratings for Baa3-grade issuers supplied an average premium of 1.30 notches above Baa3, where the median premium equaled one notch.
3 |
JULY 11, 2019 |
CAPITAL MARKETS RESEARCH / MARKET OUTLOOK / MOODYS.COM |
vk.com/id446425943 |
CAPITAL MARKETS RESEARCH |
|
Credit Markets Review and Outlook
For the Baa3 ratings category, market implied ratings can supply a vastly different assessment regarding where a corporate credit rating might be headed depending on whether a bondor EDF-implied model is used. However, because an EDF implied rating partly depends on the issuer’s outstanding amount of debt, the EDF implied rating may be less susceptible to swings in market sentiment relative to the bond implied rating.
Despite Thinner Spread since End of 2018, Bond Implied Ratings of Baa3 Group Softens
The estimated median Baa3 yield spread at the seven-year maturity narrowed from year-end 2018’s 250 bp to June 2019’s 211 bp. However, despite the spread narrowing, the bond implied ratings of Baa3-grade issuers worsened from the end of 2018 to July 5.
Year-end 2018 supplied bond implied ratings for 113 Baa3-rated issuers. The bond implied rating averaged an imperceptible 0.02 notches above Baa3, where the median bond implied rating equaled Baa3. As of year-end 2018, 41, or 36%, of the sample’s bond implied ratings exceeded Baa3 by 1.37 notches, on average. The “under-rated” group also showed a median premium of one notch above Baa3. The 33, or 29%, of the sample that produced a speculative-grade bond-implied-rating of less than Baa3 supplied an average discount of 1.64 notches under Baa3 and a median discount of one notch.
Also, as of year-end 2018, the EDF implied ratings of 78 Baa3-grade issuers supplied an average premium over Baa3 of 0.68 notches, where the median EDF implied rating equaled Baa3. For 31, or 40%, of the 78-issuer sample, the EDF implied rating topped Baa3. This group showed strikingly high average and median premia of 5.19 and 5.00 notches, respectively. At the other extreme, 35, or 45%, of the sample yielded an EDF implied rating that was less than Baa3. This group’s average discount of 3.09 notches was joined by a median discount of 3.00 notches.
Thus, from year-end 2018 to July 5, 2019, the bond-implied ratings of nonfinancial-company Baa3 issuers improved, on balance, while the group’s EDF-implied ratings improved. Perhaps the corporate bond market senses a worsening of credit fundamentals that the Baa3-grade EDFs have yet to detect.
4 |
JULY 11, 2019 |
CAPITAL MARKETS RESEARCH / MARKET OUTLOOK / MOODYS.COM |