

190
Chapter XV
Streaming of Continuous Media for Distance Education Systems
Ali Dashti
Kuwait University, Kuwait
Maytham Safar
Kuwait University, Kuwait
ABSTRACT
Distance education created new challenges regarding the delivery of large size isochronous continuous streaming media (SM) objects. In this paper, we consider the design of a framework for customized SM presentations, where each presentation consists of a number of SM objects that should be retrieved and displayed to the user in a coherent fashion. We describe a retrieval optimizer (Prime) that captures the flexibilities and requirements imposed by the user query, user profile, and session profile. Then, it determines how this query script should be imposed against the continuous media (CM) server to reduce contention. We also provide a cost model to evaluate each proposed plan. Finally, we explain the role of memory buffering in alleviating the server bandwidth fragmentation problem. Our preliminary experimental results show the feasibility and effectiveness of our proposed model and techniques in generating near optimal retrieval.
INTRODUCTION
Distance education is the largest growing section of education in the world today. It defines a new way of interacting teaching that uses a number of
different technologies to deliver the course material to remote students (usually off-campus). In order to keep in pace with the rapid developments inthefieldofhighereducation,KuwaitUniversity established a nonprofit center specialized in the
Copyright © 2009, IGI Global, distributing in print or electronic forms without written permission of IGI Global is prohibited.
Streaming of Continuous Media for Distance Education Systems
areaofdistanceeducationandvideoconferencing, The Kuwait University Distance Learning and Videoconferencing Center, in 2001. Such a center is a large consumer of educational technology, especially multimedia systems (MM). The audiovisual system used by the instructors displays media from different sources, such as a dedicated personal computer, laptop, VCR, DVD, or digital camera. The media is usually delivered through the Internet, cable, or satellite television, which created new challenges regarding the delivery of continuousmedia(streaming),especiallythrough the Internet.
Multimedia (MM) systems utilize audio and visual information, such as video, audio, text, graphics, still images, and animations to provide effective means for communication. These systems utilize multihuman senses in conveying information, and they play a major role in educa- tionalapplications(suchase-learninganddistance education), library information systems (such as digital library systems), entertainment systems (such as video-on-demand and interactive TV), communication systems (such as mobile phone multimediamessaging),militarysystems(suchas Advanced Leadership Training Simulation), and so forth. Due to the exponential improvements (of the past few years) in solid state technology (i.e., processor and memory) as well as increased bandwidthandstoragecapacitiesofmodernmagnetic disk drives, it has been technically feasible toimplementthesesystemsinwaysweonlycould have dreamed about a decade ago.
A challenging task when implementing MM systems for distance education is to support the sustained bandwidth required to display streaming media (SM) objects, such as video and audio objects. Unlike traditional data types, such as records, text, and still images, SM objects are usually large in size. For example, a 2-hour MPEG-2 encoded movie requires approximately 3.6 gigabytes (GB) of storage (at a display rate of 4 megabits per second (Mb/s)). In addition, the isochronousnatureofSMobjectsrequirestimely,
real-time display of data blocks at a prespecified rate. For example, the NTSC video standard requires that 30 video frames per second be displayed to a viewer. Any deviation from this real-time requirement may result in undesirable artifacts, disruptions, and jitters, collectively termed hiccups. There has been a number of studies on the design of SM servers (Berson, Ghandeharizadeh, Muntz, & Ju, 1994; Gemmel, 1996; Gemmel, Vin, Kandlur, Rangan, & Rowe, 1995;Ghandeharizadeh,Dashti,&Shahabi,1995; Ghandeharizadeh, Zimmerman, Shi, Rejaie, Ierardi, & Li, 1997; Goel, Shahabi, Yao, & Zimmerman, 2002; Muntz, Santos, & Berson, 1997; Ozden, Rastogi, & Silberschatz, 1995; Shahabi, Zimmerman, Fu, & Yao, 2002; Zimmermann, Fu, Shahabi, Yao, & Zhu, 2001). For a complete overview of SM server design issues, see Dashti, Kim, Shahabi, and Zimmerman (2003).
In many new SM applications, the result of a user request (i.e., query) is a set of SM objects that should be retrieved and displayed to the user in a coherentfashion.Ingeneral,theseapplicationscan be classified according to their: (1) display, and
(2) presentation paradigms. The former specifies whether the application displays the SM objects in a single-pass or in multiple-passes, while the latter specifies whether the presentations are generated statically or dynamically according to user requirements (e.g., user profile, user query, etc.). Figure 1 illustrates the four classes of MM applications. The multipass class of applications do not impose new challenges in the retrieval of SM objects, because the user displays objects individually (i.e., no temporal constraints are imposed between their retrievals). However, the single-pass class of applications do impose temporal constraints on the display of the identified objects. The focus of our study is on the design of a MM system that can support single pass paradigm applications given the new challenges temporal constraints impose. To illustrate single-pass paradigm applications, consider the following examples:
191

Streaming of Continuous Media for Distance Education Systems
Figure 1. Display and presentation paradigms
Presentation Paradigm
Display Paradigms
|
Single-Pass |
Multi-Pass |
|
|
|
|
|
|
single-Pass static |
multi-Pass static |
|
Static |
c lass of Applications: |
c lass of Applications: |
|
Video-On-Demand |
Most Internet Sites |
||
|
|||
|
Non-Linear Digital Editing |
|
|
|
|
|
|
|
single-Pass dynamic |
multi-Pass dynamic |
|
Dynamic |
c lass of Applications: |
c lass of Applications: |
|
News-On-Demand |
Internet Portals |
||
|
E-Learning |
||
|
|
||
|
Digital Libraries |
|
|
|
|
|
•Customized news-on-demand: A user submits the following query: “Show me today’snews.”Thenextgenerationmultimedia management systems (e.g., multimedia DBMS) would employ user profiles to hone such general query into a more manageable set of video clips that are displayed to the useroneaftertheother(similartoTVnews), with minimum user interaction.
•Customized advertisement: With the explosion of the Internet and the advent of digital broadcasting, marketing agencies want to find new ways of attracting customer’s attention. One such way is to use customized advertisement, where a number of advertisements that pertain to the user’s interest are displayed. One possibility is to feed these advertisements in between the news-on-demand clips or during the advertisement slots of a TV program.
•Digitallibraries&museums:Traditionally, these applications have used the multipass paradigm. However, a number of applications can be built on top of these repositories that use the single-pass paradigm for educational and entertainment purposes. For example, an educator might show the result of the following query to his or her
students as a single presentation: “Show a documentary on the Persian Gulf war for a class of 12-year-old students.”
Thisarticlereportsanongoingresearchproject at Kuwait University. In the second section, we present the general framework of the research project. The third section explains the profile aware retrieval optimizer. Then, in the fourth and fifth sections, we discuss the search space, cost model, and a strategy to search for the best retrieval plan. The sixth section explains the role of memory buffering in alleviating the server bandwidth fragmentation problem. Finally, in the seventh and eighth sections, we present our preliminary findings, conclusions, and future directions.
FRAMEWORK
Withthemultipassdisplayparadigm,duringeach pass, a set of objects (that satisfy the presentation requirements) are identified. Subsequently, the user interactively selects the objects of interest for display(i.e.,theuserpullstheobjects).Toassistthe user, textual and thumbnail information are used to represent different objects. Most Internet sites
192
Streaming of Continuous Media for Distance Education Systems
(e.g.,onlineversionofthe LA Times)areexamples of multipass static class of applications, where a set of objects is specified statically during each pass (e.g., when the user clicks on the Business News link, a prespecified set of news items are presented to the user). On the other hand, the multipass dynamic class of applications dynamically specifies the set of objects to be presented during each pass. A number of Internet portals are striving to accomplish this task effectively (Chen & Shahabi, 2003; Shahabi, Zarkesh, Adibi, & Shah, 1997).
With the single-pass paradigm, a set of temporal relationships (among the set of identified SM objects) governs the display timing of the objects1.Thedisplayoftheobjectsisconsideredto be coherent when all of the temporal relationships are satisfied. Therefore, after the submission of the request, no user interaction is necessary. That is, the system starts the display as soon as it can guarantee that the SM server can display all of the objects in the set to the user with no interruptions, while satisfying the temporal relationships and other user requirements. Examples of single-pass static class of applications are video-on-demand and none-linear digital editing applications. It is important to note that video-on-demand applicationsareaspecialcaseofthisclassofapplications, because they require the retrieval and display of only one SM object per presentation.
On the other hand, it is possible to generate the presentations dynamically according to user requirements. Examples of single-pass dynamic class of presentations include: customized news- on-demand, customized advertisement, and digital libraries and museums. Some of the new Internet applications that use the push paradigm can be considered as a variation of the singlepass paradigm presented above. In the pure push paradigm,theuserdoesnotmakearequest;rather the system keeps broadcasting the information to the user (i.e., data driven)(Shahabi, Dashti, & Ghandeharizadeh, 1998).
FLEXIBILITIES
The single-pass class of applications (whether generated statically or dynamically) can be classified according to the restrictions imposed by the presentation as either: (1) restricted presentation applications (RPA), or (2) flexible presentation applications (FPA). RPA, such as nonlinear editing applications, have a very strict set of temporal relationships that have to be met. This strict timing requirement results in a single retrieval plan, and hence very limited retrieval optimization is possible. However, in FPA, the set of temporal relationships among the objects is not as strict, yieldinganumberofequivalentretrievalplansthat can be used for retrieval optimization purposes.
RPAimposesverystrictdisplayrequirements. This is due to the type of queries imposed by users in such applications. It is usually the case that the users can specify what objects they are interested in and how to display these objects in concert. To illustrate, consider the following environment. During the postproduction of a movie, a sound editor accesses an archive of digitized audio clips to extend the movie with the appropriate sound effects. The editor might choose two clips from the archive: a gunshot and a screaming sound effect. Subsequently, the editor authors a composite object by overlapping these two sound clips and synchronizing them with the different scenes of a movie. Multimedia systems have to guarantee that the SM server can retrieve all the objects in the set and can satisfy the precise time dependencies, as specified by the user. In Chaudhuri, Ghandeharizadeh, and Shahabi (1995) and Shahabi (1996), the scheduling of continuous media retrievals for RPA, and the time dependencies are guaranteed by using memory buffers while in Shahabi et al. (1998), they are guaranteed by using the in-advance knowledge at the time of data placement.
FPA,however,providesomeflexibilitiesinthe presentation of the streaming media objects. It is
193
Streaming of Continuous Media for Distance Education Systems
usually the case that the users do not know exactly what they are looking for and are only interested in displaying the objects with some criteria (e.g., show me today’s news). In this case, depending on the user query, user profile, and session profile, there are a number of flexibilities that can be exploited for retrieval optimization. We have identified the following flexibilities:
•Selection flexibility: Which specifies the possible set of objects that the user might be interested in
•Delay flexibility: Which specifies the amount of delay the user/application can tolerate between the displays of different continuousmediaclips(i.e.,relaxedmeet,after, and before relationships (Allen, 1983)
•Ordering flexibility: Which refers to the display order of the objects (i.e., to what degree the display order of the objects is important to the user)
•Presentation flexibility: Which refers to the degree of flexibility in the presentation length and presentation startup latency
•Display-quality Flexibility: Which specifies the display qualities acceptable by the user/application, when data is available in multiple formats or in hierarchical or layered formats (based on layered compression algorithms (Keeton & Katz, 1995)
To illustrate the flexibilities, assume a news- on-demand application where a user submits the following query: “Show me today’s news.” Due to the generality of the query, it will result in a large number of candidate video clips that would be very cumbersome for the user to view. The user can simplify the browsing by explicit definition of some of its priorities (or flexibilities). For example, in SQL one can use a filter expression to specify the selection criteria and a ranking expression to impose ordering. However, the nextgenerationmultimediamanagementsystems (e.g., multimedia DBMS) would use user profiles
to hone such general queries into more manageable sets of video clips. For example, assume that from the user profile, we know the following about the user: (1) he is interested primarily in business and sports news, (2) he owns a set of stocks, bonds, and money market accounts, (3) he currently lives in the Bay Area, (4) he has family members living the Middle East, (5) he graduated from the University of Southern California (USC), and (6) he is planning to travel to Hong Kong the next day.
Then the system might select sports news that is relevant to the USC football team and USC baseball team and business news relevant to his stock, bonds, and money market portfolio. Moreover, the system might select other news worthy of his attention (e.g., war in Iraq or the weather in Hong Kong). It is clear that a large number of objects might satisfy the user query and that the user might not have time to display all objects; therefore, the system may select or suggest a subset of the objects for display (selection flexibility). The order of the display of these objects may also be flexible (order flexibility). For example, during the sports news session, the user might not care if the highlights of the USC vs. UCLA football game are shown first, or the highlights of the USC vs. Stanford baseball game are shown first (or alternatively the user might care about the order of the display). This can also be extracted from the user profile (e.g., user is a football fan). When displaying the selected video clips, the user might require a minimum delay (e.g., 1 second) between the displays of two objects and might tolerate a maximum delay (e.g., 3 seconds) between the displays of two objects (delay flexibility). The startup latency and the length of the presentation may also be specified bytheuser(presentationflexibility).Forexample, the user might require that the presentation starts no later than 10 seconds after the submission of the request and that the length of the presentation be 4.5 minutes to 5.5 minutes. Finally, depending on the user requirements and the availability of
194

Streaming of Continuous Media for Distance Education Systems
multiple display formats, it is possible to display objects at a lower quality when the system load is high (display-quality flexibility). For example, if the system load is high during the display of the USC vs. Stanford water-polo game, then a lower (i.e., MPEG I) bandwidth might be acceptable by the user.
In RPA, because the presentations are fixed, a single retrieval plan can be imposed on the SM server per presentation. This plan is also independent of the server load. Hence, very limited intrapresentationoptimizationcanbeperformed. In FPA, the flexibilities allow for the construction of multiple retrieval plans per presentation. Subsequently, the best plan is identified as the one which results in minimum contention at the SM server.Toachievethis,threestepsshouldbetaken: Step1:gatheringflexibilities,Step2:capturingthe flexibilities in a formal format, and Step 3: using the flexibilities for optimization. In our system architecture, Figure 2, the Personal Agent carries out the first two steps. This agent builds the user profile either explicitly (i.e., by user interaction) or implicitly (i.e., by monitoring the user actions, as in Shahabi et al. (1997). It also takes as input the user query and the session profile (e.g., type of display monitor) to generate a query script (as output).Thejoboftheintegratorandcollectoristo build the necessary meta-data information for the SM server(s) (whether centralized or distributed), which is used by the agent to generate a query script (as output). This query script would capture all the flexibilities and requirements in a formal manner. The query script is then submitted to the Streaming Media Retrieval Optimizer, which in turn would use it to generate the best (or a good) retrieval plan for the SM server.
In a previous study Shahabi et al. (1998), we defined a query-script for the SM retrieval optimizer. Using the query script, the optimizer definesasearchspacethatconsistsofallthecorrect retrieval plans. A retrieval plan is correct if and only if it is consistent with the defined flexibilities and requirements. The optimizer also defines
Figure 2. System architecture
Query |
Session Info |
Personal Agent |
|
|
Profiler |
Script |
|
Generator |
|
|
|
|
|
Script |
|
Meta-Data |
streaming media |
|
Integrator |
r etrieval |
|
& |
o ptimizer |
|
c ollector |
System |
Display |
Meta-Data |
Load |
Requests |
Info |
Streaming Media Server(s)
a cost model to evaluate the different retrieval plans.Theretrievalplansarethensearched(either exhaustively or by employing heuristics) to find the best plan depending on the metrics defined by the application. Using a simple simulation modelandsimplesearchalgorithms,wewereable to show that the optimizer can improve system performance significantly when the system load is moderate.
In our current research, we are investigating the following. First, we are investigating the theoretical bounds on the size of the search space and the search time. It seems that both problems are NP-Hard. Second, we are investigating the design of efficient algorithms to define the search space and find a good retrieval plan (i.e., search algorithm).Third,weareinvestigatingtheimpact of caching at the user terminal on the system performance. Fourth, we are investigating the design of SM integrators and collector for a distributed
195
Streaming of Continuous Media for Distance Education Systems
environment. Finally, we are investigating the design of a personal agent that can generate good query scripts, based on user query, user profile, and session profile.
Profile Aware Retriivav
Optiiizer (Prime)
The query script received by Prime captures formally the flexibilities and requirements imposed bytheuserquery,userprofile,andsessionprofile.It istheresponsibilityofPrimetodeterminehowthis query script should be imposed against the Continuous Media (CM) server to reduce contention2. This process consists of accepting a query script and then finding the best retrieval plan (among a set of correct retrieval plans) to be scheduled on the CM server. Therefore, the optimizer Prime is concerned with three issues: (1) search space,
(2) cost model, and (3) a strategy to search for the best retrieval plan (Ozsu & Valduriez, 1996). The search space is defined by the query script. The number of correct retrieval plans determines the size of this search space. The cost model is a set of metrics used to evaluate each correct retrieval plan that is being considered. The search strategy explores the search space for the best retrieval plan based on the defined metrics.
The CM server, utilized by Prime, guarantees theuninterrupteddisplayofthecontinuousmedia objects. There have been a number of studies describing the design and implementation of such servers (see Berson et al., 1994; Chen & Little, 1993; Gemmel et al., 1995; Ozden, Rastogi, & Silberschatz, 1996; Rangan & Vin, 1993; Tobagi, Pang, Baird, Gang, 1993). We ignore the detail architecture of the CM server and conceptualize it as a server bandwidth, termed RCM.
In this section, we start by describing the flexibilities and a formal definition for query script. After that, we consider the search space, the cost model,andthesearchstrategies,whileoptimizing for one query script at a time (thus, it is limited to intrapresentation optimization.
Query Script
We are considering four types of flexibilities that might be tolerable by user/application submitting a request: delay, ordering, presentation-time, and display-quality. To capture the delay flexibility, we define a minimum and a maximum tolerable delay between the finishing time of one object
and the start time of the subsequent object (TDelayMin and TDelayMax ). For ordering flexibility, we define
three variations: (1) unordered-object-retrieval (UOR), (2) suggested-object-retrieval (SOR), and (3) ordered-object-retrieval (OOR). To illustrate, consider a query script q that references n continuous media objects, q = {o1, o2,...on}. UOR imposes no ordering constraint on the display of the n objects. SOR suggests an ordering for the n objects; however, this ordering is not restrictive; rather it is given with some confidence. It is expected that a large number of queries imposed on multimediaapplications willbeof this type. OOR requires the display of the n objects in a specific order, and it is necessary to satisfy this ordering. Consider the following three user queries:
•Q1: Display three video clips where President Clinton mentions taxes in his State of the Union speech
•Q2: Display three video clips where President Clinton mentions taxes in his State of theUnionspeech,whileorderingthedisplay of these clips chronologically
•Q3: Display three video clips where President Clinton mentions taxes in his State of theUnionspeech,whileorderingthedisplay of these clips according to their relevance to my taxes
The first query, Q1, is an example of UOR. The users request the display of the video clips but they do not specify any order preference. Therefore, the optimizer may choose one of the n! alternative retrieval plans permutations to find the best possible one. The second query, Q2, is
196
Streaming of Continuous Media for Distance Education Systems
an example of OOR. The user specifies the exact ordering of the display of the objects, and hence the optimizer has only one retrieval plan at its disposalanditcannotsearchthedifferentretrieval plans to improve the system performance. The third query, Q3, is an example of SOR. The user is specifying an order for the display of the objects; however, this order is not strict; rather, it is given with some confidence. This is due to the fact that the ordering is done by qualitative analysis of the video clips and user profile, and it is given with some confidence. The optimizer may search the retrieval plans to improve system performance; however,theconfidenceleveloftheretrievalplans considered has to stay above a threshold given by the query script. We show that UOR and OOR are special cases of SOR.
Tocapturethepresentation-timeflexibility,we define two variables: (1) the presentation length,
TLength, as the total time to display all objects in a request plus the delays between them, and (2)
the presentation start-up latency, TStartup, as the time elapsed from the submission of the request
to the start of the presentation. Furthermore, we define a minimum presentation length, TLengthMin , and a maximum presentation length, TLengthMax , tolerated by the user and the application. We also define a minimum startup latency time, TStartupMin , and a maximum startup latency time, TStartupMax . To capture the display-quality flexibility, we define a function C that returns a set of m acceptable display bandwidths for an object o, (C(o) = {c1(o), c2(o),
...cm(o)}). We assume that this function returns all display formats that are available on the CM server and that are acceptable to the user.
The three ordering variations we are considering (UOR, SOR, and OOR), require the retrieval of n objects with the constraints that:
•Delay-flexibility: Delay, ∆, between the finishing time of an object and the starting time of the subsequent object is bounded by
Min |
Max |
(TDelayMin ≤ ∆ ≤ TDelayMax ) |
TDelay and TDelay |
||
•Presentation-flexibility: Presentation
length,TLength,isboundedbyTLengthMin andTLengthMax ( TLengthMin ≤ TLength≤ TLengthMax ), startup latency, TStartup ,
is bounded by TStartupMin and TStartupMax (TS tMina r t - ≤ TStartup ≤ TStartupMax )
•Display-quality: For all objects in the request, there are enough system resources to satisfy one of the bandwidths requirements (c,c,...,cm) returned by C
Using Table 1 as a reference, consider the following definition for a query script:
•Definition 1: A query script q submitted to the optimizer (Prime) consists of the following parameters:
○n objects oj O (O is the set of all continuous media objects available on the CM server) for j: ≤ j ≤ N, where N =
○ |
|O|. |
& TDelay as the maximum and |
TDelay |
||
|
Max |
Min |
minimum tolerable delay between the finishing time of oj and the starting
j+1.
○Confidence level threshold ø, 0 ≤ ø ≤ 1 (minimum acceptable confidence in the object ordering).
○Function α(oj, i, j: 1 ≤i,j≤n), where 0
≤α(oj,i) ≤ 1 , (confidence in displaying object oj in the ith position).
○TLengthMax & TLengthMin as the maximum and
minimum tolerable presentation lengths.
○TStartupMax & TStartupMin as the maximum and
minimum tolerable startup latency.
○Function C(oj)={ck(oj)| j, k:1 ≤ j ≤ n and1 ≤ k ≤ m, 0 < ck(oj) ≤ 1}, where j: 1 ≤ j ≤ n, C(oj) ≠ j.time of o
197

Streaming of Continuous Media for Distance Education Systems
Table 1. Terms used repeatedly in the article and their corresponding definitions
Term |
Definition |
|
|
|
|
oj |
A continuous media object identifier; no ordering is associated with the subscript. |
|
l(oj) |
The length of the object oj .The unit is in time intervals. |
|
C(oj) |
A function that returns the set of m acceptable consumption rates for object oj , |
|
({c1(oj),c2(oj), ..., cm(oj)}). This rate is normalized by the CM server bandwidth RCM , |
||
|
i, k :1 ≤ j ≤ n, 1 ≤ k ≤ m, 0 <ck(oj) ≤ 1. |
|
MinBand(oj) |
A function that returns the minimum bandwidth requirement for object oj |
|
(i.e., the minimum value returned by C(oj)). |
||
|
||
s(oj) |
Object oj start time. It is the time at which the display of oj starts. |
|
f(oj) |
Object oj finish time. It is the time at which the display of the object oj finishes, |
|
f(oj)= s(oj)+ l(oj). |
||
|
||
Band(k) |
Available bandwidth at time interval k, 0 ≤ Band(k) ≤ 1 (normalized by the |
|
CM server bandwidth, RCM ) |
||
|
||
|
|
|
α(oj ,i) |
A function that returns the confidence value of displaying object oj in the ith position. |
|
q |
A query-script, q, is a formal definition of the user, system, and application flex- |
|
ibilities |
||
|
and requirements. This is the input to Prime. |
|
|
|
|
r(q) |
A query script release time. It is the time at which the query script is released |
|
to the optimizer. |
||
|
||
|
|
|
p |
A retrieval-plan, p, consists of tuples < oj ,i >, i, j :1 ≤ i, j ≤ n,where oj is one of the |
|
n objects to be displayed from the query-script, and i is one of the n possible posi- |
||
|
tions. |
|
|
|
|
β(p) |
The confidence level of the retrieval plan p, β(p)=∑in=−11a(oj, Pos(oj,p))/n |
|
s(p) |
Retrieval plan p start time. It is the time at which the first object of the retrieval plan |
|
is displayed, s(p)= s(oj)where Pos(oj ,p)=1. |
||
|
||
Pos(oj ,p) |
A function that returns the position of object oj in the retrieval plan p. |
|
f(p) |
Retrieval plan p finish time. It is the time interval at which the last object of the |
|
retrieval plan finishes its display, f(p)= f(oj)where Pos(oj,p)= n. |
||
|
||
σ(p) |
Retrieval schedule, σ, of retrieval plan p. It consists of n triplets: < oj ,i,s(oj ) >, |
|
where oj is the object being displayed, i is the position of the object in the plan, |
||
|
and s(oj) is the start time of object oj . |
|
TResponse |
The time elapsed from the release time of the query script r(q) to the finish time |
|
of the plan f(p), TResponse(p)= f(p) − r(q). |
||
|
||
TLatency |
The time elapsed from the release time of the query script r(q) to the start time of |
|
the retrieval plan s(p), TLatency (p)= s(p) − r(q). |
||
|
||
∆Avg (p) |
The average delay between the finish time of an object and the start time of the |
|
subsequent |
||
|
object, ∆Avg ( p) = ∑in=−11 ∆(i,i+1) ( p) n −1. |
|
∆Var(p) |
The delay variance, ∆Var ( p) = ∑in=−11 (∆(i,i+1) ( p) − ∆Avg ( p))2 n −1. |
|
∆(i,i+1)(p) |
Delay between the completion time of object or at position i, and starting time of |
|
object os at position i +1, i :1 ≤ i ≤ (n − 1). |
||
|
198
Streaming of Continuous Media for Distance Education Systems
Search Space |
The above query script and retrieval plan defi- |
||
|
|
|
nitions capture all three variants of the ordering |
The number of I/O’s to retrieve streaming media |
flexibilities. It naturally captures SOR, because |
||
objects from the SM server is fixed. However, dif- |
the query script definition allows the optimizer |
||
ferentretrievalplansinfluenceretrievalcontention |
to consider the different retrieval plans as long as |
||
at the server. Hence, it is vital to find a retrieval |
their confidence level β(p) is above the confidence |
||
plan such that it minimizes contention at the SM |
threshold Φ. To capture UOR, it is important to |
||
server, in order to improve system performance. |
generate all the n! possible retrieval plans. To |
||
The query script captures the flexibilities and |
achieve this, the value of β(p) has to be independent |
||
requirements imposed by the user query, user |
of the ordering, constant for all permutations, and |
||
profile, and session profile. It is then necessary |
always greater than the threshold Φ. This can be |
||
to determine how this query script should be |
accomplished by setting Φ =0 and fixing α (oj, i) ≥ |
||
imposed against the SM server to reduce con- |
0 for all i and j. This setup would allow all possible |
||
tention. This process consists of: (1) accepting |
retrieval plans. In case of OOR, it is important to |
||
a query script that defines our search space, (2) |
allow only one retrieval plan. This can be accom- |
||
finding the correct retrieval plans that satisfy our |
plished by setting the threshold to the highest value |
||
query requirements, and (3) applying a strategy |
, Φ =1, and making the confidence evaluator α (oj, i) |
||
to search for the best retrieval plan (among a set |
return 1 when the object is being displayed at the |
||
of correct retrieval plans) to be scheduled on the |
correctorderand0otherwise.Therefore,acorrect |
||
SM server. |
query script setup would result in capturing the |
||
|
A retrieval plan p, whether correct or not, |
appropriatequeryvariation.Asdefinedabove,the |
|
consists of n tuples < o , i > (i, j: 1 ≤ i, j ≤ n), |
search space consists of all the correct retrieval |
||
where o |
is one of the nj objects to be displayed |
plans. However, in general, finding the complete |
|
from thej query script and i is one of the n possible |
search space seems to be an intractable problem. |
||
positions. The search space consists of all of the |
We show that this problem is actually NP-hard by |
||
correct retrieval plans, where the correctness of a |
reducing our problem to the bin-packing problem |
||
retrieval plan depends on the display order being |
(Garey, Graham, Johnson, & Yao, 1976) and cut- |
||
considered with the given confidence threshold. |
ting-stock problem (Garey & Johnson, 1979). |
||
• |
Definition: A retrieval plan p consists of |
Search Complexity |
|
|
n tuples < oj , i > (i, j: 1 ≤ i, j ≤ n). This |
For many important practical or theoretical prob- |
|
|
retrieval plan is said to be correct if and only |
||
|
if: |
|
lems, the objective is to choose a “best” solution |
|
|
|
out of a large number of candidate solutions or |
|
○ |
i, j: 1 ≤ j ≤ n, 1 ≤ Pos(oj, p) ≤ n (all |
the solution space. Such problems are typically |
|
|
of the objects in the query script q are |
knownascombinatorialoptimizationproblems.A |
|
|
considered in the retrieval plan p). |
combinatorialoptimizationproblemisformalized |
○i, j: 1 ≤ i, j ≤ n if i ≠ j then Pos(oj, p) as a pair (S,w), where S is finite or a countable ≠ Pos(oj, p) (two objects do not occupy infinite set of configurations (or search space) the same position). and w is a cost function, w:S→ , which assigns
○ |
β(p)= α(oj, Pos(oj, p))/ n ≥ Φ (the average |
a real number to each configuration. For conve- |
|
confidence level of the retrieval plan |
nience, it is assumed that w is defined such that |
|
is above the given threshold). |
the lower the value of w, the better (with respect |
|
|
to the optimization criteria) the corresponding |
199
Streaming of Continuous Media for Distance Education Systems
configuration. The problem now is to find a configuration for which w takes its minimum value, that is, an (optimal) configuration io satis-
fying wopt= w(io) = mini Sw(i) where wopt denotes the optimum (minimum) cost. In our work, the
search space S consists of all the correct retrieval plans, where the correctness of a retrieval plan depends on the display order being considered with the given confidence threshold, and the cost function w tries to optimize for the response time
(Tresponse) and the latency time (TLatency). The objective of Prime is to find the best retrieval plan in
the search space, where best is dependent on the metrics used. In the next two subsections, we will show that finding the complete search space is an intractable problem (NP–hard) by reducing our problem to the bin-packing problem (Garey et al., 1976) and cutting-stock problem (Garey & Johnson, 1979).
Bin Packing
The bin packing problem (BPP) can be described as follows: Given a set of n “items” with integer size x1, ..., xn, and a supply of identical “containers” of capacity C, decide how many containers are necessary to pack all the items. This task is one of the classical problems of combinatorial optimization and is NP-hard in the strong sense (Coffmann, Garey, & Johnson, 1997; Garey & Johnson, 1979). One approach to deal with NP- hard problems is to develop approximation algorithms.Thesearepolynomialtimealgorithmsthat have some (worst-case) performance guarantee compared to the optimum solution. Even though there are many excellent theoretical results, includingpolynomialapproximationschemes,there is still a lack of methods that are able to solve practical instances optimally. A generalization of bin packing problem is multidimensional bin packing, called box packing. While box packing is a natural step from bin packing, the problem seems to be more difficult, and the number of results is smaller.
•Problem definition: Let d ≥ 1 be an integer. In the d-dimensional box-packing problem,
we are given a finite set O ={o1, o2,...,oN} of “items.” Each item o has a fixed size, which
is s1(o) ×... × sd(o), where si(o) is the size of o in the ith dimension. We have an infinite number of bins, each of which is a d-dimen- sional unit hyper-cube. Each piece must be
assigned to a bin and a position (x1(o) ×... × xd(o)), where 0 ≤ xi(o) and xi(0) + si(o) ≤ 1 for 1 ≤ i ≤ d. Further, the positions must be assigned in such a way that no two items in the same bin overlap. A bin is empty if no piece is assigned to it; otherwise it is used. The goal is to minimize the number of bins used. Note that for d =1, the bin-packing problem reduces to exactly the classic binpacking problem.
Ouroptimizationproblemcanbereducedtothe two-dimensional bin packing problems. In twodimensional problems, given a set of items and
aset of bins whose shapes are two-dimensional, you are asked to lay out items inside bins in such
away that the number of used bins is minimized and the yield (area of item over area of bounding rectangles of layouts) is maximized. In our case, each media object can be considered as a 2D item (rectangle) and the bins are discrete time intervals over the system bandwidth. Problems of this type are obviously harder than one-dimensional bin packing, and thus NP -hard (Chung, Garey, & Johnson, 1982; Coffmann et al., 1997; Garey & Johnson, 1979).
Cutting Stock
One common combinatorial optimization problem that arises frequently in applications is the problem of allocating rectangular or irregular shapes onto a large stock sheet of finite dimensions in such a way that the resulting scrap will be minimized.Thisproblemiscommontonumerous real-world applications from computer science,
200
Streaming of Continuous Media for Distance Education Systems
industrial engineering, logistics, manufacturing, management,productionprocess,aerospace,ship building, VLSI design, steel construction, shoe manufacturing, clothing, furniture, and so forth. This problem is commonly known as the cutting stock problem.
In the two-dimensional free-form (irregular shapes) bin packing (2D-FBP) problem, which is also called the free-form cutting stock, cutting and packing, or nesting problem, given a set of 2D free-form items, which in practice may be plate parts, and a set of 2D free-form bins, which in practice may be plate materials from which parts are to be cut, you are asked to lay out items inside one or more bins in such a way that the number of bins used is minimized and the yield (area of items over area of bounding rectangles of layouts) is maximized. Algorithms for the problem generally consist of procedures for approximating input bins and items, and for placing items into bins (Daniels & Milenkovic, 1996; Milenkovic, 1998).
Another variant of the cutting stock problem is rectangle layout, in which the essential task is to place a given set of rectangles, or pieces, in a given larger rectangular area or, stock sheet, so that the wasted space in the resulting layout is minimizedsubjecttothelayoutbeingfeasible.We call a placement feasible if there are no overlapping pieces in the layout, and the items must stay withintheconfinesofthelargershape.Additional constraints can be such as a requirement on the minimum or maximum number of a particular piece that should appear or, that the pieces be recoverable from the stock sheet by making full length, or guillotine, cuts across the piece. This latterrequirementisimportantforindustriessuch as glass cutting where partial cuts across a stock sheet are either forbidden or are prohibitively expensive. Because the 2D-FBP problems belong to the class of NP-hard combinatorial optimization problems, which means that there is no hope of findingpolynomial-timeexactalgorithmsunlessP
=NP,approximationalgorithmsplayanimportant role in practical applications.
The cutting stock problem is an example of a large-scale optimization problem. It is unlikely to be solved by an algorithm whose run time is bounded by a polynomial function. This is an example of NP – hard problems (Garey & Johnson, 1979). This means that this problem requires a computingeffortthatincreasesexponentiallywith the problem size. Because the cutting stock problem is of practical importance, therefore, a large variety of solution-methods, exact and approximate, have been devised. Efficient approximation algorithms,namely,algorithmsthatdonotproduce optimalbutratherclose-to-optimalsolutions,have been developed. These include linear and integer programming (Dyckhoff, 1981; Haessler, 1980), dynamic programming (Beasly, 1985a; Sarker, 1988), tree-search algorithms (Beasly, 1985a; Hinxman, 1980), genetic algorithms (Burke & Kendall, 1999), and simulated annealing (Lutifiyya & McMillin, 1991; Sechen & Vincenelli, 1986). These proposed approaches have restrictions on the size and type of applications.
There are two different types of the two-di- mensionalcuttingstockproblems:theconstrained andtheunconstrainedproblems.Theconstrained two-dimensional cutting stock problem (CTDC) appliesorthogonalguillotinecutsandisnotoffreeform type. The unconstrained two-dimensional cutting has been solved optimally by dynamic programming (Beasly, 1985b) and by the use of recursive (tree search) procedures (Hifi, & Zissimopoulos,1996).Veryinterestingsequentialexact andapproximatealgorithmshavebeendeveloped for guillotine CTDC. Two exact approaches are called the top-down approach (Christofides & Whitlock, 1977; Hifi, 1994), a depth-first search method, and the bottom-up approach (Hifi, 1997; Viswanathan & Bagchi, 1993),a best-first search method. The CTDC version has been solved optimally by applying a general tree search based upon a depth-first search method (Hifi, 1994) and
201
Streaming of Continuous Media for Distance Education Systems
also by the use of branch-and-bound procedure baseduponabest-firstsearchmethod(Hifi,1997). Previous works have also developed heuristic approaches to the unconstrained and constrained ones (Fayard, Hifi, & Zissimopoulos, 1996).
We study in our work one of the most interesting problems of cutting stock, the Constrained Two-DimensionalCuttingstockproblem(CTDC), which applies orthogonal guillotine cuts and not free-form. In CTDC, we assume that our time vs. bandwidthgraphrepresentsalargestockrectangle S of given dimensions L×W and our media objects are represented as n items of smaller rectangles (pieces) where the ith item has dimensions li×wi. Furthermore, each item i, i = 1,..., n, is associated with a cost ci. The problem now is to cut off from the large rectangle a set of small rectangles such that: (i) all pieces have fixed orientation, that is, a piece of length l and width w is different from a piece of length w and width l (when l ≠ w), (ii) all applied cuts are of guillotinetype, thatis, cuts that start from one edge and run parallel to the other two edges; and (iii) the overall profit obtained by cixi, where xi denotes the number of rectangles of type i in the cutting pattern, is maximized.
Search Strategy
We have proven that finding the complete search space is an intractable problem (NP-hard) by reducing it to the bin-packing and cutting-stock problems. Even though the problem is NP-hard, it is possible to do exhaustive search when there are a small number of objects being referenced. However, when the number of referenced objects is large, alternative search strategies have to be employed, such as: heuristic search strategies, or randomized search strategy.
In this section, we propose employing heuristics to find a subset of the search space by pruning all permutations that do not seem promising. Those heuristics depend on some metrics such as the confidence level of the retrieval plans. In
this case, only the retrieval plans with an average confidence level (β(p)) above a threshold (Φ) given by the query script are investigated.
Thefirstheuristic(Heuristic1)appliesagreedy strategy that strives to generate a retrieval plan with the highest average confidence level (β(p)) by schedulingtheobjectswiththehighestconfidence values α (oj , Pos(oj, p)) at each position (Pos(oj, p)). It starts first by sorting the objects at each position by their confidence level (α (oj , Pos(oj, p))). Second, it tries to schedule the objects with the highest confidence values at each position. If thesameobjectappearsatmorethanoneposition, it schedules the one with the highest confidence value and replaces the object at the other position with the next object (in the sorted list of objects) in its position. The algorithm terminates when it schedules different objects at all the positions in p (see Algorithm A in Appendix).
Because the object picked next by Heuristic1 is always the one with the highest confidence value that can be legally scheduled, the object picked is thusa“greedy”choiceinthesensethat,intuitively, it maximizes α (oj , Pos(oj, p)). That is, the greedy choice is the one that maximizes β(p).
To generate more retrieval plans a second heuristic (Heuristic2) can be applied. With this heuristic, instead of scheduling the objects with the highest confidence level at each position of plan p (as in Heuristic1), we force the scheduling of an object (oj) with a specific confidence value at a specific position (α (oj ,i)). Then, to generate a new scheduling plan with the same or a lower averageconfidencevalue,weforcethescheduling of an object with a lower confidence value than oj at the same position i (see Algorithm B in Appendix). With the new heuristic, an additional n retrieval plans can be generated at level l with the same or lower confidence value as the n retrieval plans of level l-1. To generate the n retrieval plans at level l we have to apply Heuristic1 n times. When we apply Heuristic1 for the ith time (i : 1 ≤ i ≤ n) we fix the display of the lth object in the sorted list of objects at position i (even if it has
202
Streaming of Continuous Media for Distance Education Systems
a higher confidence to be displayed at another position), and schedule different objects at the other positions (see Algorithm B). Hence, we reduce the total confidence value of the generated retrieval plan.
The worst-case execution time of the while loop in Algorithm A is O(n2); because in the worst case, we process all the elements in matrix SOPC [n,n] (of size n2). Hence, the running time of Algorithm A is dominated by the sorting time of the n columns of OPC matrix to generate matrix SOPC. It takes O(n logn) to sort each column, and because we have n columns, then the total sorting time is O(n2 logn). Therefore, the total running time of Algorithm A is O(n2 logn).
Note that we can further enhance our algorithms by applying some modifications. For example, in Algorithm A and Algorithm B, instead of randomly extracting an element from S that representsapositionpos,wecandothefollowing:
(1)sort the positions in ascending order according to the confidence values of the objects with the highest confidence value at each position (i.e., sort the objects in first row of matrix SOPC),
(2)pick the position that has the object with the highest confidence value as pos. More retrieval plans can also be generated by a simple extension/modificationofAlgorithmB.Insteadoffixing the scheduling of only one object at a time, we can fix m objects at a time, for 1 ≤ m ≤ n. Hence, we pass three parameters to Algorithm B instead of two. Furthermore, instead of terminating the execution of Algorithm A and Algorithm B when
S is empty (i.e., scheduled different objects at all the positions), we can stop the execution when-
ever β(p)=α (oj , Pos(oj, p))/n ≥ Φ if k < n (i.e., S is not empty). In this case, we can randomly pick
objects to be scheduled at the rest of the position S, as long as they generate a correct plan.
Sometimes when the number of all permutations of the objects being referenced n! is smaller than or equal to some threshold3 N, then the system may choose the exhaustive search. The exhaustive search examines all possible retrieval
plan permutations n! to find the best correct retrieval plan. Therefore, the complexity of the general exhaustive search in worst case is O(n!
× TSchedule). On the other hand, if the number of objects n! is greater than the threshold N, then all
permutations cannot be exhaustively searched in a reasonable time. Therefore, Heuristic1, or Heuristic2 described in this section may be used to find a partial search space. If the cardinality
of the resulting partial search space|Spartial| is smaller than or equal to N, then the system may
exhaustively search the partial search space in a reasonable time. The complexity of exhaustively searching the partial search space is O(n2 × logn
+ |Spartial| × TSchedule).
Besides heuristics, a randomized search strategycanalsobeconsidered.Therandomizedsearch strategy selects K arbitrary retrieval plans from the partial search space, and then exhaustively searches them to find the best retrieval plan. The run time of such a randomized search strategy is O(n2 × logn + (K × TSchedule)).
Role of Memory in Retriivav
Optiiization
When the server load is moderate to high, it is difficult to find time slots (i.e., a rectangle) that can satisfy the display requirements of the objects for their entire duration. This is due to the fact that: (1) the available server bandwidth is less than the display requirements of the objects (i.e., not enough height), and (2) there might be time slots that satisfy the display requirement of the objects; however, the length of these time slots is shorter than the length of the objects (i.e., not enough length). We refer to this problem as the server bandwidth fragmentation problem, and it
leads to larger TResponse and TLatency.
Memorybufferingcanplayaroleinalleviating theserverbandwidthfragmentationproblembyallowingtheemulationofhigherserverbandwidths when necessary. There are two ways of applying
203
Streaming of Continuous Media for Distance Education Systems
memory buffering: (1) Simple Memory Buffering Mechanism (SimB), and (2) Variable Rate MemoryBufferingMechanism(VarB).TheSimB mechanism treats the system load on the server as a discrete function over time. Either there is enough bandwidth to satisfy the minimum bandwidth requirement of the object being scheduled, orthere is not enough bandwidth. Theobjective of SimB is to mend two or more time slots such that a larger time slot can be emulated. Hence, when a singletimeslotcannotaccommodatetheretrieval of an object, it is possible to apply SimB repeatedly so that two or more time slots are mended to accommodate the display of a single object. The other memory buffering mechanism, VarB, takes a more general approach. Its objective is to use the variable server bandwidth with memory to emulate a constant bandwidth for the display of the objects. Therefore, it treats the system load as a continuous function over time, and it uses concepts similar to the pipelining concept presented in Ghandeharizadeh et al. (1995). In this article, we present SimB mechanism as a simple way to use the available memory at the client side (or at the server side) to reduce the delays and improve system performance.
To illustrate the SimB mechanism, assume a system is loaded such that there are two time slots of length 30 seconds starting at times t = 0 and t = 40 seconds (Figure 3). Moreover, assume that these time slots can satisfy the bandwidth requirements of object ox, which is 60 seconds in
Figure 3. Object retrieval and display
length. Without memory buffering, it is obvious that ox cannot be scheduled using the two time slots. However, using the SimB mechanism, it is possible to mend the two 30-second time slots suchthatalonger60-secondtimeslotisemulated. That is, starting the retrieval of half of object ox in the first time slot, and the retrieval of the second half of the object in the second time slot (Figure 3). To ensure the uninterrupted display of ox, it is necessary to have 10 seconds of the ox prefetched into the memory prior to the start of its display (Figure 3 and Figure 4). The amount of memory required to mend any two time slots is dependent on the bandwidth requirement of the object (c(ox)) and the length of the gap being
mended (TGap): MemBuff(SimB) = c(ox) × TGap / 8 × Rcm Mbytes. Therefore, if c(ox) = 0.01, Rcm= 1000
Mbps, and TGap =10 seconds, then MemBuff(SimB) =12.5 Mbytes. Note that SimB is only applicable
iftheresultinglatencytimeistolerablebytheuser (i.e., consistent with presentation flexibility).
SimB is a simple mechanism that can be used in mending two time slots into a longer time slot; however, in the general case, it is necessary to applythismechanismrepeatedlysuchthattheobject fitsintheemulatedtimeslot.Itistheresponsibility of the scheduler to apply this mechanism when necessary to improve system performance. The scheduler looks at the server load, a retrieval plan, and the maximum available memory as inputs. Subsequently,itproducesaretrievalschedulesuch
|
|
|
|
|
|
|
|
|
|
|
|
Ox |
|
|
|
|
|
|
|
|
Display |
||
Bandwidth |
|
|
|
|
|
|
|
|
|
|
|
|
|
|
|
|
|
|
|
||||
|
|
|
|
|
|
|
|
|
|
|
|
|
|
|
|
|
|
|
|
|
|||
1.0 |
|
|
|
|
|
|
|
|
|
|
|
|
|
|
|
|
|
|
|
|
|
Retrieval |
|
|
|
|
|
|
|
|
|
|
|
|
|
|
|
|
|
|
|
|
|
|
|||
|
|
|
|
|
|
|
|
|
|
|
|
|
|
|
|
|
|
|
|
|
|||
|
|
|
|
|
|
|
|
|
|
|
|
|
|
|
|
|
|
|
|
|
|
||
0.5 |
|
|
0.5 |
Ox |
|
|
|
|
0.5 |
Ox |
|
||||||||||||
|
|
|
|
|
|
|
|
|
|
|
|
|
|
|
|
|
|
|
|
|
|
time |
|
|
|
|
|
|
|
|
|
|
|
|
|
|
|
|
|
|
|
|
|
|
|
||
|
|
|
|
|
|
|
|
|
|
|
|
|
|
|
|
|
|
|
|
|
|
|
|
0 |
10 |
20 |
30 |
40 |
50 |
60 |
70 |
|
|||||||||||||||
204

Streaming of Continuous Media for Distance Education Systems
Figure 4. Memory requirements when using SimB
MemBuff (Mbytes)
12.5 
6.25
 time
time
0 |
10 |
20 |
30 |
40 |
50 |
60 |
70 |
thatthequeryscriptflexibilitiesandthemaximum memory requirements are not violated.
Performance EvaEvation
In this section, we report on the results of our experiments on Best Retrieval Plan (plan with the highest confidence) with three different planning techniques, Just In Time, Compact, and Before Time:
•Just in time (JIT): Each request in the script is scheduled to be shown at the minimum required time (i.e., the first request is scheduled to be shown after adding the minimum latency time required by the user to thearrivaltimeofthe script,whiletherest of the requests are scheduled to be shown after adding minimum delay to the ending shown time of its previous request).
•Compact: Each request in the script is scheduled to be shown at the arrival time withoutaddinganytime(i.e.,thefirstrequest is scheduled to be shown after adding the minimum latency time required by the user to thearrivaltimeofthe script,whiletherest of the requests are scheduled at the ending shown time of its previous request).
•Before time: This technique is the same as Compact where each request in the script is scheduled to be shown before the required time by a specific time (minimum or
maximum delay time) (i.e., the first request is scheduled to be shown after adding the minimum latency time required by the user to the arrival time of the script, while the rest of the requests are scheduled before the ending shown time of its previous request (by minimum or maximum delay time)).
The percentage of missed requirements (flexibilities)willbeconsideredasperformancemetric. We implemented a simulation model to test the performance of the system when different planning techniques are considered with different system utilization.
Simulation Model
For the purposes of this evaluation, we assumed a streaming media server with a constant transfer rate.AlltheobjectsinthemediaserverareMPEG- 2 video clips with 6 Mbps bandwidth requirement and the size of objects is random and varies from 10 seconds to 6 minutes. We have three different users with different ranges of flexibilities: Relaxed, Moderate, and Busy. Each of the users has a different set of values for their flexibilities parameters such as: Minimum latency, Maximum latency, Minimum delay, Maximum delay, Minimumpresentationlength,MaximumPresentation length, and Confidence. We employed a Poisson distribution for script arrivals to generate variable load on the server depending on the target utilization where we want to test the performance
205
Streaming of Continuous Media for Distance Education Systems
of our system in order to find the best technique to be used by the optimizer. For each script size, we generated 10000 scripts normally distributed among the three users and with random objects size. The simulation model was implemented in C language a Pentium 4 PC.
Experimental Results
Table 2 and Table 3 show the performance results using the three different planning techniques (i.e., Just In Time, Compact, and Before Time), and using a simple scheduling technique with a target system utilization of 98%. Table 2 shows the results when the system is without buffering, while Table 3 shows the results when the system has a buffer.
We can conclude the following from Table 2 and Table 3:
•Percentageofminimumstartuptimemissed deadlines: By the definition, the minimum
startup time cannot be missed in the three scheduling techniques where the first object of the scripts is always scheduled to meet this requirement.
•Percentageofmaximumstartupmissedtime deadlines: Because of the high utilization of the system, most of the scripts miss the maximum startup time required in the three scheduling techniques.
•Percentage of minimum delay missed deadlines: Because most of the scripts missed the maximumstartuptime(andmaximumdelay time) this leads to some requests missing the minimum delay (i.e., if we have a script with three objects to be retrieved from the SM, andtheOptimizerchoosesandschedulesthe plan. If the first object misses the maximum startup, then there will be a high probability that the next request misses the minimum delay time. And the same happens if the second request misses the maximum delay (there will be a high probability that the
Table 2. Performance of JIT, Compact, Before planning techniques using simple scheduling technique with 98% utilization and without buffering.
|
Average |
|
|
Missed Deadlines |
|
|
|
Required |
|||
Planning |
Actual |
|
|
|
|
|
|
|
|
||
Min |
Max |
Min |
Max |
Min |
Max |
|
|
Buffer |
|||
Technique |
Utiliza- |
total |
Script |
||||||||
(Mbit) |
|||||||||||
|
tion |
Startup |
Startup |
delay |
delay |
Pres. |
Pres. |
|
|
||
JIT |
97.16 |
0.00 |
0.95 |
0.34 |
0.61 |
0.05 |
0.11 |
0.43 |
1.00 |
17000 |
|
|
|
|
|
|
|
|
|
|
|
|
|
Compact |
97.28 |
0.00 |
0.95 |
0.45 |
0.51 |
0.09 |
0.07 |
0.44 |
1.00 |
24656 |
|
|
|
|
|
|
|
|
|
|
|
|
|
Before |
97.31 |
0.00 |
0.95 |
0.60 |
0.36 |
0.16 |
0.03 |
0.44 |
1.00 |
34684 |
|
Table 3. Performance of JIT, Compact, Before planning techniques using simple scheduling technique with 98% utilization and with buffering.
|
Average |
|
|
Missed Deadlines |
|
|
|
Required |
|||
Planning |
Actual |
|
|
|
|
|
|
|
|
||
Min |
Max |
Min |
Max |
Min |
Max |
|
|
Buffer |
|||
Technique |
Utiliza- |
total |
Script |
||||||||
(Mbit) |
|||||||||||
|
tion |
Startup |
Startup |
delay |
delay |
Pres. |
Pres. |
|
|
||
JIT |
97.16 |
0.00 |
0.95 |
- |
0.61 |
- |
0.11 |
0.29 |
65 |
- |
|
|
|
|
|
|
|
|
|
|
|
|
|
Compact |
97.28 |
0.00 |
0.95 |
- |
0.51 |
- |
0.07 |
0.22 |
55 |
- |
|
|
|
|
|
|
|
|
|
|
|
|
|
Before |
97.31 |
0.00 |
0.95 |
- |
0.36 |
- |
0.03 |
0.14 |
42 |
- |
|
|
|
|
|
|
|
|
|
|
|
|
|
206

Streaming of Continuous Media for Distance Education Systems
third request misses the minimum delay)).
•Percentage of maximum delay missed deadlines: Because of the high utilization of the system there are some misses in the maximum delay time required in the three scheduling techniques.
•Percentage of minimum presentation time missed deadlines: We have this percentage of missing minimum presentation time requirement because of the missing minimum delays.
•Percentage of maximum presentation time missed deadlines: We have this percentage of missing minimum presentation time requirement because of the missing minimum delays.
•Percentageoftotalmisseddeadlines:Thisis the percentage of the total missing requirement (minimum and maximum startup, delay, and presentation).
•Percentage of scripts has at least one missed deadline: All the scripts that have at least one missed deadline.
While the three different planning techniques have the same average actual utilization (close
to the targeted system utilization of 98%), they differ in the percentages of missed deadlines. JIT planning technique has the lowest minimum delay missed deadlines, while Before time planning suffers the most from missed deadlines because of missing minimum delay requirement. However, the opposite is true when it comes to missing maximum delay requirement. Before time is the best planning technique, while JIT is the worst. With buffering, we implement a buffer within the system; therefore, we remove the missing deadlines in minimum delay and minimum presentation (see the results in Table 3).
In Figure 5 and Figure 6, we show the required buffer size and system utilization as the system processedintimeandreceivesmorejobstoschedule. If we ignore the two areas that are required to warm-upandtocool-downthesystem,wecansee from Figure 5 that the required buffer fluctuates and has a maximum size of 2000 Mbits. This is due to the fact that as new jobs are required to be scheduled, old jobs finish processing. Figure 6 shows that the system was almost always fully utilized as projected.
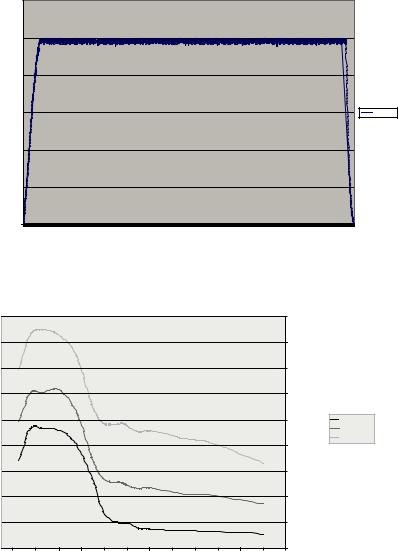
InFigure7,wecomparethebuffersizerequired for the three different planning techniques as a
Figure 5. Buffer size vs. time period (simple scheduling with 98% target utilization)
|
|
|
|
|
buffer size Vs t ime Period |
|
0000 |
|
|
|
|
|
0000 |
|
|
|
|
|
00000 |
|
|
|
|
size mbit |
0000 |
|
|
|
|
|
|
|
|
Series |
|
buffer |
0000 |
|
|
|
|
|
|
|
|
|
|
|
0000 |
|
|
|
|
|
0000 |
|
|
|
|
|
0 |
|
|
|
|
|
|
|
|
|
0 0 0 0 0 |
|
|
|
|
|
t ime Period |
207
Streaming of Continuous Media for Distance Education Systems
Figure 6. System utilization vs. time period (simple scheduling with 98% target)
|
|
|
|
|
system utilization Vs t ime Period |
|
. 0E+0 |
|
|
|
|
|
.00E+0 |
|
|
|
|
|
.00E+0 |
|
|
|
|
utilization |
.00E+0 |
|
|
|
Series |
system |
|
|
|
|
|
|
.00E+0 |
|
|
|
|
|
.00E+0 |
|
|
|
|
|
0.00E+00 |
|
|
|
|
|
|
|
|
|
0 0 0 0 |
|
|
|
|
|
t ime Period |
Figure 7. Buffer size vs. utilization (simple scheduling with 98% target utilization)
|
|
|
|
buffer size Vs utilizatio n |
|
|
|
000 |
|
||||
|
|
|
|
|
|
|
|
|
|
|
|
|
|
|
|
|
|
|
|
|
|
|
|
|
|
0000 |
|
|
|
|
|
|
|
|
|
|
|
|
|
000 |
|
|
|
|
|
|
|
|
|
|
|
|
|
0000 |
|
|
|
|
|
|
|
|
|
|
|
|
|
000 |
Before Time |
|
|
|
|
|
|
|
|
|
|
|
|
buffer |
Compact |
|
|
|
|
|
|
|
|
|
|
|
|
size |
Just In Time |
|
|
|
|
|
|
|
|
|
|
|
|
0000 |
|
|
|
|
|
|
|
|
|
|
|
|
|
|
|
|
|
|
|
|
|
|
|
|
|
|
|
000 |
|
|
|
|
|
|
|
|
|
|
|
|
|
0000 |
|
|
|
|
|
|
|
|
|
|
|
|
|
000 |
|
|
|
|
|
|
|
|
|
|
|
|
|
0 |
|
|
|
|
|
0 |
|
|
0 |
|
|
|
|
0 |
|
|
|
|
|
|
|
utilization |
|
|
|
|
|
|
|
function of the required system utilization. If we ignore the two areas that are required to warm up and to cool down the system, in general, the three different planning techniques behave exactly the same.Astherequiredsystemutilizationincreases, the required buffer size increases. However, for the same system utilization value, JIT planning techniques requires the largest buffer size, while Before time technique requires the least buffer
size. This is due to the fact that with the Before time technique, each request is scheduled to be shown before the required time by a specific time (minimum or maximum delay time), and hence, less buffer is required. In the next experiment, we investigated the role of memory in retrieval optimization using Simple Memory Buffering Mechanism, SimB. We treated the system load on the server as a discrete function over time.
208
Streaming of Continuous Media for Distance Education Systems
Table 4. Simulation results without SimB
|
Two level optimization improvement (or degradation) |
|
|
|||
No. of |
over worst/avg cases |
|
|
TResponse improvement (or degra- |
||
|
|
|
|
|||
Primary |
|
|
|
|||
Objects |
Secondary optimization metrics |
dation) over worst/avg cases |
||||
|
optimization |
|
|
|||
|
metric |
|
|
|
|
|
|
|
|
|
|
|
|
n |
TResponse |
TLatency |
∆Avg |
∆Var |
SOF Heuristic |
LOF Heuristic |
3 |
36% / 22% |
93% / 87% |
0% / (-91%) |
4% / (-74%) |
0% / (-22%) |
36% / 22% |
|
|
|
|
|
|
|
4 |
52% / 33% |
75% / 57% |
11% / (-56%) |
27% / (-20%) |
11% / (-26%) |
32% / 4% |
|
|
|
|
|
|
|
5 |
47% / 27% |
57% / 36% |
27% / (-45%) |
36% / (-11%) |
24% / (-4%) |
34% / 10% |
|
|
|
|
|
|
|
6 |
36% / 22% |
42% / 26% |
28% / (-74%) |
38% / (-18%) |
22% / 4% |
24% / 7% |
Table 5. Simulation results with SimB (using 4 Mbytes of memory per presentation)
|
Two level optimization improvement (or degradation) |
|
|
|||
No. of |
over worst/avg cases |
|
|
TResponse improvement (or degra- |
||
|
|
|
|
|||
Primary |
|
|
|
|||
Objects |
Secondary optimization metrics |
dation) over worst/avg cases |
||||
|
optimization |
|
|
|||
|
metric |
|
|
|
|
|
|
|
|
|
|
|
|
n |
TResponse |
TLatency |
∆Avg |
∆Var |
SOF Heuristic |
LOF Heuristic |
3 |
30% / 16% |
47% / 29% |
2% / (-63%) |
8% / (-95%) |
30% / 13% |
5% / (-14%) |
|
|
|
|
|
|
|
4 |
43% / 24% |
54% / 34% |
4% / (-55%) |
1% / (-97%) |
26% / 2% |
11% / (-18%) |
|
|
|
|
|
|
|
5 |
40% / 24% |
48% / 31% |
4% / (-56%) |
3% / (-97%) |
24% / 4% |
17% / (-5%) |
|
|
|
|
|
|
|
6 |
38% / 22% |
46% / 30% |
8% / (-82%) |
7% / (-90%) |
20% / 2% |
18% / 0% |
|
|
|
|
|
|
|
We varied the number of objects to be scheduled from three to six objects, and applied a two level optimization once using SimB and another time without the use of SimB. When using SimB, we assumed that the presentation could have a total of 4 Mbytes. Table 4 shows simulation results without using SimB, while Table 5 shows simulation results with SimB.
CONCLUSION
In a previous study (Shahabi et al., 1998), we de- finedaquery-scriptfortheSMretrievaloptimizer. Using the query script, the optimizer defines a searchspacethatconsistsofallthecorrectretrieval plans. A retrieval plan is correct if and only if
it is consistent with the defined flexibilities and requirements. The optimizer also defines a cost model to evaluate the different retrieval plans. The retrieval plans are then searched (either exhaustively or by employing heuristics) to find the best plan, depending on the metrics defined by the application. Using a simple simulation modelandsimplesearchalgorithms,wewereable to show that the optimizer can improve system performance significantly when the system load is moderate. In this article, we investigated the following. First, we investigated the theoretical bounds on the size of the search space and the search time. We concluded that both problems are NP-Hard. Second, we designed efficient algorithms (Algorithms A & B) to define the search space and find a good retrieval plan (i.e., search
209
Streaming of Continuous Media for Distance Education Systems
algorithm). Third, we discussed the impact of caching at the user terminal on the system performance. Our experimental results showed the effectiveness of our proposed model, algorithms, andtechniquesingeneratingnearoptimalretrieval plans for scheduling and displaying SM objects. The personal agent was able to generate good query scripts, based on user query, user profile, and session profile. We plan to further investigate the design of SM integrators and collectors for a distributed environment, and further enhance the personal agent.
ACKNOWLEDGMENT
This research was funded by Research Administration at Kuwait University (Project No. EO04/01).
REFERENCES
Allen, J. (1983). Maintaining knowledge about temporal intervals. Communications of the ACM, 26(11), 832-843.
Beasly, J.E. (1985a). An exact two-dimensional non-guillotine cutting tree search procedure.
Operations Research, 33(1), 49-64.
Beasly,J.E.(1985b).Algorithmsforunconstrained two-dimensionalguillotinecutting.Journalofthe Operational Research Society, 33, 297-306.
Berson, S., Ghandeharizadeh, S., Muntz, R., & Ju., X. (1994). Staggered striping in multimedia information systems. In Proceedings of the ACM SIGMOD International Conference on Management of Data (pp. 79-89).
Burke, E., & Kendall, G. (1999). Applying evolutionary algorithms and the No Fit Polygon to the nesting problem. In Proceedings of the IC-AI Conference.
Chaudhuri, S., Ghandeharizadeh, S., & Shahabi, C. (1995). Avoiding retrieval contention for composite multimedia objects. In Proceedings of the VLDB Conference.
Chen, H.J., & Little, T. (1993). Physical storage organizations for time-dependent multimedia data. In Proceedings of the Foundations of Data Organization and Algorithms (FODO) Conference.
Chen, Y.C., & Shahabi, C. (2003). Yoda: An adaptive soft classification model: Content-based similarity queries and beyond. ACM/Springer Multimedia Systems Journal (Special Issue on Content-Based Retrieval).
Christofides, N., & Whitlock, C. (1977). An algorithm for two-dimensional cutting problems.
Operations Research, 25, 31-44.
Chung, F.R.K., Garey, M.R., & Johnson, D.S. (1982). On packing two-dimensional bins. SIAM Journal on Algebraic and Discrete Methods, 3, 66-76.
Coffmann, E.G., Garey, M.R., & Johnson, D.S. (1997).Approximationalgorithmsforbinpacking: Asurvey.InD.S.Hochbaum(Ed.),Approximation algorithms for NP-hard problems (pp. 46-93). Boston: PS Publishing.
Daniels, K., & Milenkovic, V.J. (1996). Columnbased strip packing using ordered and compliant containment. In Proceedings of the 1st ACM Workshop on Applied Computational Geometry
(pp. 33-38).
Dashti, A.E., Kim, S.H., Shahabi, C., & Zimmermann, R. (2003). Streaming media server design.
IMSC Book Series: Prentice Hall.
Dyckhoff, H. (1981). A new linear programming approachtothecuttingstockproblem.Operations Research, 29(6).
Fayard, D., Hifi, M., & Zissimopoulos, V. (1996). An efficient approach for solving large-scale cutting stock problems. Preprint Eco & Math,
210
Streaming of Continuous Media for Distance Education Systems
University of Paris 1, 90, rue de Tolbiac, 75013 Paris.
Garey,M.R.,Graham,R.L.,Johnson,D.S.,&Yao, A.C. (1976). Resource constrained scheduling as generalized bin packing. Journal Combinatorial Theory, A 21, 251-298.
Garey, M.R., & Johnson, D.S. (1979). Computers and intractability: A guide to the theory of NPcompleteness. San Francisco, CA: Freeman.
Gemmell, D.J. (1996). Disk scheduling for continuous media. In S.M. Chung (Ed.), Multimedia information storage and management. Boston: Kluwer Academic.
Gemmell, D.J., Vin, H.M., Kandlur D.D., Rangan P.V., & Rowe, L.A. (1995). Multimedia storage servers: A tutorial. IEEE Computer.
Ghandeharizadeh, S., Dashti, A.E., & Shahabi, C. (1995). A pipelining mechanism to minimize the latency time in hierarchical multimedia storage managers. Computer Communications, 18(3).
Ghandeharizadeh, S., Zimmermann, R., Shi, W., Rejaie, R., Ierardi, D., & Li, T.W. (1997). Mitra: A scalable continuous media server. Multimedia Tools and Applications Journal, 5(1), 79-108.
Goel, A., Shahabi, C., Yao, S.Y.D., & Zimmermann, R. (2002). SCADDAR: An efficient randomized technique to reorganize continuous media blocks. In Proceedings of the 18th International Conference on Data Engineering.
Haessler, R.W. (1980). A note on computational modifications to the Gilmore-Gomory cutting stock algorithm. Operations Research, 28(4), 1001-1005.
Hifi, M. (1994). Study of some combinatorial optimization problems: Cutting stock, packing and setcoveringproblems.Doctoralthesis,University of Paris 1 Pantheon-Sorbonne.
Hifi, M. (1997). An improvement of Viswanathan and Bagchi’s exact algorithm for cutting stock
problems. Computers and Operations Research, 24(8), 727-736.
Hifi, M., & Zissimopoulos, V. (1996). A recursive exact algorithm for weighted two-dimensional cutting. European Journal of Operational Research, 91, 553-564.
Hinxman, A.I. (1980). The trim-loss and assortment problems: A survey. European Journal of Operational Research, 5, 8-18.
Keeton,K.,&Katz,R.H.(1995).Evaluatingvideo layout strategies for a high-performance storage server. ACM Multimedia Systems, 3(2).
Lutfiyya, H., & McMillin, B. (1991). Composite stock cutting through simulated annealing. Journal of Mathematical and Computer Modeling, 16(1), 57-74. New York: Pergamon Press.
Milenkovic, V.J. (1998). Rotational polygon containmentandminimumenclosure.InProceedings of the 14th ACM Symposium on Computational Geometry (pp. 1-8).
Muntz, R., Santos, J., & Berson, S. (1997). RIO: A real-time multimedia object server. ACM Sigmetrics Performance Evaluation Review, 25.
Ozden, B., Rastogi, R., & Silberschatz, A. (1995). A framework for the storage and retrieval of continuous media data. In Proceedings of the IEEE International Conference on Multimedia Computing and Systems.
Ozden, B., Rastogi, R., & Silberschatz, A. (1996). In S. Jajodia & S. Jajodia (Eds.), The storage (pp. 237-261). Retrieved March 8, 2007, from the Multimedia Database, Springer.
Ozsu, M., & Valduriez, P. (1996). Distributed and parallel of computer science and engineering.
CRC Press.
Rangan, P., & Vin, H. (1993). Efficient storage techniques for digital and data engineering, 5(4).
211
Streaming of Continuous Media for Distance Education Systems
Sarker, B.R. (1988). An optimum solution for one dimensional splitting problems: A dynamic programming approach. Journal of Operational Research, 39(8), 749-755.
Sechen, C., & Vincenelli, S. (1986). TimberWolf3.2: A new standard cell placement and global routing package. In Proceedings of the 23rd Design Automation Conference (pp. 432439). Las Vegas, NV.
Shahabi, C. (1996). Scheduling the retrieval of continuous media objects. Doctoral thesis, University of Southern California.
Shahabi, C., Dashti, A.E., & Ghandeharizadeh, S. (1998). Profile aware retrieval optimizer for continuous media. In Proceedings of the World Automation Congress (WAC).
Shahabi, C., Zarkesh, A., Adibi, J., & Shah, V. (1997). Knowledge discovery from users webpage navigation. In Proceedings of the Research Issues in Data Engineering (RIDE) Workshop.
Shahabi, C., Zimmermann, R., Fu, K., & Yao, S.Y.D. (2002). Yima: A second generation continuous media server. IEEE Computer, 35(6), 56-64.
Tobagi, F.A., Pang, J., Baird, R., & Gang, M. (1993). Streaming RAID. In Proceedings of the 1st ACM Conference on Multimedia.
Viswanathan,K.V.,&Bagchi,A.(1993).Best-first search methods for constrained two-dimensional cutting stock problems. Operations Research, 41(4), 768-776.
Zimmermann, R., Fu, K., Shahabi, C., Yao, D., & Zhu, H. (2001). Yima: Design and evaluation of a streaming media system for residential broadband services. In Proceedings of the VLDB 2001 Workshop on Databases in Telecommunications (DBTel 2001).
ENDNOTES
1These temporal relationships can be defined
by the user or the application.
2The number of I/O’s to retrieve continuous media objects from the CM server is fixed; however, different retrieval plans influence retrieval contention at the server. Prime finds a retrieval plan such that it minimizes contention at the CM server, in order to
improve system performance.
3This threshold could be specified by user or by system.
212
Streaming of Continuous Media for Distance Education Systems
appENDIX
Consider the following notations:
•RP [2, n]: A 2D array, where RP[1, j]( j: 1 ≤ j ≤ n) fives the position of object j (oj) in the retrieval plan (p) (i.e., Pos(oj, p)), and RP [2, j] gives the confidence value of displaying object oj in the Pos(oj, p)th position in the retrieval plan (i.e., α(oj, Pos(oj, p)))
•OPC [n, n] A 2D array, where OPC [i, j] ( i: 1 ≤ i, j ≤ n) specifies the confidence of displaying oi at position j in p (α(oi, j))
•SOPC [n, n]: A 2D matrix, where each column of the matrix (i.e., elements from SOPC [1, i]…SOPC [n, i], i: 1 ≤ i ≤ n) contains the objects ordered descendingly by their confidence level value of appearing at position i in plan p (i.e., ordered descendingly by their α(oj, i) values).
•SAP [n]: An array that contains n pointers to the n columns of SOPC [n, n], where SAP [i] ( i: 1 ≤ i ≤ n) points to the next element that we want to check/examine if it can be scheduled at postion i in p or not.
Algorithm A
1.Initialize all RP[2, n] entries to zeros;
%We do not know the display positions of the objects and their confidence values.
%The algorithm terminates when all positions are filled
%(i.e., RP[1, i] ≠ 0 and RP[1, i] ≠ RP[1, j]: i: 1 ≤ i, j ≤ n and i ≠ j
2.Apply a sorting algorithm for each column of the OPC [n, n] matrix and store the sorted objects in the corresponding column in matrix [n, n];
3.Initialize all SAP [n] entries to ones;
%The ith pointer is pointing to the first element of the n sorted objects at
%position i of the display order (the element with the highest confidence value
%to appear to position i).
4.Create a set S that contains n elements that represents all the positions at which the objects will be displayed;
5.Randomly extract an element from S that represents position pos;
6.Pick the first element from the sorted list at pos (i.e., object (oc) at SOPC [1, pos];
%Assume that oc is oj and pos is i.
7.While S is not empty do
{
%Next we want to check if oj is already scheduled at another position other than
%i or not? If it is scheduled at another position, does it have a higher
%confidence value to be scheduled at position i or the other position?
Case 1 Object oj is not scheduled at any other position (check if RP[1, j] = 0)
213
Streaming of Continuous Media for Distance Education Systems
a)RP[1, j] = i; (schedule oj at position i)
b)RP[2, j] = OPC [j, i]; (save the confidence value of scheduling oj at position i)
c)SAP [i] = SAP [i]+ 1; (the pointer points to the next element with the hightest confidence value after oj to be scheduled at position i)
d)Randomly extract an element from S that represents that represents a new position pos
Case 2 Object oj was scheduled at another position (i.e., RP[1, j] ≠ i) but with a higher confidence value (RP[2, j] > OPC [j, i]). Then we have to look for another element to be scheduled at position i (look at next element in SOPC [SAP [i], i])
a)SAP [i], = SAP [i] + 1; (Then we have to look for next element with a lesser confidence value to be scheduled at postion i)
b)Object oj is now the new object to be scheduled at the new postion SAP [i];
c)Continue; (The same algorithm will re-apply, except now we have another scheduling problem; i.e., we now want check if we can schedule the new object oj at the new position i)
Case 3 Object oj was scheduled at another position (i.e., RP[1, j] ≠ i) but with a lower confidence value than if it gets scheduled at position i (i.e., RP[2, j]< OPC [j, i]). Hence, we need to schedule object at position I and look for another object (which is at SAP [RP[1,j]]) to be scheduled at position RP[1,j].
a) Temp-Position = RP [1, j]; (temporarily save the position where oj was scheduled) b) RP[1, j] = i; (the new position for oj is i)
c) RP[2, j] = OPC [j, i]; (the new confidence value for scheduling oj at postion i)
d) SAP[i] = SAP [i]+1; ( the pointer points to the next element with the highest confidence value after o to be scheduled
j
at position i)
e)SAP[Temp - Position] = SAP[Temp - Position] + 1; (the pointer points to the next element (otemp) with the highest confidence value after oj in the old positioin to be scheduled at the old position)
f)Object at otemp is now the ne object to be scheduled at the new postion Temp – Position;
g)Continue; (The same algorithm will re-apply, except now we have another schedulig problem; i.e., we now want check
if we can schedule the new object otemp at the new position Temp – Position)
}
Algorithm B (inputs: level (l), position (fp))
fp: is the position at which we want to fix the schedule of an object, for 1 ≤ fp ≤ n). l: is the level that we want to fix the schedule of an object, for 1 ≤ l ≤ n).
1.Initialize all RP[2, n] entries to zeros;
%We do not know the display positions of the objects and their confidence values.
%The algorithm terminates when all positions are filled
%(i.e., RP[1, i] ≠ 0 and RP[1, i] ≠ RP[1, j]; i: 1 ≤ i, j ≤ n and i ≠ j)
2.Apply a sorting algorithm for each column of the OPC [] matrix and store the sorted objects in the corresponding column in matrix SOPC [n, n];
214
Streaming of Continuous Media for Distance Education Systems
3.Initialized all SAP [n] entiries to ones except for SAP [fp] that should be initialized and locked (never changes) to l;
%The ith pointer is pointing to the first elelment of the n sorted objects at
%position i of the display order (the element with the highest confidence value
%to appear to position i), except for the fpth pointer is pointed to the lth
%element (ol)(with the lth confidence value to spear to position fp)
4.Create a set S that contains n-1 elements that represents all the positions at which the objects will be displayed, except position fp;
5.Randomly extract an element from S that represents positions pos;
6.Pick the first element from the sorted list at pos (i.e., object (oc) at SOPC [1, pos]
%Assume that oc is oj and pos is i.
7.While S is not empty do
{
%Next we want to check if oj is already scheduled at another position other than
%i or not? If it is scheduled at another position, does it have a higher
%confidence value to be scheduled at position i or the other position?
Case 1 object is not scheduled at any other position (check if RP[1, j] = 0)
a)RP[1, j] = i; (schedule oj at position i)
b)RP[2, j] = OPC [j, i]; (save the confidence value of scheduling oj at position i)
c)SAP [i] = SAP [i] + 1; (the pointer points to the next element with the highest confidence value after oj to be scheduled at position i)
d)Randomly extract an element from S that represents a new position pos
Case 2 Object oj was scheduled at another position (i.e., RP[1, j] ≠ i) but with a higher confidence value (i.e., RP[2, j] > OPC[j, i]). Then we have to look for another element to be scheduled at position i (look at next element in SOPC [SAP [i], i])
a)SAP[i] = SAP [i] + 1; (Then we have to look for next element with a lesser confidence value to be scheduled at position i)
b)Object oj is now the new object to be scheduled at the new postion SAP [i];
c)Continue; (The same algorithm will re-apply, except now we have another scheduling problem; i.e., we now want check if we can schedule the new object oj at the new position i)
Case 3 Object oj was scheduled at another position (i.e., RP[1, j] ≠ i) but with a lower confidence value than if it gets scheduled at postion I (i.e., RP[2, j] < OPC[j,i]). Hence, we need to schedule object oj at position i and look for another object (which is at SAP [RP[1, j]]) to be scheduled at postion RP[1, j]. However, if oj = ol , then look at the next element (object at position SAP [i] + 1 to schedule at position i
oj = ol a) SAP [i] = SAP [i] + 1; (Then we have to look for next element with a lesser confidence value to be scheduled at position i)
b)Object oj is now the new object to be scheduled at the new position SAP [i];
c)Continue; (The same algorithm will re-apply, except now we have another scheduling problem; i.e., we now want check if we can schedule the new object oj at the new position i)
215
Streaming of Continuous Media for Distance Education Systems
oj ≠ ol a) Temp-position = RP [1, j]; (temporarily save the position where oj was scheduled) b) RP[1, j] = i; (the new position for oj is i)
c) RP[2, j] = OPC [j, i]; (the new confidence value for scheduling oj at position i)
d) SAP [i] = SAP [i] + 1: (the pointer points to the next element with the highest confidence value after oj to be scheduled at position i)
e) SAP [Temp – Position] = SAP [Temp – Position] + 1;(the pointer points to the next element (otemp) with the highest confidence value after oj in the old position to be scheduled at the old position)
f) Object at otemp is now the ne object to be scheduled at the new position Temp – Position;
g) Continue; (The same algorithm will re-apply, except now we have another scheduling problem; i.e., we now want check if was can schedule the new object otemp at the new position Temp – Position)
This work was previously published in International Journal of Distance Education Technologies, Vol. 5, Issue 3, edited by S. Chang and T. Shih, pp. 42-66, copyright 2007 by IGI Publishing (an imprint of IGI Global).
216
217
Chapter XVI
How Did They Study at a
Distance?
Experiences of IGNOU Graduates
Manjulika Srivastava
Indira Gandhi National Open University, India
Venugopal Reddy
Indira Gandhi National Open University, India
ABSTRACT
The question why some learners successfully study through distance mode and others do not is increasingly becoming important as open and distance learning (ODL) has come to occupy a prominent place in providing higher education to large segments of the population in India. With barely 1112 students studying through distance mode in 1962, the number has crossed 2.8 million in 2006. This article presents the findings of an empirical research study conducted to investigate the study habits of successful distance learners of the India Gandhi National Open University (IGNOU). Every year, nearly 70,000-80,000 pass out of IGNOU. What strategies were adopted by these diverse groups, what media they utilized, and what modes of support they prefered are some of the major issues addressed in this study.
INTRODUCTION
India has emerged as one of the largest distance education systems in the world, with more than 2.8 million people studying through distance mode, which is equal to 24% of the total students
in higher education in the country. The Ministry of Human Resource Development has assigned the target to distance education institutions of enrolling 40% of the total students in higher education by the end of the Tenth Plan period in 2007 (IGNOU, 2006).
Copyright © 2009, IGI Global, distributing in print or electronic forms without written permission of IGI Global is prohibited.
How Did They Study at a Distance? Experiences of IGNOU Graduates
Today, the Indian ODL system comprises a NationalOpenUniversity,12StateOpenUniversities,and106dualmodeconventionaluniversities. IGNOU alone contributes to 10% of the total enrollment in higher education in the country (Srivastava & Ramegowda, 2006). In fact, it can be said that “IGNOU is leading a silent revolution in the higher education system of the country” (Dikshit, IGNOU, 2005, p. 4). It has emerged as the largest international education institution in 2006, with 1.4 million students on its rolls from India and 32 other countries (IGNOU, 2006).
Like other open universities of the world, IGNOU has adopted a multimedia approach to instruction.Thelearning(printmaterial)package is based on instructional design and comprises printed materials (Self-learning materials), audio and video programmes, assignments, and limited face-to-face counseling sessions. In some professional programmes, practicals/ hands-on-experi- ence and project work are also included.
To give more weightage to the component of interactivity in the learning process, IGNOU in
Table 1. An overview of IGNOU’s growth
the 1990s introduced teleconferencing through downlink stations and interactive radio counseling through radio and FM stations throughout the country (Manjulika & Reddy 2000). Since 2002, there has been an extensive use of the Internet for providing instruction in a few programmes, but mainly for supporting learners. Through a dedicated satellite for education, satellite-based education, namely EduSat, has commenced its operations since 2005. It has made two-way videoconferencing possible through a network of receiving-end terminals all over India.
Since IGNOU’s students are spread all over the country, it has set-up, and since its inception in 1985, it has a network of Learner Support Centres comprising Regional Centres (RCs), and Study Centers (SCs) located at major cities, towns, and even in some rural and remote areas of the country.
The details of IGNOU’s increasing student enrolment, staff strength, support services network, academic programmes, and so forth, is given in Table 1.
Head |
2001 |
2002 |
2003 |
2006 |
|
|
|||||
|
|
|
|
|
|
Programmes on offer |
62 |
72 |
75 |
125 |
|
Courses on offer |
673 |
754 |
820 |
1000 |
|
|
|
|
|
|
|
Regional Centres |
41(13) |
46(13) |
48 |
58 |
|
Study Centres |
650(17) |
798(21) |
1081 |
1409 |
|
Subregional Centers |
…. |
…. |
…. |
6 |
|
Overseas Centres |
…. |
…. |
23 |
37 |
|
|
|
|
|
|
|
Students enrolled (in 000s) |
304,681 |
301,724 |
316,547 |
429542 |
|
|
|
||||
Students on rolls |
|
804.271 |
|
1433490 |
|
(cumulative) (in 000s) |
750.873 |
1013.631 |
|||
|
|
||||
Students awarded (degrees/ |
|
76,704 |
|
75174 |
|
diplomas/certificates) |
62,369 |
81,931 |
|||
|
|
||||
|
|
|
|
|
|
Faculty Staff: |
|
|
|
|
|
Academic Counsellors (at |
20364 |
20500 |
25,500 |
48000 |
|
SCs) |
|||||
|
|
|
|
||
Teachers/Academics |
257 |
269 |
300 |
325 |
|
875 |
874 |
1415 |
1137 |
||
Administrative staff |
|||||
|
|
|
|
||
|
|
|
|
|
|
No. of audios |
1109 |
1175 |
1235 |
8000 |
|
No. of videos |
1246 |
1445 |
1520 |
2000 |
218
How Did They Study at a Distance? Experiences of IGNOU Graduates
Today, IGNOU has a cumulative enrolment of 1400 thousand students. The success rate is increasingannually.Nearly600thousandIGNOU learners have been awarded degrees, diplomas, and certificates to date (IGNOU, 2006).
RaTionale FOR Study
By nature, distance education (DE) programmes offeredbyIGNOU,likeanyotherDistanceTeachingUniversity,relyheavilyontheindividuallearners’ abilities to manage and control their personal and situational circumstances, and remain motivated in order to achieve success. By “success,” it is implied that the programme of study had beensuccessfullycompleted.Therearedefinitely some factors which contribute to the successful completion of a programme. While studies of distance learners have focused on problems and barriers faced by distance learners, few studies have focused upon individual learning strategies and study habits, and preferred modes of support, including the instructional design adopted by the institution in relation to their success.
However, only a few studies on Indian distance learners have focused on the relationship of learner characteristics to success in DE, namely those conducted by Arun (1990), Das (1992), Kumar (1996), Villi(1999), Taplin (2000), and Biswas (2001).
Thesestudieshavefocusedonthepredisposing characteristics of learners and the institutional variables that contributed to their success (Arun, 1990). Biswas (2001) and Das (1992) have also analyzed the approaches to studying at a distance and their study habits.
Arun (1990) and Das (1992) did a comparative study of learners enrolled in a Dual-mode university. They did statistical comparison of conventional learners and distance learners and proved that the former had performed better than the latter.
Villi (1999) examined the study habits of distance learners enrolled at Madras University, which is a Dual-mode university. He focused on their study strategy just before and during the exams.
Of these studies, only three pertain to IGNOU learners. Kumar (1996) presented the attitudes of IGNOU learners in general toward DE and related it to their academic performance. Taplin’s (2000) study focused on the women learners. She presented a few case studies of successful IGNOU women learners and investigated their empowerment through DE. Biswas’ study (2001) was limited to a small sample of learners, which is not representative of IGNOU learners who are spread throughout the country.
In the absence of substantial research in this area, particularly in the context of IGNOU, which is a Mega Open University enrolling more than 350 thousand, with nearly 70,000-80,000 successfully completing their programmes of study every year. The researcher was inspired to do a study on the study strategy of successful IGNOU learners, which would not only give an insight about what these successful learners have done to succeed, but also about the media and support servicestheyutilizedduringtheircourseofstudy. Hence, the study was conducted.
Purpose
The purpose of this study was to examine the relationship of the learners’ perception of the IGNOU’s instructional and support systems as well as their own study habits that contributed to their successful completion of the programmes of study. The study addressed four main research questions:
•Who participates and succeeds in distance education?
•How do distance learners of IGNOU study?
219
How Did They Study at a Distance? Experiences of IGNOU Graduates
•Whichinstructionalinputscontributedtothe completion of their programme of study?
•What were the modes of support preferred by these successful learners?
Methhdology
Universe and Sample
The empirical research study was accomplished by surveying the successful graduates of IGNOU who attended the 13th Convocation held at New Delhiand3RegionalCentresviz,Bhubaneshwar, Ranchi, and Cochin, in March 2002. Graduates of traditional programmes like Bachelor Degree Programmes (BDP), namely Bachelor of Arts (BA) and Bachelor of Commerce (B.Com), and professionalprogrammes,likeBachelorofLibrary Sciences (BLIS) and Bachelor of Computer Applications (BCA), were selected as the sample for the study.
Thus, the sample selected included learners from different backgrounds, diverse educational qualifications, professions, experiences, regional locations, and ages, as the entry requirements variedfromprogrammetoprogramme.Theseare also the programmes that attract more learners as compared to other programmes.
In1989-1990,75%ofthestudentswereenrolled in BDP (i.e., BA and BCom programmes). Today, barely 25% are enrolled in these programmes. On the other hand, nearly 60% of the students are enrolled in the Computer (40%) and Management (20%) programmes put together. This trend has been noticeable ever since IGNOU introduced the MBA programme, and even more so with the introduction of Computer programmes. This shift is in tune with the national demand for more Management and Computer professionals.
Tools Developed
A questionnaire was developed by the researchers, which was pretested and modified before
being administered to the graduates who came to collect their degrees in person at the above mentioned locations.
The questionnaire distributed comprised two major sections, a student profile which had 16 items covering all the background characteristics of distance learners, and Study Habits, which had 28itemscoveringvariousaspectspertainingtothe strategy adopted for studying at a distance, media utilized for studying, and usefulness of support providedbyIGNOU.Thequestionnairecomprised both structured and open ended questions
Data Collection and Analysis
Questionnaires were mailed to the selected 967 graduates.Thereafter,interviewswereconducted at random, with 10 of the respondents from each programmebasedinDelhi(wheretheresearcheris based) in order to get a deeper insight. The SPSS package was used for analysis of data.
Of the 967 graduates who were sent questionnaires,278returnedthemwithinafewmonthsand 50 questionnaires were returned back as undelivered mail. Hence, the final sample of this study constituted 917 students. The overall response rate was 34%, which was quite satisfactory. For details, refer to Table 2.
PROfile of the RREpONDENTS
The data presented in Table 2 reveals that 54.3% of the respondents were from Delhi as compared to other regions, even though an attempt was made to avoid the Delhi bias. This was probably because Delhi covers two regions (Delhi 1 and Delhi 2) which not only enroll a large number of students every year, but also the number who pass out from this region dominate in terms of actual numbers.
Males dominated and accounted for 72.3% of the respondents. Women were mostly enrolled in the traditional programmes like BA and BCom
220
How Did They Study at a Distance? Experiences of IGNOU Graduates
Table 2. Response rate and distribution of sample: programme-, region-, and gender-
Prog. |
Qs. sent |
Returned |
NR |
Delhi |
Ranchi |
BhubaRegion |
Kochi |
Male |
Female |
|
Region |
Region |
Region |
||||||||
|
|
|
|
|
|
|
||||
|
|
|
|
|
|
|
|
|
|
|
BLIS |
176 |
56 |
6 |
32 |
2 |
14 |
8 |
48 |
8 |
|
|
|
|
|
|
|
|
|
|
|
|
BCA |
197 |
72 |
20 |
39 |
3 |
18 |
12 |
70 |
2 |
|
|
|
|
|
|
|
|
|
|
|
|
BDP |
594 |
150 |
24 |
84 |
22 |
30 |
14 |
83 |
67 |
|
|
|
|
|
|
|
|
|
|
|
|
ALL |
967 |
278 |
50 |
151 |
32 |
52 |
43 |
201 |
77 |
|
|
|
|
|
|
|
|
|
|
|
Source: Field Data
NR: Not Responded
Table 3. Age of the respondents
Program |
Age(in years) |
|
|
|
|
|
|
|
|
|
|
|
20-25 |
26-35 |
36-45 |
46+ |
NS |
|
|
|
|
|
|
BLIS |
41.7 |
44.4 |
5.6 |
NIL |
8.3 |
|
|
|
|
|
|
BCA |
86.0 |
12.0 |
NIL |
NIL |
2.0 |
|
|
|
|
|
|
BDP |
43.5 |
37.1 |
11.3 |
6.5 |
1.6 |
|
|
|
|
|
|
ALL |
53.3 |
32.4 |
7.6 |
3.8 |
2.9 |
|
|
|
|
|
|
Source: Field Data
NS: Not Specified
that constitute BDP, although 13% of the women had successfully completed BLIS (10.4%) and BCA (2.5%) programmes.
Age-wise data presented in Table 3 reveals that a majority of the respondents (53.3%) were in the 20-25 years age group and barely 3.8% were above 46 years of age.
BCA learners (86%) constituted the major bulk of young learners in the below 25 years
age group. It is noteworthy that none of the BCA learners were above 35 years of age and BLIS above 45 years.
Theemploymentstatusoftherespondentswas as follows: 41% were full time employees, 7.1% part-time employees, 6.7% were self-employed, 16.1% were unemployed, and 28.1% stated that they were full-time learners (refer to Table 4).
Mainly, BCA learners had more access to computers than BDP and BLIS learners. Of the traditional media, TV was the most accessible electronicmediumforallthelearners.Fordetails, see Table 5.
DISCUSSION
The data collected through questionnaires was subjected to programme-wise analysis as well as profile-wise analysis, taking into consideration
Table 4. Employment status of respondents
Program |
Full-time |
Part-time |
Self-employed |
Unemployed |
Full time |
NS |
|
|
|
|
|
learners |
|
BLIS |
27.8 |
19.4 |
5.6 |
28.3 |
18.9 |
Nil |
|
|
|
|
|
|
|
BCA |
26.0 |
2.0 |
6.0 |
28.0 |
38.0 |
Nil |
|
|
|
|
|
|
|
BDP |
58.8 |
5.6 |
7.3 |
14.6 |
12.1 |
1.6 |
|
|
|
|
|
|
|
ALL |
41.0 |
7.1 |
6.7 |
16.1 |
28.1 |
1.0 |
|
|
|
|
|
|
|
Source: Field Data
221
How Did They Study at a Distance? Experiences of IGNOU Graduates
Table 5. Respondents’ access to media
Prog. |
Comp. |
Internet |
TV |
VCR |
Radio |
A/V |
Library |
None |
NS |
|
Tapes |
||||||||||
|
|
|
|
|
|
|
|
|
||
|
|
|
|
|
|
|
|
|
|
|
BLIS |
41.7 |
11.1 |
55.6 |
16.7 |
19.4 |
5.6 |
2.8 |
Nil |
16.7 |
|
|
|
|
|
|
|
|
|
|
|
|
BCA |
92.0 |
70.0 |
60.0 |
30.0 |
42.0 |
10.0 |
Nil |
Nil |
2.0 |
|
|
|
|
|
|
|
|
|
|
|
|
BDP |
28.2 |
20.2 |
47.6 |
8.9 |
21.8 |
4.8 |
Nil |
3.2 |
30.6 |
|
|
|
|
|
|
|
|
|
|
|
|
ALL |
45.7 |
30.5 |
51.9 |
15.2 |
26.2 |
6.2 |
0.5 |
1.9 |
21.4 |
|
|
|
|
|
|
|
|
|
|
|
Source: Field Data
factors like gender, age educational background, employment status, income, and so forth, as all these factors in one way or another influence the study habits and learning styles adopted by distancelearners.Detailedanalysescoveringvarious aspects have been presented below.
Objective of Studying at IGNOU
ThemajorityoftheBCAstudents(78%)responded that their purpose of study was to get a degree. Interestingly, students from BDP (67%) and BLIS (66%) responded that their objective of study was promotion/careeradvancement.However,overall 69.5% studied for career advancement, 23.3% students mentioned that their purpose of study was to get a degree, 18.6% also expressed that they were keen to enrich their knowledge skills, 3.3% to get job, and 3.8% for enjoyment purposes
Table 6. Objective of studying at IGNOU
(refer to Table 6 for details). Those enrolled for enrichment were mostly women and the majority of them were above 40 years of age.
Use of Media
Interestingly, none of them preferred to adopt any innovations in their learning process, not even technological interventions provided by IGNOU. On the contrary, they were very passive learners, as they mainly relied on the printed Self-learning materials (SLMs). A majority of them (89.8%) found the printed materials the most useful, and other media like teleconferencing (15.2%), video tapes (2.9%), audio tapes (2.9%), and interactive radio counseling (6.7%) was hardly found useful by the learners, which is indicated by the small percentage of learners who found them useful (See Table 7). It is noteworthy that 73.8% found
SN |
Item |
All |
Programmes |
|
Age |
|
|
|
|
|
|
|
|
|
|
|
|
|
|
|
|
|
|
All |
BLIS |
BCA |
BDP |
20-25 |
26-35 |
36-45 |
46-55 |
NS |
|
|
|
||||||||
|
|
|
|
|
|
|
|
|
|
|
1 |
Enjoyment |
3.8 |
2.8 |
10.0 |
1.6 |
4.5 |
2.9 |
|
|
16.7 |
|
|
|
|
|
|
|
|
|
|
|
2 |
Enrichment |
18.6 |
11.1 |
22.0 |
19.4 |
19.6 |
11.8 |
18.8 |
62.5 |
19.3 |
|
|
|
|
|
|
|
|
|
|
|
3 |
Career Enhancement |
69.5 |
66.7 |
12.0 |
66.9 |
68.8 |
73.5 |
68.8 |
50.0 |
66.7 |
|
|
|
|
|
|
|
|
|
|
|
4 |
Getting a Degree |
23.3 |
19.4 |
78.0 |
29.0 |
22.3 |
27.9 |
18.8 |
12.5 |
16.7 |
|
|
|
|
|
|
|
|
|
|
|
5 |
Getting a Job |
3.3 |
5.6 |
2.0 |
3.2 |
2.7 |
5.9 |
|
|
|
|
|
|
|
|
|
|
|
|
|
|
6 |
Not Specified |
0.5 |
2.8 |
|
|
1.9 |
|
|
|
|
|
|
|
|
|
|
|
|
|
|
|
7 |
All |
100 |
100 |
100 |
100 |
100 |
100 |
100 |
100 |
100 |
|
|
|
|
|
|
|
|
|
|
|
222
How Did They Study at a Distance? Experiences of IGNOU Graduates
Table 6. continued
SN |
Item |
Gender |
|
|
|
|
|
|
|
|
|
|
|
Male |
|
Female |
NS |
|
|
|
|
|
|
1 |
Enjoyment |
3.3 |
|
5.2 |
|
|
|
|
|
|
|
2 |
Enrichment |
15.5 |
|
50.0 |
|
|
|
|
|
|
|
3 |
Career En- |
68.0 |
|
74.1 |
50.0 |
hancement |
|
||||
|
|
|
|
|
|
|
|
|
|
|
|
4 |
Getting a De- |
25.3 |
|
19.0 |
|
gree |
|
|
|||
|
|
|
|
|
|
|
|
|
|
|
|
5 |
Getting a Job |
2.7 |
|
5.2 |
|
|
|
|
|
|
|
6 |
Not Specified |
1.7 |
|
|
|
|
|
|
|
|
|
7 |
All |
100 |
|
100 |
100 |
|
|
|
|
|
|
Source: Field Data
Table 7.
Item |
All |
Programmes |
|
|
|
|
|
|
|
|
|
|
All |
BLIS |
|
BCA |
BDP |
|
|
|
|
|
|
Printed material provided by IGNOU |
87.8 |
80.6 |
|
86.0 |
85.5 |
|
|
|
|
|
|
Discussions in counseling sessions |
51.0 |
61.1 |
|
38.0 |
53.2 |
|
|
|
|
|
|
Lectures by counselors |
53.8 |
58.3 |
|
62.0 |
49.2 |
|
|
|
|
|
|
Attending practicals |
34.8 |
58.3 |
|
54.0 |
20.2 |
|
|
|
|
|
|
Reference books (library) |
51.0 |
63.9 |
|
70.0 |
39.5 |
|
|
|
|
|
|
Assignments |
73.8 |
66.7 |
|
78.0 |
74.2 |
|
|
|
|
|
|
Private tutors |
12.9 |
13.9 |
|
24.0 |
8.1 |
|
|
|
|
|
|
Internet-based resources |
12.4 |
8.3 |
|
28.0 |
7.3 |
|
|
|
|
|
|
Audio tapes |
2.9 |
- |
|
- |
4.8 |
|
|
|
|
|
|
Video tapes |
2.9 |
2.8 |
|
- |
4.0 |
|
|
|
|
|
|
Radio counseling |
6.7 |
2.8 |
|
- |
10.5 |
|
|
|
|
|
|
Teleconferencing |
15.2 |
11.1 |
|
6.0 |
20.2 |
|
|
|
|
|
|
Other study guides. |
14.2 |
11.0 |
|
10.0 |
16.9 |
|
|
|
|
|
|
All |
100 |
100 |
|
100 |
100 |
|
|
|
|
|
|
Source: Field Data
the assignments followed by lectures given by academic counselors (53.8%), library facilities (51%), and discussions in counseling sessions (51%) very useful in their learning endeavour. Barely 12.4% found Internet-based resources and study guides (14.2%) useful in their learning endeavour.Privatetutorials/coachingwaspatron-
ized mainly by the BCA learners (24%), who were young and mostly full-time learners who were unemployed. Also, BCA was a tougher course, with a demand for hands on training, which was provided for limited hours at the Study Centre, which was not enough for the learners to master the subject. Radio counseling and teleconferencing were mainly utilized by BDP learners.
223
How Did They Study at a Distance? Experiences of IGNOU Graduates
Place of Study
More than 95% expressed that they studied from their home because that was the most convenient placeintermsoffacilitiesandtimings,takinginto consideration the nature of their job, domestic demands, and so forth. Reading at libraries was noticed more in BLIS (81%), compared to BCA (68%) and BDP (48%), which really coincides with their nature of jobs, as all BLIS learners were employed at libraries.
Learners from BCA (58%) had expressed that they used a “friend’s house” as a study place because many of them were full-time learners between 20-25 years of age. Students studying from tuitions/private institutions for additional coachingwerenoticedmainlyfromBCAbecause the programme involved lots of “hands-on-train- ing” and separate practical final examinations, which normally would have made learners go for additional coaching for theory and practice.
Region-wise analysis revealed that there was not much variation with regard to home-based study. However, variations were noticed with regardtostudyat“office/workplace”(Delhi38%,
Table 8. Place of study
Bhubaneshwar 42%, Cochin 24%, and Ranchi 13.5%) (Refer to Table 8).
Input of Study Hours
The respondents can be divided into four categories, as far as the number of study hours put in by them per week, as 26.2% of them put in 1-5 hours per week, 34.3% 6-10 hours, 19.0% 11-15 hours, 12.9 % 16-30 hours, and 6.7% more than 30 hours per week.
Gender-wise analysis revealed that males had put in more hours per week compared to women. For women, although they might be working outside their homes, the major responsibility of managing the house and children rested squarely on them, and was hardly shared by their spouses or other family members.
ManyoftheBLISstudentswereemployed,and hence they devoted less hours (1-5 hrs) compared to BCA and BDP students. It was clearly noticed that BCA learners had spent more hours for their study because BCA involved a large number of hands-on-practicalsessions(75%ofthesesessions were compulsory to attend).
Item |
All |
Programmes |
|
Regions |
|
|
|
|
|
|
|
|
|
|
|
|
|
|
All |
BLIS |
BCA |
BDP |
Delhi |
Bhuba |
Ranchi |
Kochi |
|
|
|
|
|
|
|
|
|
Home |
96.7 |
94.4 |
98.0 |
96.8 |
97.4 |
97.4 |
94.6 |
95.2 |
|
|
|
|
|
|
|
|
|
Office |
32.9 |
33.3 |
26.0 |
35.5 |
37.7 |
42.1 |
13.5 |
23.8 |
|
|
|
|
|
|
|
|
|
Friends’ home |
43.3 |
36.1 |
58.0 |
39.5 |
40.4 |
50.0 |
54.1 |
28.6 |
|
|
|
|
|
|
|
|
|
Park |
9.5 |
5.6 |
4.0 |
12.9 |
11.4 |
7.9 |
8.1 |
4.8 |
|
|
|
|
|
|
|
|
|
Library |
58.1 |
80.6 |
68.0 |
47.6 |
55.3 |
71.1 |
62.2 |
42.9 |
|
|
|
|
|
|
|
|
|
Traveling |
13.3 |
16.7 |
14.0 |
12.1 |
14.0 |
5.3 |
18.9 |
14.3 |
|
|
|
|
|
|
|
|
|
Tuitions/Pvt. |
2.4 |
|
10.0 |
|
1.8 |
|
8.1 |
|
Institutes |
|
|
|
|
||||
|
|
|
|
|
|
|
|
|
|
|
|
|
|
|
|
|
|
SC/PSC |
1.4 |
|
2.0 |
1.6 |
2.6 |
|
|
|
|
|
|
|
|
|
|
|
|
Not Specified |
1.4 |
|
|
2.4 |
0.9 |
|
5.4 |
|
|
|
|
|
|
|
|
|
|
All |
100 |
100 |
100 |
100 |
100 |
100 |
100 |
100 |
|
|
|
|
|
|
|
|
|
Source: Field Data
224
How Did They Study at a Distance? Experiences of IGNOU Graduates
Table 9. Input of study hours
S No |
Item |
All |
Programmes |
|
|
|
|
|
|
|
|
|
|
|
|
All |
BLIS |
|
BCA |
BDP |
|
|
|
|
|
|
|
1 |
1-5 Hours |
26.2 |
46.1 |
|
6.0 |
27.4 |
|
|
|
|
|
|
|
2 |
6-10 Hours |
34.3 |
26.1 |
|
38.0 |
36.3 |
|
|
|
|
|
|
|
3 |
11-15 Hours |
19.0 |
11.1 |
|
22.0 |
20.2 |
|
|
|
|
|
|
|
4 |
16-30 Hours |
12.9 |
13.9 |
|
18.0 |
10.5 |
|
|
|
|
|
|
|
5 |
More than 30 Hours |
6.7 |
2.8 |
|
14.0 |
4.8 |
|
|
|
|
|
|
|
6 |
Not specified |
1.0 |
- |
|
2.0 |
.8 |
|
|
|
|
|
|
|
7 |
All |
100 |
100 |
|
100 |
100 |
|
|
|
|
|
|
|
Source: Field Data
BCA and BDP, being degree programmes of 3 years duration, also had a heavy work load of 32-34 credits per year (1 credit = 30 study hours). The data presented in Table 9 confirms this.
Methods Adopted for Learning
Nearly 60% (58.7%) of the respondents simply read the materials and tried to understand everything they read; 33.4% of them underlined the printed material; 35.6% made notes in the margins, 15.2% made separate notes; 13.9% answered Check your progress questions given in the course materials; 17.2% prepared concept
Table 10. Methods adopted for learning
mapsandflowcharts;28.4%madesummaries;and barely 13.1% simply memorized everything. But the basic method adopted was no doubt learning by rote, which was confirmed by them when the researcher interviewed them.
When asked to specify how much they studied from the examination point of view, 63.9% of them answered in the affirmative.
Utilization of Support Services
Access to media at the Study Centre and home varied depending on their backgrounds. Interestingly, the Mean Score value for usage of these
Item |
|
Programmes |
|
|
|
|
|
|
|
|
|
|
All |
BLIS |
|
BCA |
BDP |
|
|
|
|
|
|
Memorizing everything by heart |
13.1 |
13.9 |
|
14.0 |
11.3 |
|
|
|
|
|
|
Understanding everything by reading |
52.9 |
55.6 |
|
54.0 |
49.2 |
|
|
|
|
|
|
Mode concept maps/ flow charts |
17.2 |
19.4 |
|
24.0 |
8.1 |
|
|
|
|
|
|
Made summaries |
28.4 |
36.1 |
|
28.0 |
21.0 |
|
|
|
|
|
|
Underlined printed materials |
33.4 |
36.1 |
|
40.0 |
24.2 |
|
|
|
|
|
|
Made notes separately |
35.6 |
30.6 |
|
44.0 |
32.3 |
|
|
|
|
|
|
Made notes in the margins |
15.2 |
8.3 |
|
26.0 |
11.3 |
|
|
|
|
|
|
Answered the Check your Progress |
3.9 |
5.6 |
|
20.0 |
16.1 |
|
|
|
|
|
|
Use of reference books |
7.1 |
0.5 |
|
2.8 |
|
|
|
|
|
|
|
Not specified |
2.9 |
2.8 |
|
2.0 |
4.0 |
|
|
|
|
|
|
Source: Field Data
225