

120
Chapter X
Improving the Usefulness of Learning Objects by Means of Pedagogy-Oriented Design
Giuliana Dettori
ITD-CNR, Italy
Paola Forcheri
IMATI-CNR, Italy
Maria Grazia Ierardi
IMATI-CNR, Italy
ABSTRACT
Learning Objects (LOs) are increasingly considered potentially helpful to improve teachers’ work and to spread innovation in the school system. Their technological roots, however, often make them scarcely appealing to the teachers. A key issue to tackle in order to boost their diffusion is to make them closer to actual teacher’s work by emphasising pedagogical aspects. To this end, the authors propose a typology of LOs that allows teachers to highlight differences in the pedagogical approach embedded in their productions, hence sharing not only content but also educational competence. Moreover, in order to allow re-user teachers to explicit and share the pedagogical experience gained while re-using some material, they suggest endowing repositories with ad hoc facilities, such as comments and itineraries related to the repository’s LOs. Comments would allow people to share narrations of experiences of use, while learning itineraries would point out logical connections of various kinds among small groups of LOs, hence helping the users overcome the content fragmentation induced by the granularity of LOs. These proposals are described and exemplified by drawing from our training experience.
Copyright © 2009, IGI Global, distributing in print or electronic forms without written permission of IGI Global is prohibited.
Improving the Usefulness of Learning Objects by Means of Pedagogy-Oriented Design
INTRODUCTION
Learning Objects (LOs) can result useful in education, by decreasing production costs, exploiting experience and saving time (Littlejohn et al. 2003). Not only are they a source of study materials, but can also give suggestions about teaching strategies (Chiappe Laverde et al. 2007). They can provide a valuable contribution to innovate education, because sharing good quality educational materials among a large number of peers can facilitate the circulation of good ideas (Malcolm2005).Beingabletofruitfullymakeuse of LOs, however, entails overcoming a number of issues of both conceptual and practical nature (Busetti et al. 2004a).
From a practical point of view, integrating didactical resources prepared by other teachers in one’s own lessons is not always straightforward, because it requires to work out connections to the new context of use. Even more work can be necessary for recycling, that is, making use of some elements for a different task. This holds true, in particular, for educational material on complex tasks, which, on the other hand, is what teachers are likely to be most interested in, since their preparation requires time and effort. Analogously, preparing educational materials suitable to be reused, that is, able to raise peers’ interest and easily adaptable to different learning situations, is a rather challenging task (Feldstein 2002, Griffith et al. 2007, Lehman 2007) entailing to split lessons into modules which are consistent and self-contained yet easy to articulate with each other.
From a conceptual point of view, difficulties are brought about by the fact that the concept of LO was initially created and worked out by technologistsratherthanbyexpertsineducation.This factisrelevant,becausetechnologistsandteachers have different focus and aims and often even use different technical languages (Friesen 2004, Ip et al 2001). As a consequence, the construction of LOs was seen as production of software more
than as production of learning and LOs resulted more fit to support presentations than to propose activitiesofconstructivenature.Metadata,which are key to retrieve and re-use LOs, were standardized (Anido et al. 2002, IEEE 2002) not much in line with the current didactical practice (Farance 2003), so that they comprise information which is of limited use from the didactical point of view, such as semantic density, and omit other which is relevant to re-use in real educational contexts, such as the pedagogical and epistemological choices underlying the development of materials. Moreover, standard international metadata did not result apt to take into consideration the peculiarities of national educational systems (Friesen et al. 2002). This limitations should not appear surprising, however, because the variety of needs and points of view that should be taken into consideration by online material makes it complex to devise a set of metadata able to combine simplicity of production with easiness of resource detection (Duval et al 2002).
These issues have been widely discussed over the last years. For instance, the need to endow LOs with metadata which express the underlying educational paradigm was pointed out (Alvino et al. 2007, Qin and Godby 2004), so as to allow teachers to retrieve LOs based on features that they usually take into consideration in their didacticalplanning.Approachestotheevaluationof pedagogicalmetadata,soastoverifytheirquality, have also been worked out (García-Barriocanal et al. 2007). Extensions of the current metadata standard were formulated, integrating or modifying the LOM based on the needs of some group of learners (see for example Alvino et al. 2008, Krull et al. 2006, Yahya and Yusoff 2008). Metadata application profiles including pedagogical descriptors that meet the needs of educators have also been proposed (i. e. Godby 2004). We recall forexampletheGatewaytoEducationalMaterials project(GEM,http://thegateway.org),aninitiative of the US Department of Education based on the DublinCoreMetadataStandard(http://dublincore.
121
Improving the Usefulness of Learning Objects by Means of Pedagogy-Oriented Design
org/). GEM introduces a metadata application profile for describing educational resources in a semantically rich way and with an accompanying set of controlled vocabularies (Qin and Paling 2001). GEM’s guiding principles and metadata form the basis for the proposal formulated by EdNA, a network of the Australian education and training community (Education Network Australia, http://www.edna.edu.au/).
Moreover, attention was given to the importance of certifying the quality of the materials included in a repository. A well known example in this respect is offered by Merlot (a repository for teachers of any subject of secondary school and higher education, which is accessible free of charge; see www.merlot.org), that provides a peer review for many of the LOs included in the repository(Vargoetal.2003).Anotherexampleis constituted by DLESE (www.dlese.org), the (free ofcharge)DigitalLibraryforEarthSystemEducation funded by the National Science Foundation, USA, aimed at supporting the teaching/learning of the Earth system. The resources that meet specific review criteria are included in the so-called DLESE Reviewed collection.
Finally, the importance to motivate and encourage teachers to use LO repositories was recognized, and some work was done to foster reflection on the applicability of shared materials and on the impact of using them within an educational plan. An early example in this direction is provided by the cited Merlot repository, which allows users to insert brief comments on a LO and proposals for activities with it.
Nevertheless, more work appears still necessary to turn LOs into real pedagogical resources frequently and fruitfully used by the teachers. As Minguillón (2007) points out, a variety of research studies would be necessary to advance the field, such as experimental studies, application of learning theories and pedagogical design guidelines,techniquesfordescribingpedagogical assumptions or hypotheses, and critical analysis of the ability by the standards to deal with the pedagogical perspective.
Our work on LOs aims to give a contribution to improve the exploitation of LOs in education. It develops along two directions:
•We propose a methodological approach to the design of LOs aiming to help teachers realize digital educational materials based onapedagogy-orienteddesign.Thisconsists in the proposal of a typology of LOs that allows one to distinguish among different kinds of educational materials and to point outtheunderliningpedagogicalorientation. It allows one to shape educational materials of constructivist nature in form of LOs and is therefore suited to support the development of complex tasks and address learning in complex domains (Busetti et al. 2007). It differs from other classification proposals e.g. Churchill 2007) in that it models a typology of LOs according to the perspective teachers usually adopt when preparing an educational plan.
•We propose to endow LO repositories with ad hoc communication facilities to allow teachers to share pedagogical experience besides materials, hence turning their activity with LOs into a learning experience. In our proposal, two kinds of item in particular are foreseen as object of exchange among teachers, that is, narrations of experience of use of LOs (Dettori et al. 2006) and the construction of articulated learning itineraries made by sequences of LOs (Busetti et al. 2008). Such communication channels aim to help the teachers reflect on their own pedagogical choices and construct digital learning materials consistent with their own educational aims and preferred teaching approach. They also aim to transform LO repositories into communities of teachers who learn from each other while sharing materials and experience (Busetti et al. 2006). Transforming repositories into learning communities of teachers is in line
122
Improving the Usefulness of Learning Objects by Means of Pedagogy-Oriented Design
with the results of several research studies, which suggest it as a viability factor to LO technology (Haughey and Muirhead 2005, Liber 2005).
In this chapter we describe our two proposals, pointing out their potential to improve the exploitation of the LO paradigm in education.
Devising a Typology of LOs
Adopting a Teacher’s Perspective in
the Design of LOs
In order to orient the design of LOs so as to include teacher’s perspective, we started from observing teachers’ behaviour. When planning an educational path on a complex task for a group of students, teachers initially devise an overall learning experience, based on the educational work already carried out by the students, as well as on the new contents to be learned and abilities to be acquired. Then, they organise the overall path in a number of educational modules, each focused on addressing a specific topic, by explaining a theory or assigning some applicative activity, often by making use of (traditional or technological) educational tools. Each of such modules aims to initiate a learning experience, and therefore embeds the educational objective and the pedagogical approach that the teacher considers most suitable for the learning situation at hand. Teachers usually plan to also make use of complementary materials of wide applicability, besides of the specific modules related to the considered task, such as dictionaries, glossaries, maps,etc..Thentheyorganisetheuseofanumber of tools - be they of conceptual nature or concrete ones - which appear necessary to support learners’ activity and their interactions with each other or with the teachers or other experts involved in the leaning experience. The more the considered
domain is complex, the more this conception of educational material appears useful.
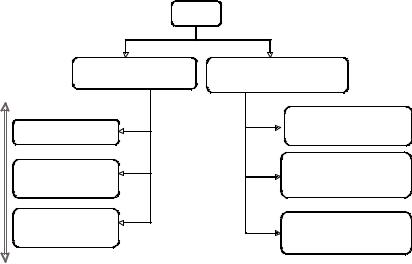
In order to implement this conceptual view by means of LOs, we thought that it would be necessarytoworkoutatypology,clearlydistinguishing task-related LOs from auxiliary materials, so as to mirror the articulated organization of work that experienced teachers usually set up. Such correspondence is shown in Figure 1.
This organization implies having at disposal LOs of two different types, depending on the characteristics of the educational modules they embody:
1.Structured LOs, corresponding to content modules with a clear pedagogical orientation;thesearebasedonapreciseeducational objective and must be further specified by determining their structure and didactical function.
2.Functional LOs, corresponding to auxiliary educational materials; these do not include a specific pedagogical orientation but rather haveawide-angleapproachthatmakesthem suitable to a variety of learning situations.
Structured LOs can make use of, or refer to, functional LOs, which correspond to materials necessary to carry out the proposed activities. This fact does not violate the principle that LOs should be self-contained, since functional LOs have a different nature and only contain auxiliary material that the user can substitute with analogous ones, or even eliminate, without much effort and without changing the nature of the activity. For instance, a structured LO could contain the indication “Use a glossary of terms in this field; one such glossary can be found at the address ...”. Obviously a re-user could well decide to use a different glossary or not to use one at all, if his/her students have already a good knowledge of the necessary terms, and this fact does not affect the validity of the structured LO including this refer-
123
Improving the Usefulness of Learning Objects by Means of Pedagogy-Oriented Design
Figure 1. Correspondence between conceptual and technological elements involved in a complex learning activity
Educational |
|
|
Technological |
|
conception |
|
|
||
|
|
environment |
||
|
|
|
|
|
Educational |
|
Activity |
Activity |
|
choices |
|
Planning |
Management |
|
Overall |
|
|
|
|
realisation |
Tools |
Pedagogical |
Structured |
Technological |
|
modules |
LOs |
resources |
|
|
|
|||
Helps to learn |
of |
Auxiliary |
Functional |
|
general nature |
|
|
||
|
|
material |
LOs |
|
ence. On the other hand, it is correct to consider auxiliary modules as LOs, because they actually are self-consistent learning materials with a clear educational purpose.
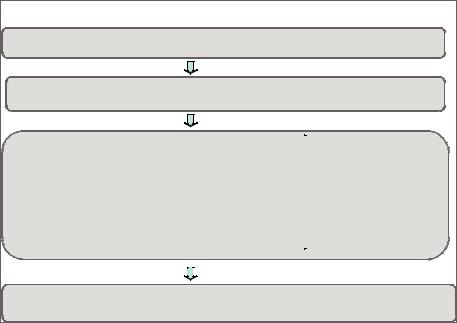
These two types of LOs are, in turn, divided into different subtypes, according to their nature and function, as shown in Figure 2.
Functional LOs can be of three main types, that is:
1.general-purpose, whose content may be relevant in many modules of an articulated courseofstudies;examplesaredictionaries, maps, templates, etc.;
2.content-dependent, containing material for deepening some particular content; these includepresentations,glossaries,assessment modules, references, etc.;
3.activity-oriented, suitable to guide the students to carry out activities related to the learning of some topic by supporting the acquisition of ‘soft skills’, that is, interdis-
ciplinarybehaviouralandrelationalabilities that influence the interaction with others.
The different forms that Structured LOs can take mirror the fact that teachers can decide to vary the educational approach to a given task, from teacher-directed to learner-directed, based on the specificities of the situation at hand, such as students’ competence and maturity or the importance of the addressed topic within the global learning path. This possible diversification led us tointroducethefollowingcharacterizationofeducational modules, and correspondent Structured LOs, based on their didactical aims:
1.Guided LOs, corresponding to modules guidedbytheteacher.Inthiscase,thecontrol of the activity initially relies mostly on the teacher and gradually passes to the students while they increasingly gain ability. Such modulesaimtointroducecontentknowledge or some basic approach to problem solving.
124
Improving the Usefulness of Learning Objects by Means of Pedagogy-Oriented Design
Figure 2. The proposed typology of LOs
L O
S tructured L O: E mbedding a s pecific pedagogical view
C ontrol to the teacher
Objectivis t des ign: teacher guided L O
Integrating objectivis m and cons tructivis m : mixed L O
(S ocio) C ons tructivis t des ign: problem oriented L O
C ontrol to the learner
F unctional L O: R esources complementing the development of the educational activities
Working material of general us e, helping to tackle s pecific tasks (e.g. glossa ries )
C ontent-dependent material (e.g. references , tables of data)
G uides to facilitate s uggested activities (e.g. guidelines to organise group activity )
In this case, teaching and learning are very structured, even when they entails a good amount of students’ activity.
2.ProblemLOs,correspondingtomodulesorientedtoautonomousexploration,wherethe controlisstronglydemandedtothestudents (individually or in groups). In this case, a problem situation is proposed. Modules of this kind are based on questions addressing some activity necessary to solve the given problem,aswellasonmaterialsandtoolsrelevant in the activity assigned. Here the work evolution can not be completely planned a priori, nor can it easily be evaluated with traditional methods. This approach is suitable when students have already acquired a basicpreparationthatallowsthemtoworkon problems without much teacher’s guidance. They aim to develop higher level cognitive abilities,aswellastosupportmetacognition and autonomous learning.
3.MixedLOs,correspondingtomodulesbased on a mixed approach, combining teacher guidance and autonomous exploration.
These represent a merge of the kind of activities and guidance that characterize the previoustwotypes.Usuallydifferentmixed LOs are possible for a same kind of activity, with a focus closer to teacher’s guidance or to student’s autonomous work.
Examples of Structured LOs
The choice whether to use a Problem LO or a Guided LO depends on the educational aim. A same learning content may be proposed by means of either of them, based on the pedagogical approach that a teacher considers most suitable in the learning situation at hand.
This is exemplified by the following LOs, which are both addressed to students of educational design and aim to make them aware of the issues to tackle when deciding a course organization (e.g. choosing whether to offer a course completely online, or in presence, or finding a satisfactory blending of these two delivery modes). This task is not trivial, since the considered problem has more than one possible
125

Improving the Usefulness of Learning Objects by Means of Pedagogy-Oriented Design
solution; the process to find a satisfactory one can notbestraightforwardlyexpressedinalgorithmic way and implies considering a number of context variables, such as the background of the expected participants, their socio-cultural-economical situation, the type of content, the technological infrastructures at disposal, etc.. The complexity of this task motivates the need to create LOs of different kinds to be proposed to students with different levels of expertise. In both cases, it is necessary that students become aware that different problem situations are possible and become able to analyse them. They must learn to look for relevant variables and reflect on their impact and possible interaction in the situation at hand. The necessary guidance and work organization, however, differ according to the students’ expertise level.
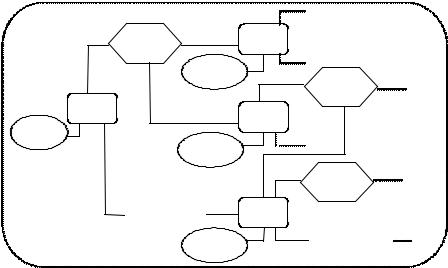
If the students are at the beginning of their workinthisfield,andhavenopracticalexperience, much guidance is necessary to help them observe
Figure 3. An example of Guided LO
how experts reason on this kind of problems. Hence, we will make use of a Guided LO, like the one sketched in Fig. 3. At the beginning, the teacher gives a general idea of the situation and motivates the problem. The second phase is then devoted to observation and reflection. A narrative presentation of a case of study is provided (e.g., a movie showing a group of experts discussing pros and cons of possible course organizations), then the students are asked to spot the main points considered by the experts, as well as to compare and discuss their points of view on this matter. The aim of this phase is to develop analytical skills, rather than to acquire some procedure to tackle this kind of problems, since it is obviously not possible to acquire problem solving ability on complex tasks just by observing one group of experts. In the next phase, documents used by the experts to analyse the considered case are given, such as minutes of meetings, data and documents used, simulations, etc., and students are asked
Dis cus s ing pro and cons of pos s ible cours e organizations :G uided L O
P has e 1.
Motivation and O utline of the activity
Orientation and focus ing
P has e 2.
Obs ervation and reflection
P has e 3.
G uided analys is
P has e 4.
S ynthes is
P has e 5.
R evis ion and E valuation
A narrative presentation of the case is provided (e.g., a m ovie showing a group of experts discussing pros and cons of possible course organizations ).
Activity 1: Students, divided in sm all groups, are asked to spot the m ain points considered by the experts.
Activity 2: S m all groups join to share their points of view and write a com m on report. Teacher˜s support: written questions to address the work; m oderation of the discussion .
Material used by the experts to analyse the case is given: m inutes of m eetings, data and docum ents used, sim ulations, etc.
Activity 1. G roups are asked to understand what m aterial was used to take decisions , and how .
Activity 2. Discussion am ong groups. Construction, with teacherÕs support, of a shared docum ent sum m arizing the view s of all groups , explaining motivations .
Teacher˜s support: written questions to address the work; m oderation of the discussion ; help to prepare the written synthesis.
Activity: Position taking, argum enting the choice .
P resentations to illustrate of the various position. Report on the activity
126
Improving the Usefulness of Learning Objects by Means of Pedagogy-Oriented Design
Figure 4. An example of Problem LO
Dis cus s ing pro and cons of pos s ible cours e organizations : P roblem L O
P has e 1. Orientation and focalis ation
P has e 2.
S etting the s cene
P has e 3.
Working out pos s ible s olutions
Defining a working methodology
S electing data and tools
Devis ing, evaluating, comparing s olutions
P has e 4.
R evis ion and reflection
Explaining of the kind of work to be carried out
Illustrating the scenario
Defining the problem
Teacher˜s s ugges tions |
S tudents ˜ activities |
||
O rganising the work |
Making an agenda of the w ork to do |
||
Searching for useful data and m aterial |
Monitoring work developm ent |
||
Recalling analogous situations |
Using data and tools to devise solutions |
||
Spotting the m ain variables |
Form ulating problem s to analyse |
||
Analysing variables Õinterplay |
Discussing possible solutions |
||
Analysing adequacy of solutions |
Taking positions |
||
|
|
|
|
|
|
|
|
|
|
|
|
Com menting positions
Reporting on the activity
to try to understand in which way each material was used. Points of view are again shared and compared. In both Phases, the teacher supports the activity by providing questions to address the work, moderating the discussion, helping to prepare the written synthesis. Finally, in the last two phases students are requested to take a position, justifying their choices, and to make a presentation on it.
Figure 4, on the other hand, shows the structure of a Problem LO on the same topic. Here, the activity consists of only 4 phases, where the third and most important one must be carried out essentially autonomously. Initially the teacher explains the kind of work to be carried out (Phase 1), then defines the problem and illustrates the scenario (Phase 2). In Phase 3 the teacher gives a number of suggestions on how to proceed and the students carry out the work, partly autonomously or divided in small groups and partly with the whole class, making an agenda of the work to do, monitoring its development, formulating
problemstoanalyse,usingdocumentsandtoolsto deviseasolution,discussingpossiblesolutionsand taking positions. Finally, choices are presented, motivated and discussed.
Both kinds of LOs appear to be necessary to build articulated educational paths, because the first one helps the students build experience by observing and analysing, in a structured way, expert’s behaviour, while the second allows the students to become aware of the acquired competence and test their ability on practical problems. Such alternation is very important in complex domains, where solving problems is not simply a matter of applying rules and algorithms to new data, but rather requires to learn how to reason within the constraints of the considered field. Limiting a course’s proposal to Guided LOs would negatively influence students’ self confidence and ability to work autonomously, while assigning Problem LOs to beginners would give risetodisorientationanddiscouragement,oreven to serious damages, as in the example on robot’s
127
Improving the Usefulness of Learning Objects by Means of Pedagogy-Oriented Design
unexpected behaviour described in a previous paper (Busetti et al. 2007) in relation with telepresence courses on mechatronics.
Shariig Pedagogical xppertise in LO Repositories
Paying attention to pedagogical aspects while designing LOs is important to convey the producer’s teaching aims and experience. It can not help, however, to highlight the knowledge and competence generated through re-use. This, on the other hand, could be an important source of learning for all teachers involved, because reuse helps highlight differences in points of view and teaching approaches, hence possibly helping materials’ authors to gain a different perspective ontheirownwork.Re-users’experiencecanobvi- ously not be directly included in LOs, but it can be saved in repositories, as materials associated to LOs, so as to be always at the disposal of all users, thus enriching the value of the repository’s globalpedagogicaloffer.Tothisend,wedesigned and implemented the prototype of a repository enriched with communication facilities, LODE (Learning Object Discussion Environment) (Busetti et al. 2006). Besides a number of forums to discuss issues of general educational nature or related to individual LOs, this environment offers re-users two features to share pedagogical experience, that is, comments to share narrations ofuseexperiences,anditinerariestodescribehow to build articulated learning paths by sequencing a number of LOs. The importance of these two facilities is discussed below, together with the realisation made in the LODE environment.
Sharing Experiences of Use
From a pedagogical point of view, re-use of educational materials should be focused not only on products but also on experiences of use in different contexts (Busetti et al. 2004a). Thanks to
re-use, LOs are not seen as static materials (as in a purely technological view of re-use) but rather as something constantly in evolution, since each experience of use differs from the others depending on the situation where it takes place, the learners’ involved and the teachers’ pedagogical orientations and teaching approach.
Hence, two different kinds of knowledge constitute the re-use process of a given educational material:
1.The educational material themselves, with the initial intentions of the producers and possibly hints to guide prospective re-us- ers. This knowledge should be organised so as to lead the users to reflect on their own educational view, make comparisons with the view of the initial producer, highlight analogies and differences among various intentions.
2.The experience deriving from the use of the material,bytheproducerher/himselfandby other teachers, expressed by means of narrations of such experiences and reflections on them. These should not be considered as optional appendices to the educational materials, but keys to stimulate teachers’ reflection, and therefore should be included in the repositories as well.
Reflecting on differences among use experiences carried out with a same material can constitute for the teachers a learning opportunity and a powerful tool for professional development. This can result useful also to the material’s producer, since it leads her/him to take into consideration different perspectives on her/his own work. In this view, re-use constitutes a knowledge transfer process in which both user and producer can actively take part, with mutual advantage.
Such activity can also constitute a good basis for the creation of communities of teachers engaged in learning from each others’ experience while sharing educational material, and can help
128
Improving the Usefulness of Learning Objects by Means of Pedagogy-Oriented Design
building and circulating pedagogical innovation. It can improve the cohesion within teachers’ communities,helpingtoovercometheproblempointed out by Parr and Ward (2005) of teachers feeling scarcely inclined to share their own productions if they don’t perceive the participation in a community of practice as useful and rewarding.
Learning Itineraries
Aproblemthatcontributestolimittheappreciation of LOs by school teachers is content fragmentation. Being atomic materials, i.e. self-contained andaddressingasingletopic isanessentialfeature of LOs, which determines their possibility to be re-used across different learning situations and to be adapted to a variety of educational needs. In schoolteaching,however,itisextremelyimportant to construct knowledge as a connected whole, since only in this condition students can become effective problem solvers. It is not by chance that teachers often plan their activity in the form of itineraries rather than of single lessons.
Building articulated paths by extracting LOs from a repository is not always easy, since detecting LOs which are related and consistent as concerns both topic and pedagogical approach is often a complex task. Without suitable cues, teachers may end up to limit their choice to some materials and build other modules on their own, in order not to spend too much time looking for suitable contributions.
Studies analyzing the practical difficulties of teachers in using a repository for the construction of learning itineraries are still limited. Some indications in this respect may be obtained by a few studiesonwhatcharacteristicsofarepositorysupport teachers to integrate LOs in their educational plans. For instance, Recker et al. (2004), through theanalysisofthebehaviourofagroupofteachers dealing with a repository, try to detect teachers’ motivation in using online resources, what barriers they perceive, what strategies of search and selection they use, how they adapt the resources
at disposal for teaching and for autonomous training, what functions they expect to find in digital resources. This study suggests that guaranty of quality, peers’ positive opinion and a materials’ organization that responds to educational needs are key points for teachers’ satisfactory use of a repository. Christiansen & Anderson (2004), on the other hand, focus on benefits and issues associated with the creation of courses entirely from available LOs, by analyzing the results of three case studies. The outcomes of their experience show that quantity and quality of material is an essential condition, while heterogeneity of material constitutes a difficulty.
Quantity and quality are very important features, but, in our opinion, are not sufficient. In order to help users to build meaningful itineraries itisnecessarythatconceptualconnectionsamong LOs are explicitly specified in repositories and that materials can be retrieved efficiently and effectively. It would be very useful, moreover, to store in repositories also itineraries constructed by teachers with the repository’s materials, so as to offer examples and suggestions. Itineraries should not be mere lists of LOs, but possibly include pedagogical ideas to help shaping a whole from several disjoint pieces.
Itinerariesareactuallyawaytosharepedagogical competence and experience connected with the use of LOs, as much valuable as the narration of use experiences. Devising educational itineraries may be an important component of teacher training on the use of LOs in that it can helped understand from an operative point of view the pedagogicalcompetencenecessarytosuccessfully deal with LOs (Busetti et al. 2008).
A Repository Oriented to Sharing Pedagogical Competence
The possibility to share experiences of use and itineraries related to each LO are implemented in the LODE’s repository. Figure 5 shows the home pageofaLO.ItshowsthenameoftheLOfollowed
129

Improving the Usefulness of Learning Objects by Means of Pedagogy-Oriented Design
Figure 5. The home page of a LO in LODE. Experiences of use and Itineraries are listed on the left hand side
Figure 6. An example of learning itinerary as specified in LODE
by the metadata and by a list of links pointing to LOs which are conceptually connected with it according to the LO’s author. Experiences of use (named “comments”) and itineraries available for this LO are listed on the left hand side.
Comments to any LO in the repository can be added by any user. They take the form of texts freely structured by their authors. Itineraries, on the other hand, are described by specifying information of several kinds, namely objectives, content, target population, LOs used, time re-
quired,development,necessarytools,pedagogical approach (see Fig. 6). The names of the LOs are clickable, to facilitate their retrieval. When a user adds an itinerary for a LO, the same itinerary is automatically associated to all LOs mentioned in it. Any user can add itineraries even if he/she is not the author of any of the LOs included.
With the addition of these two features, the knowledge shared within the repository results composed by items of three different kinds, as depicted in Fig. 7.
130
Improving the Usefulness of Learning Objects by Means of Pedagogy-Oriented Design
Figure 7. Organization of LODE’s shared knowledge. LOs are connected by semantic relations and complemented by comments and educational itineraries, that represent the pedagogical knowledge arising from re-use
Shared Knowledge
|
Educational |
LO |
|
Itinerary |
|
|
Experience |
|
|
of use |
Educational |
|
|
|
|
|
Itinerary |
|
LO |
LO |
|
|
|
Experience |
|
|
of use |
Experience |
|
|
|
|
|
of use |
|
|
|
Educational |
|
|
Itinerary |
|
Semantic relation |
LO |
|
Experience |
Semantic relation |
|
of use |
|
CONCLUSION
TheideaofLOemergedfromtraditionalsoftware design approaches with the aim to propose effective and economical strategies to manage and re-use resources in networked environments. Its technological roots initially led to pay attention moretotechnologicalfeaturesthantopedagogical ones, which limited teachers’ enthusiasm in this respect. Introducing pedagogical elements in the design of LOs and of repositories could improve this situation, hence making LOs closer to the actual work of teachers and spreading their use in the school besides then in networked learning. Our work on LOs aims to give a contribution in this direction.
We suggest to improve LOs and repositories by means of pedagogy-oriented design. As concerns LOs, we propose to rely on a typology able to highlight the pedagogical intentions and teaching approach of LO’s authors. As concerns repositories, we propose to store not only LOs
but also reports of use experiences and learning itineraries based on LOs, so as to capture and share the pedagogical experience of re-users, in addition to that of authors.
Emphasising pedagogical aspects can make the use of LOs more interesting and useful for the teachers, overcoming the mono-directional view oftechnology-orientedre-use.Whenpedagogical experience is shared, engaging in a re-use activity can be an effective and powerful approach to teachers’professionaldevelopment,helpingthem to learn from each other’s experience.
REFERENCES
Anido, L. E., Fernandez, M. J., Caeiro, M., Santos J. M., Rodriguez, J. S., & Llamas, M. (2002). Educational metadata and brokerage for learning resources. Computers & Education, 38, 351-374.
Alvino, S., Forcheri, P., Ierardi, M. G., & Sarti, L. (2007). Describing learning features of reus-
131
Improving the Usefulness of Learning Objects by Means of Pedagogy-Oriented Design
able resources: a proposal. Int. Journal of Social Science, 2(3), 156-162.
Alvino, S, Forcheri, P., Ierardi, M. G., & Sarti, L. (2008). A general and flexible model for the pedagogical description of learning objects. In M.Kendall & B. Samways (Eds.), Learning to Live in the Knowledge Society. Series: IFIP International Federation for Information Processing, Vol. 281. Springer.
Busetti, E., Forcheri, P., Ierardi, M. G., & Molfino, M. T. (2004a). Repositories of learning objects as learning environments for teachers. Proc. of ICALT 2004, IEEE Computer Society, (pp. 450-454).
Busetti, E., Dettori, G., Forcheri, P., & Ierardi, M. G. (2004b). Guidelines towards effectively sharableLOs,ICWL2004.LectureNotesinComputer Science, 3143, 416-423. Springer-Verlag.
Busetti, E., Dettori, G., Forcheri, P., & Ierardi, M. G. (2006). Promoting teachers collaborative re-use of educational materials. Lecture Notes in Computer Science, 4227, 61-73. Springer.
Busetti, E., Dettori, G., Forcheri, P., & Ierardi, M. G. (2007). A pedagogical approach to the design of learning objects for complex domains.
International Journal of Distant Education Technologies, 5(2), 1-17.
Busetti, E., Dettori, G., Forcheri, P., & Ierardi, M. G. (2008). From LOs to educational itineraries: Helping teachers to exploit repositories. In H. Leung, F. Li, R. Lau, & Q. Li, (Eds.), Advances in Web Based Learning - 6th International Conference, Revised Papers, Lecture Notes in Computer Science, 4823, 496-507.
Chiappe Laverde, A., Segovia Cifuentes, Y., & Rincón Rodríguez, H. Y. (2007). Toward an instructional design model based on learning objects. Educational Technology Research and Development, 55(6), 547-683.
Christiansen, J., & Anderson, T. (2004) Feasibility of Course Development based on learning objects: Research analysis of three case studies.
Int. Journal of Instructional Technology and Distance Learning, 1(2).
Churchill, D. (2007). Towards a useful classification of learning objects. Educational Technology Research and Development , 55(5), 479-497.
Dettori, G., Forcheri, P., & Ierardi, M. G. (2006). Endowing LOs with a social dimension. In Advances in Web based Learning (ICWL 2006), W. Liu, Q. Li, & R. W. H. Lau (Eds.), Lecture Notes in Computer Science 4181, 189-202. Berlin/Heidelberg: Springer.
Duval, E., Hodgins, W., & Weibel, S. L. (2002).
Metadata Principles and Practicalities. D-lib Magazine,8(4),http://www.dlib.org/dlib/april02/ weibel/04weibel.html.
Farance F. (2003). IEEE LOM Standard Not Yet Ready For “Prime Time”. Learning Technology, January 2003, http://lttf.ieee.org/learn_tech/issues/january2003/index.html.
Feldstein, M. (2002). Tutorial: How to design recyclable learning objects. e-Learn Magazine, 7. http://elearnmag.org/.
Friesen N. (2004). Some objections to learning objects. In R. McGreal (Ed.), Online education usinglearningobjects(openandflexiblelearning)
(pp. 59-70). London: RoutledgeFalmer.
Friesen, N., Mason, J., & Ward, N. (2002). Building Educational Metadata Application Profiles. In Proc. Int. Conf. on Dublin Core and Metadata for e-Communities, Firenze University Press, 63-69.
García-Barriocanal, E., Sicilia, M.-A., & Lytras, M. (2007). Evaluating pedagogical classification frameworks for learning objects: A case study. Computers in Human Behavior, 23(6), 2641-2655.
132
Improving the Usefulness of Learning Objects by Means of Pedagogy-Oriented Design
Griffith, J., Stubbs, G., & Watkins, M. (2007). From course notes to granules: A guide to deriving Learning Object components. In Computers in Human Behavior, 23(6), 2696-2720.
Godby J. (2004). What Do Application Profiles Reveal about the Learning Object Metadata Standard? Ariadne, 41, http://www.ariadne.ac.uk/.
Haughey, M., & Muirhead, B. (2005). Evaluating Learning Objects for Schools. E-Jist, eJournal of instructional Science and Technology, 8(1), http://www.usq.edu.au/e-jist/.
IEEELearningTechnologyStandardsCommittee (2002). Learning Object Metadata. Final Draft Standard, IEEE 1484.12.1-2002 http://ltsc.ieee. org/wg12/20020612-Final-LOM-Draft.html.
Ip, A., Morrison, I., & Currie, M. (2001). What is a learning object, technically? Proceedings of WebNet2001.
Krull, G. E., Mallinson, B. J., & Sewry, D. A. (2006). Describing online learning content to facilitate resource discovery and sharing: the development of the RU LOM Core. Journal of Computer Assisted Learning, 22(3), 172-181.
Liber, O. (2005). Learning objects: conditions for viability.JournalofComputerAssistedLearning,
21(5), 366-373.
Littlejohn, A. (ed.) (2003). Reusing on line resources: a sustainable approach to e-learning. Kogan Page, London.
Lehman R. (2007). Learning object repositories.
New directions for adult and continuing education, 113, 57-66. Spring 2007. Wiley Periodicals, Inc.
Malcolm, M. (2005). The exercise of the object: issues in resource reusability and reuse. BJET
- British Journal of Educational Technology, 36(1), 33-42.
Minguillón, J. (2007). Education and pedagogy with learning objects and learning designs. Editorial, Computers in Human Behavior 23(6), 2581-2584.
Parr, J. M., & Ward, L. (2005). Creating Online Professional learning Communities: A Case of Cart before Horses. In K.-W. Lai (Ed.), E-learn- ing Communities – Teaching and learning with the Web, (pp. 11-134). Dunedin, NZ: University of Otago Press.
Qin, J., & Godby, C. J. (2004). Incorporating EducationalVocabularyinLearningObjectMetadata Schemas. In Research and Advanced Technology for Digital Libraries, LNCS 2769/2004, Berlin: Springer, (pp. 52-57).
Qin,J.,&Paling,S.(2001).Convertingacontrolled vocabulary into an ontology: the case of GEM., Information Research, 6(2) http://InformationR. net/ir/6-2/paper94.html.
Recker, M. M., Dorward, J., & Miller Nelson, L. (2004). Discovery and use of Online Resources: Case Study Findings. Educational Technology and Society, 7(2), 93-10.
Vargo,J.,Nesbit,J.C.,Belfer,K.,&Archambault, A. (2003). Learning object evaluation: Computer mediated collaboration and inter-rater reliability. Int.l Journal of Computers and Applications,
25(3), http://www2.cstudies.ubc.ca/~belfer/Pa- pers/202-1335.pdf.
Yahya, Y., & Yusoff, M. (2008). Towards A Comprehensive Learning Object Metadata: Incorporation of Context to Stipulate Meaningful Learning and Enhance Learning Object Reusability. Interdisciplinary Journal of E-Learning and Learning Objects, 4, 13-48.
133
134
Chapter XI
Adaptive Animation of Human
Motion for E-Learning
Applications
Frederick W.B. Li
University of Durham, UK
Rynson W.H. Lau
University of Durham, UK
Taku Komura
University of Edinburgh, UK
Meng Wang
University of Durham, UK
Becky Siu
City University of Hong Kong, Hong Kong
ABSTRACT
Human motion animation has been one of the major research topics in the field of computer graphics for decades. Techniques developed in this area help present human motions in various applications. This is crucial for enhancing the realism as well as promoting the user interest in the applications. To carry this merit to e-learning applications, we have developed efficient techniques for delivering human motion information over the Internet to collaborating e-learning users and revealing the motion information in the client machines with different rendering capability. Our method offers a mechanism to extract human motion data at various levels of detail (LoD). We also propose a set of importance factors to allow an e-learning system to determine the LoD of the human motion for rendering as well as transmission, according to the importance of the motion and the available network bandwidth. At the end of the paper, we demonstrate the effectiveness of the new method with some experimental results.
Copyright © 2009, IGI Global, distributing in print or electronic forms without written permission of IGI Global is prohibited.
Adaptive Animation of Human Motion for E-Learning Applications
INTRODUCTION
Human motion animation (Badler, Palmer, & Bindiganavale, 1999) has been incorporated in varieties of applications, such as engineering simulation, virtual conferencing, gaming, military, and education. It can play different roles in the applications. More specifically, as a major supporting role, it helps present certain motions, such as dance performance of the main virtual human characters in an application. This kind of animation must be done in significant fine detail to allow users to have a good understanding of the motionofthevirtualhumancharacters.However, doing this would need to involve complicated and costly computations, which may not be able suitable for real-time applications. On the other hand, as a minor supporting role, human motion animation helps reveal motions of supporting characters.Forexample,itmayanimatethecrowd in an evacuation training application. The level of detail of animation of this type may be decreased without affecting how the users to perceive the motion of the crowd. Although the computation workload for animating an individual virtual charactermaybegreatlyreducedinthissituation, applications may still incur high computation work if one needs to animate a large amount of virtual characters at the same time.
Withthedramaticimprovementinnetworking capabilities and the possible consolidation of rich learning resources over the Internet, e-learning has been admired as a very useful learning environment. It offers remarkable features, which are hardly found in the traditional learning environment. First, unlike traditional learning that requires students to gather at a specific time and place to attend a lesson, e-learning allows students at different geographical locations to join a lesson without physically traveling there. Second, e-learning allows the consolidation and distribution of e-learning contents from a vast amount of Internet Web sites to students. Third, e-learning natively supports the presentation of
various types of media, such as 3-D graphics, animation, and sound, to help students visualize and understand concepts in an easier way. For example,Canós,Alonso,andJaen(2004)propose a multimedia-enabled emergency evacuation training system for an underground metropolitan transportation environment. The system makes use of text, images, audio, video, and simple 3-D graphics to construct the user interface and present evacuation training materials. Results show thatsuchanarrangementcouldimprovestudents’ understanding on complex procedures.
To further enhance the interactivity of the learning environment and motivate the student participation, 3-D virtual environments with animation (Sims, 1995) would definitely be a crucial complement to the e-learning systems, suchastheemergencyevacuationtrainingsystem (Canós et al., 2004). The possible incorporation of such an environment would allow students to be actively trained in various emergency situations. While it is important for students to fully visualize the emergency situations and learn to respond to them interactively, it is also necessary for the instructors to be able to visually monitor the progress of the students from different angles inthevirtualenvironment.Despitethesebenefits, as we have discussed, 3-D animation, in particular when animating human motions, can be very demanding in terms of rendering. In addition, owing to the large size of the human motion data, the transmission of such data to the e-learning users over the Internet would induce a significant bandwidth consumption on the networks.
In this article, we present an adaptive human motion framework to support real-time rendering and transmission of human motions in e-learning systems. The rest of this article is organized as follows. The second section provides a survey on related work. The third section describes the foundation of 3-D-based e-learning systems.The fourth section shows the adaptive human motion framework in detail. The fifth section presents some experimental results of our method. Finally,
135
Adaptive Animation of Human Motion for E-Learning Applications
the sixth section concludes the work presented in this article.
RELATED WORK
Formulation of Human Motions
Anintuitivewaytoincorporatehumanmotionanimation in e-learning applications is key-framing (Burtnyk & Wein, 1976). This approach requires the animators to construct a virtual character to represent a human, and to define and draw key-frames of a motion sequence of the virtual character to be animated. However, manipulating and coordinating the limbs of a virtual character viakey-framingisacomplicatedandtedioustask. In addition, it is also difficult to produce realistic and natural looking motions with key-framing. To ease the construction process of human motions, we may alternatively make use of motion capturingdevices(Meyer,Applewhite,&Biocca, 1992) to acquire the movement of live objects and then apply the captured position and orientation information on virtual characters to drive their motions. This approach has been widely accepted in real-time applications as it helps to produce realistic and natural looking character animations. In general, regardless of which approach is being used, motion data is often large in size since it comprises a continuous data stream describing the spatial changes of all joints of each articulated figure. This likely poses a significant burden when we need to deliver the motion data over the Internet.
On the other hand, an animator may further edit and combine the motion sequences of a virtual character to create new motion sequences for use in different applications. Inverse kinematics (Wang & Chen, 1991), which is a process for computing the pose of a virtual character from a set of analytically constrained equations of motion, could be adopted to achieve physical
realism in motion editing. For example, Popović and Witkin (1999) suggest a variety of modifications to running and jumping motion data using a low resolution physical model to constrain the search space and trajectory optimization to generate physical realism in motion modifications, while Rose, Guenter, Bodenheimer, and Cohen (1996) propose a minimum energy solution for transitions between motion sequences using an inverse kinematics model.
Level of Detail of Human Motions
During a 3-D interaction, users normally have different perceptions on different objects in the application environment. Such differences could be evaluated from a set of viewing parameters (Lau,To,&Green,1997),includingviewer-object distance, viewer’s line of sight, viewer’s depth of field, and object moving speed. To take advantage ofthis,numerousmethodshavebeendevelopedto adjusttheLoDof3-Dgeometrymodels,behavior, and animation data to achieve better run-time performance for character animations.
In LoD of geometry models, a 3-D model of a virtual character could be simplified by various multi-resolution modeling methods (Hoppe, 1996; To, Lau, & Green, 1999). Most of these multi-resolution modeling methods construct an edge collapse sequence of a 3-D model to allow the model to be rendered with a selected number of polygons during run time. However, the simplification of a virtual character does not directly correspond to a simplification of its animation. In LoD of human animation, Endo, Yasuda, and Yokoi (2003) propose a framework to support the transmission of human motion data with different LoDs. In this framework, human motion data is modeled according to the H-Anim specification (H-Anim, n.d.), which allows a virtual character to be modeled in several levels of articulation (LoA), in which different LoAs of the virtual character comprise different
136
Adaptive Animation of Human Motion for E-Learning Applications
numbers of representative joints. To transmit the human motion data, the server determines an appropriate LoA of the virtual character for a client based on the importance of the figure and the available bandwidth of the client network connection. It then delivers only the motion data of the representative joints contained in the selectedLoAofthearticulatedfigure.However,this method does not consider the optimization of the motion sequence of each joint. In contrast, Naka, Mochizuki, Hijiri, Cornish, and Asahara (1999) consider this factor as the primary way to reduce the transmission workload of human motion data. This method proposes to choose only a subset of motion data of each joint for transmission. This is done by regularly discarding motion data of each joint over the motion sequence. However, without analyzing the characteristic of the motion sequence, the method may likely remove some important motion data. As mentioned in the previous section, since motion data is typically large in data size, the lacking of a good method for handling the transmission of human motion data would probably hinder the incorporation of character animations in Web-based applications, in particular, the e-learning applications.
Foundation of 3-D-Based
E-Learning Applications
E-learning has been admired to be a more interactive, intelligent, and collaborative learning environment as compared with the traditional learning platform. To further promote the usability of e-learning applications, 3-D-enriched learning materials and their supporting platform are urged to augment such applications. For instance, traditionally, a medical student needs to mentally process and correlate lots of MRI images to “visualize” possible defects of a patient’s internal organs. However, since techniques for constructing 3-D graphic models from the MRI
images have been available (Lorensen & Cline, 1987),thelearningprocessofthemedicalstudents could then be sped up significantly, as they are now able to visualize and understand medical problems in a straightforward way.
To implement a 3-D-based e-learning application, the retrieval and the delivery of 3-D e-learning content are considered as the primary features to be included; however, these are not trivial tasks. Typically, there may be a vast array of e-learning contents stored either at the e- learning server or over the Internet—an efficient retrieval technique should be developed to locate the relevant learning content to be delivered to the users who request the information. Another problem is the network bandwidth problem, as some users may be connected to the e-learning server with only a slow modem connection and others may use mobile devices for accessing e-learning materials. In Li and Lau (2006) we have developed a progressive content distribution framework to address the aforementioned issues; the framework helps transmit suitable quantity and quality of the learning content to the users. Experimental results show that the framework offers very impressive transmission performance for distributing geometric information of 3-D- enriched learning materials. We have also built an urban walkthrough system and a Moai study system to demonstrate the functionality of the framework.
Our progressive content distribution framework (Li & Lau, 2006) works well for 3-D-en- riched learning materials that do not involve any human motion. However, since human motion animation is crucial for some valuable e-learning applications,suchasadanceperformancetraining application or an evacuation training application, we therefore propose a new method in this article to augment our content distribution framework to cope with this need. Our method supports both real-time rendering and transmission of human motion information in e-learning applications.
137
Adaptive Animation of Human Motion for E-Learning Applications
ADAaTIVE HUMAN MOTIONS
Problem Issues
Incorporating human motion information in the e-learning applications is a challenging research problem.Incontrasttohandlingstatic3-De-learn- ing objects, which involve only a predefined set of geometry information including the object model definition and the texture images used, handling 3-D objects with human motion animation may be more demanding in terms of the amount of data involved and the dynamic nature of the data. For example, one may associate multiple motion sequencestoanobjectformotionanimation.Some motionsequencesmaydescribemotionsofvirtual charactersforaprolongedperiodoftime,resulting in a very large data size. Another demanding task istherenderingofhumanmotionontheclientside in e-learning applications, as it may incur timeconsuming, computation processes to reveal the motion of the 3-D objects to the users. To address these problems, our new method decomposes human motions into different LoDs and a metric to determine the appropriate LoD of the motion data for different parts of a virtual character. To maintain human motion information, our method makes use of the data structure as defined in the Biovision Hierarchy (BVH) data format (Lander, 1998), which is a character animation file format for storing the skeleton hierarchy as well as the motion informaiton.
Human Motion Decomposition
Technically, it is not an easy task to efficiently transmit human motion data over the Internet, particularly when a lot of virtual characters are involved, the data size of the human motion data would likely become very large. The motion data is ordered as a sequence of sets of key values. Each set of key values indicates the positions and orientations of individual joints of the virtual character at a particular frame. Although many
data compression methods are available, most of them could not handle human motion data efficiently. It is because motion data is represented byatime-dependentdatastreamofhierarchically defined and highly corelated spatial information. In addition, human beings are also very sensitive to sudden changes in human motion, which can be produced by compressing the motion data withgenericdatacompressionalgorithms.Onthe other hand, human motion may not necessarily be restricted to any regular patterns and sudden changes may appear in the motion data.
To address the aforementioned problems, we have developed a human motion decomposition mechanism based on wavelets analysis (Stollnitz, Derose, & Salesin, 1996). Wavelets are a mathematical tool for hierarchically decomposing data series into multiple LoDs using wavelets functions.Themajoradvantageofwaveletsisthat wavelets functions are local in nature. In other words, wavelets could describe data series with a relatively small number of wavelets functions. Hence, the transformed data representation of a data series by wavelets analysis is compact in data size. On the other hand, this also enables wavelets to describe any sharp changes appearing in the data series. Although wavelet analysis has been applied in many applications, such as image compression, it is relatively new in the area of human motion.
To perform human motion decomposition, we read the human motion data from the BVH file for each articulated figure. The motion sequence of each joint of a character is handled separately using wavelets analysis. We express the motion sequence of each joint, that is, cn=[cn1, cn2, ...cn2n+3] , as a linear combination of B-spline basis functions (Piegl & Tiller, 1995), where each cni in cn is assigned as the coefficient of the ith B-spline basis functions and n represents the highest possible LoD of a joint. As B-spline basis functions are semi-orthogonal, this provides a sufficient condition for us to fit the human motion data into the wavelets analysis process. After execut-
138
Adaptive Animation of Human Motion for E-Learning Applications
ing wavelets analysis, we could obtain a coarse representation and a set of refinement records for the human motion data. To this motion data, we first distribute the coarse motion representation of the required virtual character to the client machine. The system may then refine the animation quality of the virtual character by sending more refinement records of the motion data to the user under the control of our proposed metrics.
When animating a virtual character, if only a subset of the motion data of a virtual character is madeavailableattheclientmachine,theanimation quality of the character may be deteriorated. To remedy this, we use B-splines to interpolate the low resolution motion data to generate a smooth motion path. In our implementation, for each joint of a virtual character, we use a cubic B-spline curve to interpolate the motion sequence of the joint. The choice of a cubic degree of B-splines is for its simplicity in run-time computation and the ability to provide smooth interpolation of the motionsequence.Anotherimportantcontribution of applying B-spline interpolation is to ensure that the transition of human motion from one LoD to the next could be presented smoothly to the users.
Determination of Animation
Quality
When animating a virtual character, different parts of the character may have different importance values depending on the application as well as on the view parameters of the viewer. For example, the wrist joint of a virtual character may play a more important role and have a higher visual importance in a punching motion than in a pure walking motion. For an e-learning training system to adjust both the transmission and the rendering qualities of human motion data, we consider the motion performed by the virtual character and the possible contribution of the character to the user attention (Treisman & Gelade, 1980). We model these factors by joint
importance and visual importance, respectively. They are considered as the primitive parameters to construct the metric for selecting the level of decomposition of the human motion data. The details are depicted as follows:
Joint Importance
This parameter measures the importance of each joint of a virtual character by analyzing the human motion data acquired from the BVH file. Given a motion sequence, we compute the accumulated motion difference for each joint across the sequence. We then determine the degree of influence of a joint by evaluating the ratio of the accumulated motion difference of the joint against the maximum accumulated motion difference among all joints of the virtual character. Finally, we normalize the degree of influence of a joint by the LoD of the motion data of this joint received by a client machine to yield the joint importance.
Visual Importance
To model the importance of a virtual character to a viewer, we measure the following dynamic view parameters of the viewer relative to the character:
1.Distance of the virtual character from the viewer, D. It is obvious that virtual characters closest to the viewer could be visualized more clearly by the viewer than thosevirtualcharacterslocatedfartheraway from the viewer. So, the closer a virtual character is to the viewer, the higher its visual importance value.
2.Viewing direction of animating virtual
characters from the viewer, Mo. We notice that the motion details of a virtual character will be more visible to the viewer if the movement direction of the character is perpendicular, instead of parallel, to the
139
Adaptive Animation of Human Motion for E-Learning Applications
viewing direction of the viewer. We can take advantage of this and compute the visual importance of a virtual character according to the orientation of its motion plane with respect to the viewing direction of the viewer.
We may now compute the visual importance of a virtual character according to the previous view parameters as follows:
Visual Importance = wD D+wM M
where wD and wM are the weights for the distance factor and for the motion plane orientation factor, respectively.
Results and Discussions
We have conducted experiments to evaluate the performance of our approach on data error and smoothness of transition.
Experiment 1—Data Error
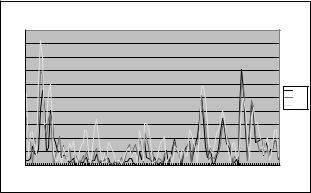
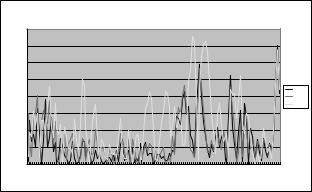
In this experiment, we have performed a walking animation. The animation consists of 131 frames and is rendered at 30 frames/second. We examine the joint with the highest total movement. Table 1
Figure 1. Data error rate of left up arm in z axis
records the accumulated movement of each joint within the whole animation sequence. From the table, we can see that the Left Up Arm has the highest total movement and hence, we examine this joint here.
Figures 1 to 3 illustrate the data error rate of the Left Up arm in x, y, and z axes. For the legend shown on the right hand side of each chart, C7 refers to motion of highest detail, that is, the nondecomposed motion. C6, C5, and C4 refer to the motions after one, two, and three levels of wavelets decomposition, respectively. In our implementationwestorethejointpositions/orientations in polar coordinate, that is, we represent each value by two angles in order to reduce the storage requirement of the motion data. Hence, the error of each joint is expressed in terms of degrees.
From Table 2, we could see that for the Left Up Arm (with the highest accumulated joint movement), the average data error for C6 is no more than 2.5 degrees, for C5 it is less than 2.8 degrees, and for C4 it is less than 3.7 degrees. This result is very encouraging. As the maximum error is less than 3.7 degrees, the user would not easily notice the difference. As a comparison, the data error for (Naka et al., 1999) can reach as high as 8 degrees. Therefore, we are about 1.2 times better than their method.
|
|
|
|
|
|
|
|
|
|
|
|
Left Up Arm Z Error |
|
|
|
|
|||||
|
20 |
|
|
|
|
|
|
|
|
|
|
|
|
|
|
|
|
|
|
|
|
|
18 |
|
|
|
|
|
|
|
|
|
|
|
|
|
|
|
|
|
|
|
|
|
16 |
|
|
|
|
|
|
|
|
|
|
|
|
|
|
|
|
|
|
|
|
|
14 |
|
|
|
|
|
|
|
|
|
|
|
|
|
|
|
|
|
|
|
|
|
12 |
|
|
|
|
|
|
|
|
|
|
|
|
|
|
|
|
|
|
|
C7-C6 |
Error |
|
|
|
|
|
|
|
|
|
|
|
|
|
|
|
|
|
|
|
|
|
10 |
|
|
|
|
|
|
|
|
|
|
|
|
|
|
|
|
|
|
|
C7-C5 |
|
|
8 |
|
|
|
|
|
|
|
|
|
|
|
|
|
|
|
|
|
|
|
C7-C4 |
|
|
|
|
|
|
|
|
|
|
|
|
|
|
|
|
|
|
|
|
|
|
|
6 |
|
|
|
|
|
|
|
|
|
|
|
|
|
|
|
|
|
|
|
|
|
4 |
|
|
|
|
|
|
|
|
|
|
|
|
|
|
|
|
|
|
|
|
|
2 |
|
|
|
|
|
|
|
|
|
|
|
|
|
|
|
|
|
|
|
|
|
0 |
|
|
|
|
|
|
|
|
|
|
|
|
|
|
|
|
|
|
|
|
|
1 |
6 |
11 |
16 |
21 |
26 |
31 |
36 |
41 |
46 |
51 |
56 |
61 |
66 |
71 |
76 |
81 |
86 |
91 |
96 |
101 106 111 116 121 126 131 |
|
|
|
|
|
|
|
|
|
|
|
|
|
|
Time |
|
|
|
|
|
|
|
140
Adaptive Animation of Human Motion for E-Learning Applications
Table 1. Accumulated movement of each joint on z, x and y axes
Joint name |
Accumulated movement of |
|
Total |
|
|
the joint |
|
|
movement |
|
|
|
|
|
|
||
|
z |
x |
y |
|
|
|
|
|
|
|
|
Hips Position |
5 |
0 |
3 |
8 |
|
Hips Rotation |
0 |
1 |
3 |
4 |
|
Left Up Leg Rotation |
105 |
29 |
35 |
169 |
|
Left Low Leg Rotation |
265 |
2 |
6 |
273 |
|
Left Foot Rotation |
113 |
6 |
45 |
164 |
|
Left Toes Rotation |
184 |
0 |
3 |
187 |
|
Right Up Leg Rotation |
82 |
17 |
14 |
113 |
|
Right Low Leg Rotation |
218 |
4 |
6 |
228 |
|
Right Foot Rotation |
111 |
4 |
34 |
149 |
|
Right Toes Rotation |
160 |
0 |
5 |
165 |
|
Upper Back Rotation |
4 |
1 |
1 |
6 |
|
Chest Rotation |
4 |
10 |
8 |
22 |
|
Neck Rotation |
8 |
11 |
11 |
30 |
|
Head Rotation |
18 |
11 |
14 |
43 |
|
Chest Rotation |
0 |
0 |
0 |
0 |
|
Left Up Arm Rotation |
301 |
3 |
315 |
619 |
|
Left Low Arm Rotation |
42 |
8 |
30 |
80 |
|
Left Hand Rotation |
0 |
9 |
12 |
21 |
|
Left Fingers Rotation |
0 |
0 |
0 |
0 |
|
Chest Rotation |
0 |
2 |
0 |
2 |
|
Right Up Arm Rotation |
216 |
19 |
285 |
520 |
|
Right Low Arm Rotation |
69 |
4 |
41 |
114 |
|
Right Hand Rotation |
0 |
12 |
63 |
75 |
|
Right Fingers Rotation |
0 |
0 |
0 |
0 |
|
|
|
|
|
|
|
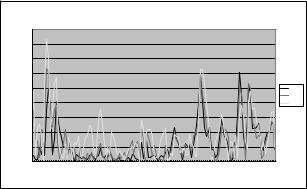
Figure 2. Data error rate of left up arm in x axis
|
|
|
|
|
|
|
|
|
|
|
Left Up Arm X Error |
|
|
|
|
||||||
|
1.6 |
|
|
|
|
|
|
|
|
|
|
|
|
|
|
|
|
|
|
|
|
|
1.4 |
|
|
|
|
|
|
|
|
|
|
|
|
|
|
|
|
|
|
|
|
|
1.2 |
|
|
|
|
|
|
|
|
|
|
|
|
|
|
|
|
|
|
|
|
|
1 |
|
|
|
|
|
|
|
|
|
|
|
|
|
|
|
|
|
|
|
|
Error |
|
|
|
|
|
|
|
|
|
|
|
|
|
|
|
|
|
|
|
|
C7-C6 |
0.8 |
|
|
|
|
|
|
|
|
|
|
|
|
|
|
|
|
|
|
|
C7-C5 |
|
|
|
|
|
|
|
|
|
|
|
|
|
|
|
|
|
|
|
|
|
|
C7-C4 |
|
0.6 |
|
|
|
|
|
|
|
|
|
|
|
|
|
|
|
|
|
|
|
|
|
0.4 |
|
|
|
|
|
|
|
|
|
|
|
|
|
|
|
|
|
|
|
|
|
0.2 |
|
|
|
|
|
|
|
|
|
|
|
|
|
|
|
|
|
|
|
|
|
0 |
|
|
|
|
|
|
|
|
|
|
|
|
|
|
|
|
|
|
|
|
|
1 |
6 |
11 |
16 |
21 |
26 |
31 |
36 |
41 |
46 |
51 |
56 |
61 |
66 |
71 |
76 |
81 |
86 |
91 |
96 |
101 106 111 116 121 126 131 |
|
|
|
|
|
|
|
|
|
|
|
|
|
|
Time |
|
|
|
|
|
|
|
141
Adaptive Animation of Human Motion for E-Learning Applications
Figure 3. Data error rate of left up arm in y axis
|
|
|
|
|
|
|
|
|
|
|
Left Up Arm Y Error |
|
|
|
|
||||||
|
18 |
|
|
|
|
|
|
|
|
|
|
|
|
|
|
|
|
|
|
|
|
|
16 |
|
|
|
|
|
|
|
|
|
|
|
|
|
|
|
|
|
|
|
|
|
14 |
|
|
|
|
|
|
|
|
|
|
|
|
|
|
|
|
|
|
|
|
|
12 |
|
|
|
|
|
|
|
|
|
|
|
|
|
|
|
|
|
|
|
|
Error |
10 |
|
|
|
|
|
|
|
|
|
|
|
|
|
|
|
|
|
|
|
C7-C6 |
8 |
|
|
|
|
|
|
|
|
|
|
|
|
|
|
|
|
|
|
|
C7-C5 |
|
|
|
|
|
|
|
|
|
|
|
|
|
|
|
|
|
|
|
|
|
C7-C4 |
|
|
6 |
|
|
|
|
|
|
|
|
|
|
|
|
|
|
|
|
|
|
|
|
|
4 |
|
|
|
|
|
|
|
|
|
|
|
|
|
|
|
|
|
|
|
|
|
2 |
|
|
|
|
|
|
|
|
|
|
|
|
|
|
|
|
|
|
|
|
|
0 |
|
|
|
|
|
|
|
|
|
|
|
|
|
|
|
|
|
|
|
|
|
1 |
6 |
11 |
16 |
21 |
26 |
31 |
36 |
41 |
46 |
51 |
56 |
61 |
66 |
71 |
76 |
81 |
86 |
91 |
96 |
101 106 111 116 121 126 131 |
|
|
|
|
|
|
|
|
|
|
|
|
|
|
Time |
|
|
|
|
|
|
|
Table 2. Average data error for each level of detail.
Axis of joint |
Average data error for each level of detail |
|||
C6 |
C5 |
C4 |
||
|
||||
|
|
|
|
|
Left Up Arm Z |
2.306 o |
2.691 o |
3.655 o |
|
Left Up Arm X |
0.2596 o |
0.292 o |
0.463 o |
|
Left Up Arm Y |
2.483 o |
2.782 o |
3.586 o |
|
Experiment 2—Smoothness of Transition Between Different LoDs
In this experiment, we study the smoothness of switching between different LoDs of human motion. We start at a distant location from the virtual characterandwegraduallymovecloserandcloser tothecharacter.Duringthismovement,thevirtual character will switch itself to a higher and higher LoD. To make the changes more visible, we use different colors to represent different levels of motion. Figure 4 shows a sequence of four major screen shots showing the motion transitions from a lower LoD to a higher one. If we do not use different colors to separate different LoD’s, the user will not easily notice the changes. In the trial run of our prototype we could see that the transition is very smooth and natural.
CONCLUSION
In this article, we have proposed an adaptive human motion animation method to support realtimerenderingandtransmissionofhumanmotions in e-learning applications. Experimental results show that our method could efficiently reduce the size of human motion data. This is particularly useful to support distributing 3-D animation data in e-learning applications. On the other hand, our method could also render human motion at different levels of detail. By taking advantage of this feature, an e-learning application could provide a compromise between rendering performance and output quality.
142
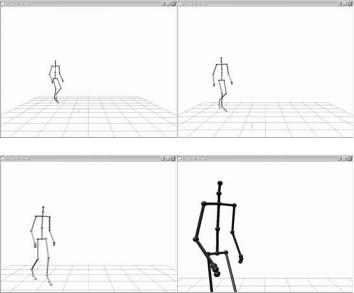
Adaptive Animation of Human Motion for E-Learning Applications
Figure 4. Screen shots of motion transition between different levels of detail.
(a ) |
(b ) |
(c ) |
(d ) |
ACKNOWLEDGMENTS
The work described in this article was partially supported by a CERG grant from the Research Grants Council of Hong Kong (RGC Reference No.: PolyU 5188/04E) and a SRG grant from the City University of Hong Kong (Project Number: 7001465).
REFERENCES
Badler, N., Palmer, M., & Bindiganavale, R. (1999). Animation control for real-time virtual humans. Communications of the ACM, 42(8), 64-73.
Burtnyk, N., & Wein, M. (1976). Interactive skeleton techniques for enhancing motion dynamics in key frame animation. Communications of the ACM, 19(10), 564-569.
Canós, J., Alonso, G., & Jaen, J. (2004). A multimedia approach to the efficient implementation and use of emergency plans. IEEE Multimedia, 11(3), 106-110.
Endo, M., Yasuda, T., & Yokoi, S. (2003). A distributed multiuser virtual space system. IEEE Computer Graphics and Applications, 23(1), 50-57.
H-Anim Specification. (n.d.). Retrieved from http://h-anim.org/
Hoppe, H. (1996). Progressive meshes. Proceedings of ACM SIGGRAPH’96 (pp. 99-108).
Lander, J. (1998, January). Working with motion capture file formats. Game Developer Magazine, p. 30-37.
Lau, R. W. H., To, D., & Green, M. (1997). An adaptive multi-resolution modeling technique based on viewing and animation parameters.
Proceedings of IEEE VRAIS (pp. 20-27).
143
Adaptive Animation of Human Motion for E-Learning Applications
Li F. W. B., & Lau, R. W. H. (2006). On-demand e-learning content delivery over the Internet.
International Journal of Distance Education Technologies, 4(1), 46-55.
Lorensen, W., & Cline, H. (1987). Marching cubes: A high resolution 3D surface construction algorithm. Proceedings of ACM SIGGRAPH’87
(pp. 163-169).
Meyer, K., Applewhite, H., & Biocca, F. (1992). A survey of position trackers. Presence: Teleoperators and Virtual Environments, 1(2), 173-200.
Naka, T., Mochizuki, Y., Hijiri, T., Cornish, T., & Asahara, S. (1999). A compression/decompression method for streaming based humanoid animation. Proceedings of Symposium on VRML
(pp. 63-70).
Piegl, L., & Tiller, W. (1995). The NURBS book. Springer.
Popović,Z.,&Witkin,A.(1999).Physicallybased motiontransformation.ProceedingsofACMSIGGRAPH’99 (pp. 11-20).
Rose,C.,Guenter,B.,Bodenheimer,B.,&Cohen, M. (1996). Efficient generation of motion transitions using spacetime constraints. Proceedings of ACM SIGGRAPH’96 (pp. 147-154).
Sims, D. (1995). See how they run: Modeling evacuations in VR. IEEE Computer Graphics and Applications, 15(2), 11-13.
Stollnitz, E., Derose, T., & Salesin, D. (1996).
Wavelets for computer graphics: Theory and applications. Morgan Kaufmann.
To, D., Lau, R. W. H., & Green, M. (1999, December). A method for progressive and selective transmissionofmulti-resolutionmodels.Proceed- ings of ACM VRST (pp. 88-95).
Treisman, A., & Gelade, G. (1980). A feature-in- tegration theory of attention. Cognitive Psychology, 12, 97-136.
Wang, T., & Chen, C. (1991). A combined optimization method for solving the inverse kinematics problems of mechanical manipulators. IEEE Transactions on Robotics and Automation, 7(4), 489499.
This work was previously published in International Journal of Distance Education Technologies, Vol. 5, Issue 2, edited by S. Chang and T. Shih, pp. 74-85, copyright 2007 by IGI Publishing (an imprint of IGI Global).
144
145
Chapter XII
eWorkbook:
An On-Line Testing System with Test Visualization Functionalities
Gennaro Costagliola
Università di Salerno, Italy
Vittorio Fuccella
Università di Salerno, Italy
ABSTRACT
On-Line Testing is that sector of e-learning aimed at assessing learner’s knowledge through e-learning means. In on-line testing, due to the necessity of evaluating a big mass of learners in strict times, the means for knowledge evaluation had to evolve to satisfy the new necessities: objective tests, more rapidly assessable, started gaining more credence in the determination of learners’ results. In this chapter, the authors present an On-Line Testing system, named eWorkbook, which can be used for evaluating learner’s knowledge by creating (the tutor) and taking (the learner) on-line tests based on multiple choice question type. Its use is suitable within the academic environment in a blended learning approach, by providing tutors with an additional assessment tool, and learners with a distance self-assessment means. Among other features, eWorkbook can record and visualize, in a suitable graphical format, learner’s interactions with the system interface during the test session. This is valuable information for understanding the learner’s behaviour when taking a test. In particular, the graphical analysis of the test outcomes has helped us in the discovery of several strategies employed by the learners to perform the test. In the paper, the main characteristics of the system are presented together with a rationale behind them and an outline of the architectural design of the system.
Copyright © 2009, IGI Global, distributing in print or electronic forms without written permission of IGI Global is prohibited.
INTRODUCTION
In blended learning the electronic means are mixed with the traditional didactics, in order to train and to assess the learners. Learning Management Systems (LMS), enhanced with collaborative environment support, and On-Line Testing tools are more and more widely adopted in the academy. At the University of Salerno some systems and platforms have been tested to support blended learning. Even if some good existing LMS with On-Line Testing capabilities, such as Moodle (Moodle, 2005) and Sakai (Sakai, 2005) have been used, none of them satisfied us at all: we needed an advanced assessment tool which could have helped the lecturers to speed up the onerous task of assessing a huge mass of learners and should have provided the tutor with valuable information for evaluating the whole assessment process.
A state of the art analysis undertaken at our department, which involved several lecturers and students, allowed us to identify the following importantrequirementsforaneffectiveenvironment for developing and using assessment tests:
•Item sharing features;
•Didactics organized in courses and classes;
•Possibility of administering both self-as- sessment tests and proctored laboratory exams;
•Availability of statistics on tests and questions;
•Availability of a rich reporting section on test outcomes.
A project for a comprehensive Web-based assessment system, named eWorkbook, was then started. The system can be used for evaluating a learner’s knowledge by creating (the tutor) and taking(thelearner)on-linetestsbasedonmultiple choice question types. Even though eWorkbook enables the creation of on-line tests for both as-
eWorkbook
sessment and self-assessment, it was planned above all for summative (evaluation) purposes. The questions are kept in a hierarchical repository, that is, it is tree-structured, in the same way as the file system of an operating system. In such a structure, the files can be thought of as questions, whether the directories can be thought of as macroareas, which are containers of questions usually belonging to the same subject. Every item (a macroarea or a question) has an owner, which is the tutor who authored it. The tutors can choose whether to share their questions or not, assigning a value to the permissions associated to each item. Permissions are for reading, writing and using the items.
The tests are composed of one or more sections.Thisstructurefacilitatestheselectionofthe questions from the repository, but it is still useful for the assessment, where it can be important to establish if one section is more important then another to determine the final grade for the test. Theselectionofthequestionscanoccurbothstatically, by directly choosing the questions from the repository, and dynamically, leaving the system to choose the questions randomly.
Didactics are organized into courses and classes: the tutors responsible for a course manage its class and choose the tests that must be taken by the learners of that class. With such an organization, the system can be used by a large set of users, such as the learners and the tutors of an entire faculty. Within a course interface, the learnercaneasilyaccesstheself-assessmenttests. Restrictions on the access rules can be defined for proctored laboratory tests.
Different assessment strategies can be bound to a test, before it is published in a course. The assessmentstrategyaffectsthewayinwhichsome parameters concur to determine the grade of the test. Some strategies are preloaded in the system and are referred to as predefined assessment strategies. Others can be defined by the tutors and saved in his/her reserved area. We will refer to them as customized assessment strategies.
146
eWorkbook
A complete history of learners’ performance on tests of the valuable list is available to the tutor and to the learners themselves. Each record in the history contains the date and the time when the learnerhasjoinedatest,theamountoftimeneeded to finish the test and some information about assessment (test score and state). The detail of the answers to each question can be seen as well and can be viewed in a printer-friendly format. The tutorhasthepossibilityofanalyzingthebehaviour of each learner during a test, by simply inspecting a suitable chart, which graphically summarizes learner’s interactions with the system interface during the test session. By analyzing the data visualization charts from several test outcomes, we have detected several previously unknown test strategies used by the learners.
The rest of the paper is organized as follows. Inthesection“TheMainFeaturesofeWorkbook” the main features of the systems are described in detail. The section “eWorkbook Architecture” is devoted to outlining the architecture of eWorkbook. An example of system use can be found in section “AnExample: The English Knowledge Test”. In section “Related Work”, a comparison is made with some interesting systems related to ours. Some final remarks and a description of future work conclude the paper.
The Main Features of
eWorkkook
In the following subsections we will outline the main characteristics of the eWorkbook system. It is worth noting that eWorkbook was intended to be used by a large number of users, so it has a typical LMS didactics organization, based on courses and classes. A course is a place in which thetutorscanpublishtestsandthelearnerscantake them. Learners can only view the tests published in the courses in which they are members. The tutor manages the class and can accept or deny learners’ affiliation requests and expel a learner from the course.
Question Management
An important matter for On-Line Testing, and more generally for e-learning, in order to accelerate the teaching and the assessment processes, is the reusability of the authored content. The on-line material needs a huge initial effort to be created, while it can be easily modified and reused later on. Therefore it is very important that existing material can be easily found, modified and selected by a tutor who wants to use it for a lesson or a test. There are two main ways to boost the reuse of learning material:
1.Good organization of material kept in an e-learning platform or On-Line Testing system.
2.Interoperability among systems and platforms, to share and exchange material.
Our system was designed to have a well organized question repository to facilitate the tutor in the question management, share and reuse: the question repository of eWorkbook has a hierarchical structure, similar to the directory tree of an operating system. Each item in our repository is a disciplinary macroarea (internal node) or a question (leaf). The membership of a question to a given macroarea is determined by its subject: each macroarea is a container of questions that holds items dealing with a specific subject. It can be further split in other sub-macroareas, which hold questions belonging to a more specific matter. The question types allowed are multiple choice, multiple response and true/false. The tutor can choose if a question should be used for assessment only, for self-assessment only or for both of them.
Aneffortfortheinteroperabilityhasbeenmade supporting the IMS Question & Test Interoperability specification (IMS QTI, 2005): our system can import and export information regarding questions and tests through this widely known and adopted XML-based format.
147
Permissions
Author’s right protection is an important matter too. An e-learning system should offer the tutor the choice to share his own material or not. In eWorkbook, the owner (the tutor who authored the question) and a permission set are associated to each item. The owner establishes the values for each field of the permission set. A permission is a Boolean value that indicates whether other users beyond the owner can perform the action associated to that permission.
For a macroarea, the value for the following permissions must be set:
•ReadPermission: the permission to read the property and the contents of this macroarea.
•WritePermission: the permission to overwrite the property and manage this macroarea (add a sub-item to it, delete it).
•UsePermission: the permission to select a question from this macroarea for a test.
For a question, the permissions are the following:
•ReadPermission: the permission to read the question.
•WritePermission: the permission to delete and overwrite the question.
•UsePermission:thepermissiontoselectthis question for a test presentation. Its default value is the value of UsePermission of the macroarea which this question belongs to.
It’s worth noting that permissions are a good way to protect author’s right and to avoid that the material owned by a tutor is modified or used without his/her consensus. Other systems only give the possibility to share or not all of the tutor’s questions. A permission based system gives more flexibilitytothesystem,allowingdifferentgrades of item sharing.
eWorkbook
Question Metadata
Each question in the repository has a metadata set associated to it. Some of the parameters are decided by the tutor when he/she instantiate the metadata and they can be updated later, others are inferred by the system during its use. Inferred metadata are updated whenever a learner submits a test. Metadata are used in question selection in a way that will be clear in the sequel. The following is a list of the metadata fields:
•Language: the human language in which the question is expressed.
•Keywords: a set of keywords that describe the content of the question.
•Use: the aims the question is for. It can be self-assessment, valuable or both.
•TestOccurrence: an inferred field that is increased by one whenever this question is scheduled for a test.
•AverageAnswerTime:aninferredfield.Itcan be used on our system because it is able to track the time spent by the learner on each question.
•Difficulty:thisfieldhasbothaninferredanda tutorchosenvalue.It’savaluebetween0and 1 that expresses a measure of the difficulty of the question, intended as the proportion oflearnerswhogetthequestioncorrect.The tutor can guess this value at the question creation time and can update it during the question’s lifecycle. The system calculates the inferred value with a simple formula.
•Discrimination: this field is an inferred one. Its value is a measure of how well this question discriminates between learners. A good question should give full mark to good learnersandpenalizebadones.Startingfrom this information, a great deal of criteria can be adopted. A solution is proposed in (Lira et al., 1990): it identifies a good question as the one which the better 20% of learners answers well and the worse 20% of learners
148

eWorkbook
answers incorrectly. We adopted a common solutionappliedinItemAnalysis,calculating discrimination as the Pearson correlation between the score achieved on the question and the total score achieved on the test in which the question was scheduled. Its value is given by the following formula:
|
∑(x − x)( y − y) |
|
r = |
n −1 |
|
∑(x − x)2 |
∑( y − y)2 |
|
|
n −1 |
n −1 |
where the following rules are valid:
◦-1 ≤ r ≤ 1,
◦x is the series of the results got on the question,
◦y is the series of results got on the whole test.
Question Quality Improvement through
Question Lifecycle
In On-Line Testing systems it is important that the quality of the questions is kept high, so that the tutor can assess learners properly, using unambiguous questions that really distinguish between good learners and bad ones. eWorkbook adopts the statistical indicators (Difficulty and Discrimination, seen in the previous chapter) from Item Analysis to get information about the effectiveness of the questions.
Theimprovementofthequalityofthequestion requires the use of a process which allows the tutor to analyze the entire lifecycle of a question, including all its previous versions and the learners’ answers to them. Our question repository has a Version Control System that allows tutors to change some data of the questions, e.g. text, distractors or metadata, still keeping the previous versions of the question: the upgrade of a question does not imply the erasing of the previous version. This could be an important feature for reasonsboundtothehistoryoflearner’sresponses
to the question too: the question could already have been used in some tests before the upgrade, and the system has to remember which version of the question the learner answered. However, the Version Control System is important for reasons related to the quality of the questions: thanks to the tracking of the question lifecycle the tutor has feedback on the variation of statistical indicators over time. In this way, the tutor can modulate the difficulty of the question and make sure that the changes he/she made to it (maybe eliminating misspellingsandambiguities),affectedpositively the quality of the question. Other information, useful to establish the effectiveness of a question, is available: the tutor can easily inspect how many times it was selected to be presented in a test, the number and the percentage of correct, incorrect and not answered responses and the average time needed to get the response.
In the light of the previous arguments, we can argue that the definition and the use of questions from the hierarchical repository for more than one session of tests, combined with the Version Control System, allows the tutors to have a wide choice of high quality questions to select for their online tests.
Test Management
A test is composed of sections. eWorkbook has twowaysofselectingthequestionstobepresented in a test: through a static creation-time choice or a dynamic run-time one. In the first case, the tutor has to choose the questions directly during the creation of the test; in the latter case, she/he has only to specify some selection parameters, letting the system choose randomly the questions across the chosen macroareas whenever a learner takes a test.
Therefore, we have two kinds of sections: a static section is an explicit selection of the questions to present performed at test creation time, while a dynamic section is characterized by a set of rules that perform a selection on the entire
149
repository. For a dynamic section, there are three kinds of selection rules:
1.Definition ofthemacroarea.Thisrulelimits theselectiononlytothequestionsbelonging to the specified macroarea. A flag can be set, that further selects also the questions belonging to the descendent macroareas.
2.Definition of keywords. This rule limits the selectiononlytothequestionsthatmatchthe input keywords. Some logical connectors, in a search engine style can be used. By default, the questions which contain even one of the input keywords are selected. No relevance rate is associated to the results.
3.Definition of some assertions on metadata fields. They are of the following form:
<metadata_ field> <connector> <value>.
As an example, for a section, we can choose to use only those questions that have difficulty > 0.5.
Thesamethreerulesarealsousedtosearchthe questions for a static section through a wizard in the Web-based interface. The tutors can choose to use just one of them to select the questions, or to combine them to narrow or to expand the search results. The tutors can also choose whether to use only their material or the one shared by the other tutors too.
These rules allowed us to overcome problems related to question selection: different tests for each learner can be generated still getting an objective assessment through the selection of ranges for the difficulty and the average answer time. The discrimination was decided not to be used for question selection assertions, in order to avoid the neglecting of low quality questions. Our policy was to encourage the tutor to review low quality questions, in order to correct their anomalies and increase their quality.
eWorkbook
Test Presentation
Two different lists of tests are presented to the learner within the course interface: the valuable and the self assessment test lists. Each test in the former list is used to determine the learner’s evaluation and is characterized by an access control specified by a prerequisite expression and a maximum number of attempts. The latter list is just a guide for the learner to self train and assess: each test in it has not got any access restriction and does not affect the learner evaluation. Each test presented in a course is bound to some test execution options. These options allow the tutor to customize the test with further information which could not be available or decided at the test creation time, so we choose not to hard-code them in the test. Test execution options include the following information:
•IP Limitation: an option through which the tutor can authorize or deny access to some clients, according to their IP. A selection of authorized IP lists must be chosen. This option can be particularly useful for official exams, whose tests are required to be taken only by the learners that physically present in a laboratory. An IP list can be defined and selected for all the PCs of that laboratory. Wildcards and IP ranges can help to define IP lists.
•Assessment: a list of options that specify the numeric scale for the mark, the threshold to pass the test and the marking strategy. Details about marking strategies can be found in section “Assessment Strategies”.
•Shuffle: this Boolean option can be checked if the tutor wants to randomize the sequence of the questions, to make it more difficult for the learners to cheat.
•Access Control: this section of options is valid only for valuable tests. The tutor can
150
eWorkbook
choose the maximum number of attempts allowed for the test and the prerequisites for accessing it. Prerequisites establish, through a simple even powerful expression, the learner’s right to access the test. If not fulfilled, prerequisites can deny learner’s access to the test. Prerequisites for a test are based on the learner results on the previous tests in the valuable test list. The language supported for the expression is aicc_script; a string expressed in such a language has a Boolean value and it is composed of the following elements:
◦Identifiers: nouns that univocally identify a test in the valuable list.
◦Constants: values that define the state of a test (passed, completed, browsed, failed, not attempted, and incomplete).
test type (self-assessment, proctored laboratory exam, etc.).
Assessment Strategies
eWorkbook provides a wide choice of predefined assessment strategies and the possibility to define anewcustomizedassessmentstrategy.Anassessment strategy is a set of choices of the values to give to some parameters taken into account during the test assessment process. The predefined strategies are preloaded in the system and cannot be changed. They are at the disposal of all of the tutors.Thecustomizedstrategiescanbedefinedby atutor,andtheyremainvisibleonlyinhisreserved area. All the strategies calculate the final mark on the test by summing the results achieved on the single questions. The maximum mark which can be obtained on a single question depends on
◦Logic, equality and inequality opera- the weight of the question. A weight is assigned
tors.
◦A special syntax to define a set and to specify at least n elements from a set. As an example: the expression test1 & 2*{test2, test3, test4} is true if the state of test1 is passed or completed and at least two among test2, test3 e test4 are passed or completed. A simple visual interface helps the tutor to define the prerequisites string without knowing aicc_script language. There is also an aicc_script-to-natural language translator to help the learner to better understand the prerequisites for a test. A better and more complete explanation of aicc_script can be found in (ADL, 2001).
An instance of test execution options is a configuration that can be saved with a name and recalled in a second time, whenever a new test must be added. The tutor can opportunely define different sets of execution options in order to choose the most suitable configuration for a given
by the tutor to each section of questions in a test and the weight of a question is easily calculated by dividing the weight of the section by the number of questions in it. The customizable parameters are the following:
•Weighting: this parameter, if set, enables the weighted assessment for a test, that is, the maximummarkgotonthequestiondepends on its weight. If a tutor wants a section to be more important than the others, he/she has to give a higher weight to it during the test authoring, and he/she has to choose an assessment strategy with the weighting parameter set. If this parameter is not set, all the questions equally contribute to get the mark on the whole test.
•BonusOnCorrect: this parameter, if set, allowsthetutortospecifyapositiverealfactor (bonus) by which the mark obtained on the correctly answered questions during the assessment process must be multiplied.
•PenaltyOnIncorrect: this parameter, if set, allows the tutor to specify a negative real
151
eWorkbook
factor (penalty) by which the weight of the incorrectly answered questions during the assessment process must be multiplied. If not set, the mark obtained on the questions answered incorrectly is zero. It is possible to choose a fair penalty, which gives to the questions answered incorrectly a mark of –(1/NC-1), where NC is the number of choices for a question. The use of the fair penalty should set to zero the mean mark for a question guessed by a learner who does not know the right answer to it.
•PenaltyOnNotAnswered: this parameter, if set, allows the tutor to specify a negative real factor (penalty) by which the weight of the unanswered questions during the assessment process must be multiplied. If not set, the mark obtained on the unanswered questions is zero.
Table 1 summarizes the values given to the parameters above for each predefined strategy. The names of the strategies have been taken from (IMSASI,2004).Aswecansee,foreachstrategy, thereisaweightedversion.Noneofthepredefined strategies adopts bonuses on correct or penalty on not answered questions. NumberCorrect is a ‘plain’ strategy: none of the parameters is set. Its name is due to the way in which it calculates the mark on the whole test: just summing the number of corrected answers (and scaling the result to 30 or100).GuessingPenaltyanditsweightedversion
WeightedGuessingPenalty use 1 as factor for the PenaltyOnIncorrect parameter. This means that they subtract the entire weight of the incorrectly answered questions from the final mark on the test. GuessingFairPenalty and its weighted version WeightedGuessingFairPenalty, use the fair penalty, explained above.
History Tracking
A complete history of a learner’s performances on valuable test list is available to the tutor and to the learner him/herself. The tutor can view the results achieved by all the learners in his/her classes, while the learner view is restricted only to his/her results. Each record in the history contains the date and the time when the learner joined a test, the amount of time needed to finish the test and information about assessment (test score and state).
To consult the history, a search engine style form must be filled. The fields of the form allow the seeker to select a course, a learner and a test whoseinstancesmustbeshown.Furtheradvanced parameters, which allow to narrow the research, are: the state (terminated, not terminated) and the result (passed, not passed) of the test, a date range during which the test was taken, and the number of results per page.
Each instance present in the result pages has a link to a pdf file that contains a printable version of the test with all the learner’s answers. A
Table 1. Parameters settings for predefined assessment strategies
Strategy Name |
Weighted |
BonusOn |
PenaltyOn |
PenaltyOn |
|
Correct |
Incorrect |
NotAnswered |
|||
|
|
||||
|
|
|
|
|
|
NumberCorrect |
NO |
NO |
NO |
NO |
|
|
|
|
|
|
|
WeightedNumberCorrect |
YES |
NO |
NO |
NO |
|
|
|
|
|
|
|
GuessingPenalty |
NO |
NO |
YES (1) |
NO |
|
|
|
|
|
|
|
WeightedGuessingPenalty |
YES |
NO |
YES (1) |
NO |
|
|
|
|
|
|
|
GuessingFairPenalty |
NO |
NO |
FAIR |
NO |
|
|
|
|
|
|
|
WeightedGuessingFairPenalty |
YES |
NO |
FAIR |
NO |
|
|
|
|
|
|
152
eWorkbook
unique pdf file for all the instances is available as well. In such a way, all the tests can be saved or printed in one operation.
Test Visualization
eWorkbook tracks learner’s interactions during the execution of a test. This can be useful for understanding the strategy used by the learner to complete the test and for giving him/her advise on how to perform better in future tests. Several experiments have been performed to this aim (Bath, 1967; Johnston, 1977; McClain, 1983) in the past. Our approach is the following: learner’s interactions during tests are logged and stored in XML files; then the information gathered is analyzed and visualized in a suitable chart.
By showing the salient points of a test execution, a chronological review of the test is available to the tutor. The chart shows, at any time, the item browsed by the learner, the mouse position (intended as the presence of the mouse pointer on the stem or on one of the options) and the presence ofresponsetypeinteractions,correctorincorrect. The chart is two-dimensional: the horizontal axis reports a continuous measure, the time, while the vertical axis displays categories, the progressive numberoftheitemcurrentlyviewedbythelearner. Thetestexecutionisrepresentedthroughabroken line. The view of an item for a determined duration, is shown through a segment drawn from the point corresponding to the start time of the view totheonecorrespondingtoitsend.Consequently, the length of the segment is proportional to the duration of the visualization of the corresponding item. A vertical segment represents a browsing event. A segment oriented towards the bottom of the chart represents a backward event, that is, the learner has pressed the button to view the previous item. A segment oriented towards the top is a forward event.
The responses given by a learner on an item are represented through circles. The progressive number of the chosen option is printed inside the
circle.Theindicationofcorrect/incorrectresponse isgivenbythefillingcolorofthecircle:abluecircle represents a correct response, while an incorrect response is represented through a red circle. The color is also used for representing the position of the mouse pointer during the item view. The presence of the mouse pointer in the stem area is represented through a black color for the line. As for the options areas, the red, yellow, green, blue and purple colors have been used, respectively, for 1 to 5 numbered options. More than 5 options are not supported at present. Lastly, grey is used to report the presence of the mouse pointer in a neutral zone. The graphical chronological review of a sample test is shown in Figure 1.
By analyzing the charts obtained with system use, we realized that learners often follow common strategies for completing on-line tests. In our experiments we have identified the following three mostly employed strategies:
•Single Phase. This strategy is composed of just one phase (a part of the test execution needed by the learner for sequentially browsing all or almost all of the questions in a test). The time available to complete the test is organized by the learner in order to browse all the questions just once. The learner tries to reason upon a question for an adequate time and then gives a response in almost all cases, since he/she knows that there will not be a revision for the questions. Eventual phases subsequent to the first one have a negligible duration and no responses.
•ActiveRevising.This strategy is composed oftwoormorephases.Thelearnerintentionally browses all the questions in a shorter timethanthetimeavailable,inordertoleave sometimeforrevisingphases.Thequestions whose answer is uncertain are skipped and the response is left to subsequent phases. As a general rule, the first phase lasts a longer time and the subsequent phases have decreasing durations.
153
eWorkbook
Figure 1. Graphical chronological review of a sample test
•PassiveRevising.Thisstrategyiscomposed of two or more phases. The learner browses and answers all the questions as fast as possible. The remaining time is used for one or more revising phases. As a general rule, the first phase lasts a longer time and the subsequent phases have decreasing durations.
For both the definition of the strategies and the classification of test instances, the charts have been visually analyzed by a human operator. The above tasks are rather difficult to perform automatically, while a trained human operator can establish the strategy used by the learner from a visual inspection of the charts of the test instances and giving advice to the learners on how to perform better next time. Samples of the strategies are shown in Figure 2.
Other uses of the above described method are the detection of correlation among questions and the detection of cheating during tests. The reader can refer to (Costagliola et al., 2007) for obtaining a more detailed description on the educational results of our experiments with the tool.
eWorkkookkArchihicture
As shown in Figure 3, eWorkbook has a layered architecture. The Jakarta Struts Framework
(Struts, 2005) has been used to support the Model 2designparadigm,avariationoftheclassicModel ViewController(MVC)approach.Strutsprovides its own Controller component and integrates with other technologies to provide the Model and the View.Inourdesignchoice,StrutsworkswithJava Server Pages (JSP, 2005), for the View, while it interactswithHibernate(Hibernate,2005),apowerful framework for object/relational persistence and query service for Java, for the Model.
The application is fully accessible with a Web Browser. Navigation is facilitated across the simple interfaces based on menus and navigation bars. User data inserting is done through HTML forms and some form data integrity checks are performed using Javascript code, to alleviate the server side processes. A big effort was made to limit the use of client-side scripts only to the standard EcmaScript language (ECMAScript, 2005).Nobrowserplug-ininstallationsareneeded.
154
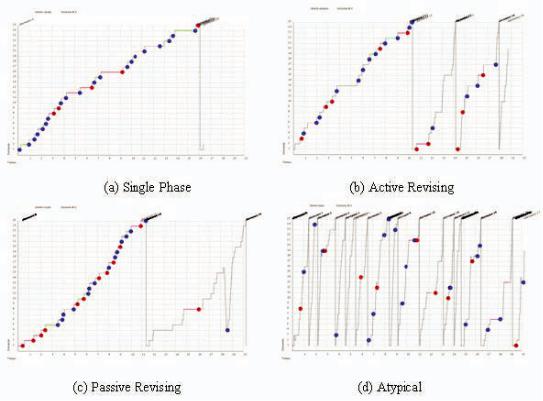
eWorkbook
Figure 2. Sample of test execution strategies
It is worth noting that the system has been tested on recent versions of the most common browsers (i.e., Internet Explorer, Netscape Navigator, Firefox and Opera).
The Web Browser interacts with the Struts Servlet that processes the request and dispatches it to the Action Class, responsible for serving it, according to the predefined configuration. It is worth noting that the Struts Servlet uses the JSP pages to implement the user interfaces. The Action Classes interact with the modules of the Business Layer, responsible for the logic of the application. The Business Layer accesses to the Data Layer, implemented through a Relational Data Base Management System (RDBMS), to persistthedataacrossthefunctionalitiesprovided by Hibernate framework.
Controller Layer
This layer has many duties, among which are: gettingclientinputs,dispatchingtherequesttothe appropriate component and managing the view to return as a response to the client. Obviously, the Controller layer can have many other duties, but those mentioned above are the main ones.
In our application, following the Struts architecture, the main component of the Controller layer is the Struts Servlet, which represents the centralized control point of the Web application. In particular, the Struts Servlet processes each client request and delegates the management of the request to a helper class that is able to execute the operation related to the required action. In Struts, the helper class is implemented by an Action Class that can be considered as a bridge between a client-side action and an operation of
155
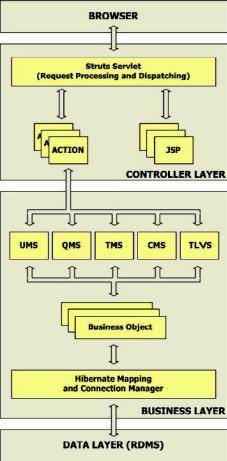
Figure 3. Architecture of eWorkbook
the business logic of the application. When the ActionClassterminatesitstask,itreturnsthecontrol to the Struts Servlet that performs a forward action to the appropriate JSP page, according to the predefined configuration.
Toreducetheefforttomaintainandcustomize the application, we chose to limit the use of the JAVAcodeintheJSPpages,usingasanalternative the Struts taglibs. In this way the Web designers areabletoworkonthepagelayoutswithoutshouldering the programming aspects. Finally, thanks to the use of the Struts framework, eWorkbook has the complete support for the internationalization of the Web-based interface. Even if, in its earlier releases, it only came with the English and Italian versions, the translation is quite an easy
eWorkbook
duty: to add a new language version all that our system needs is the translation of some phrases in a .properties (plain text) file. The Web pages are returned to Web browsers in the language specified in the header of the request.
Business Layer
This layer contains the business logic of the application. In any medium-sized or big-sized Web application, it is very important to separate the presentation from the business logic, so that the application is not closely bound to a specific type of presentation. Adopting this trick, the effort to change the look & feel of eWorkbook is limited to the development of a new user interface (JSP pages), without affecting the implementation of the other components of the architecture.
As mentioned before, every Action Class of the Controller Layer is able to execute an operation of the business logic of the application. To this aim, the Action Classes interact with four different subsystem of the Business Layer (see Figure 3). These subsystems are:
1.User Management Subsystem (UMS): this subsystem is responsible for user management.Inparticular,itprovidesinsert,update and delete facilities.
2.Question Management Subsystem (QMS): thissubsystemmanagesthequestionrepository of eWorkbook and controls access to it. It is composed of two modules:
a.Question Repository Manager: this module allows the management of the hierarchical structure of the question repository. Each internal node in it is a disciplinary macroarea, while each leaf is a question. This module allows the insertion, update and deletion of a macroarea and/or a question from the repository.
b.Access Permission Manager: this module controls access to the ques-
156
eWorkbook
tion repository. For each node of the question tree it is necessary to specify the owner (i.e., the tutor who authored the macroarea or the question) and a permission set. The owner establishes the value for each field of the permission set.
3.Test Management Subsystem (TMS): this subsystem manages the test repository of eWorkbook.Toachievethis,wehavedivided this subsystem into four modules:
a.Authoring Manager: this module permits to create a new test, defining the questions that compose the test and the test execution options. The Authoring Manager also allows the publishing of an existing test in one or more courses;
b.Assessment Manager: this module performs the test evaluation and manages the assessment strategies;
c.Execution Manager: this module manages the test execution. To aim this, the Execution Manager gets a test instance from the Authoring Manager and performs the necessary operation to present it to the user. At the end of the test execution this module passes thecontroltotheAssessmentManager to valuate the test;
d.History Manager: this module manages the history of a learner’s performance and a test’s execution.
4.Course Management Subsystem (CMS): this subsystem manages the courses. In particular, it allows the insertion, update and deletion of a course.
5.Test Logging & Visualization Subsystem (TLVS): this subsystem is composed of a
Logging Framework and a Log Analyzer. The former is an already existing OO Java Framework which captures and logs all of thelearnersinteractionswiththeon-linetest- ing system interface and can be instantiated
in any on-line testing system. It is further composed of a client-side, based on AJAX technologies, and a server-side module. The latter is a module that analyzes the logs in order to extract information from them and to graphically represent it.
It is worth noting that all the subsystems described above access to one or more business objects to manipulate information that is stored in the database. The Hibernate framework is used to manage those business objects that accede to the data layer across an appropriate mapping. The target of this mapping is to transform a relational database (stored in the data layer) in a light OO database; in this way it is possible to manage the data exploiting the advantages provided by the OO paradigm.
Data Layer
This layer contains the information stored in a RDBMS. It is worth noting that eWorkbook is not closely bound to a specific RDBMS, but supports much of the most popular RDBMS (i.e., MySQL (MySQL, 2005), Firebird (Firebird, 2005), etc). All that eWorkbook needs, to be used with a different RDBMS, is the modification of the connection URL in the Hibernate configuration file: the creation and initialization of the DB is an automatic process.
An Example: The English
Knowwedge Test
eWorkbook was installed on the Web Server of the Faculty and successfully tested for the latest sessions of the English Knowledge Test, which is mandatory in our university. In our faculty, the system was used to replace the traditional oral exam with an on-line objective test, more suitable for assessing a huge mass of students.
157
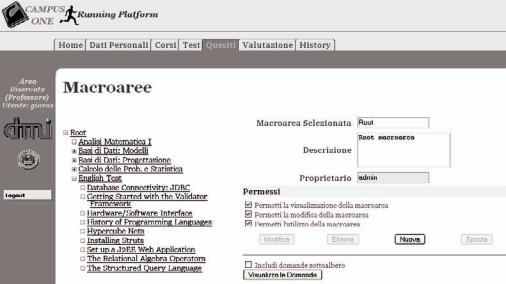
The test is aimed at evaluating learners’ reading comprehension. The syllabus of the exam is composed of twenty passages taken from the textbooks of some ordinary exams. On the day of the exam each learner takes a randomly chosen passage on which his/her test is based. The time to complete the test is 20 minutes, during which the student has to answer 25 questions. A sixty-seat laboratory is available for the exams, an adequate number of users to test the system in a typical academic usage scenario.
Question and Test Authoring
In eWorkbook, the tutors can edit the question repository through a simple visual Web based interface. This is quite similar to the my computer browser program which allows an operating system user to edit the file system structure. As shown in Figure 4, the interface is split in two views: one on the left, which shows the question repository tree, and one on the right, which shows in an HTML form the attributes of the selected item, so that they can be easily changed. Every sub-tree on the left view can be expanded or col-
eWorkbook
lapsed using the ‘+’ and ‘-‘ image controls close to the macroarea icon. A set of buttons, shown in a proper toolbar, allows the tutor to execute various tasks on the items. Each user can only browse the macroareas on which he has the UsePermission set. If an action is not allowed, the corresponding button is shown greyed.
The insertion of a question in the repository can be done through a wizard interface provided by our system. The wizard consists of a sequence ofscreenswherethetutormustinsertthequestion, its stem and options, the metadata and some assessment information. The insertion of a question bank is possible too: it is done by importing the question definition, from a text file or an XML text expressed in an IMS QTI (IMS QTI, 2005) conformant format.
A new macroarea, named English Test, was added to the root of the tree. A new course with the same name was activated as well. In the macroarea English Test twenty (one for each passage) sub-macroareas were added. In each of them, several questions were added. All the permissions for the new added macroareas and questions were set.
Figure 4. A Screenshot of the question repository structure
158
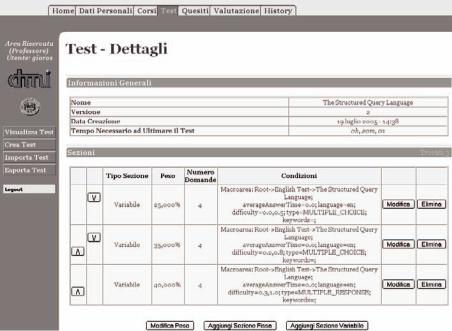
eWorkbook
Anewtestwascreatedforeachpassage.Every test is composed of three sections. The difficulty is increasing over them: an easy section containing five questions with difficulty between 0 and 0.4; a medium one containing fifteen questions with difficulty between 0.3 and 0.7; a difficult one containing five questions with difficulty between 0.6 and 1. All the tests were added to the valuable list of the English Test course, limiting the execution of the tests only to the computers with an IP address in the range of the laboratory in which the exam takes place.
The same test list was also published in the self-assessmentsection.Toencouragethestudents to get trained, a small part of the questions used for the exam were also used for the self-assess- ment tests. A screenshot summarizing the test’s feature is shown in Figure 5.
Assessment Policy and Test Results
TheWeightedNumberCorrectassessmentstrategy has been chosen to evaluate the tests: to the easy,
Figure 5. A screenshot of the test details
medium and difficult sections have been given, respectively,25%,35%and40%ofthetotalscore. The score has been calculated in a /30 scale, with 18 as a passing threshold. So doing, we consider a student as worthy to get the exam if he/she gets all of the easy and the medium questions and just one of the difficult ones.
All the students interested in taking the exam are asked to obtain an account on the system some daysbeforetheexamitself.Oncethelearnertakes a test, a timer starts to measure the time he/she spends on that attempt. If he/she hasn’t already done it before, he/she must deliver the test as the timer expires. Even the time spent on each question is recorded. Once the test is delivered, a table summarizing test results is shown. Two screenshots of the test execution and some pages of the test pdf format are shown, respectively, in Figure 6 and Figure 7.
At the moment, several exam sessions have been done. The mean pass rate is between 60% and 70% of the students. Some items with poor discrimination have been modified through the
159

eWorkbook
Figure 6. A screenshot of the test execution
Figure 7. The test PDF format
160
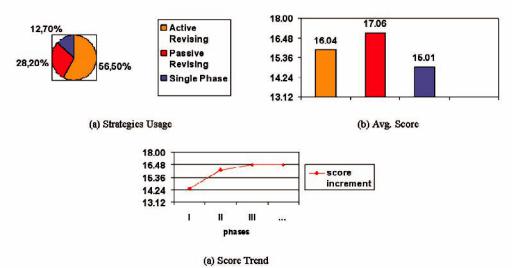
eWorkbook
sessions. We finally got good discrimination on most of the questions.
Learners’ Strategies Analysis
Byvisuallyanalysingthedataofourexperimentit cameoutthatthemostfrequentlyadoptedstrategy is Active Revising, which was used by 40 learners over 71 (56.5%), followed by the Passive Revising strategy (20 learners over 71, 28.2%), and by the Single Phase one, used only in 9 cases over 71 (12.7%). Only two learners have adopted an atypical strategy (see Figure 2d), which cannot be classified in any of the previously described patterns.
Thebestresultshavebeenachievedbylearners who adopted the Passive Revising strategy, with an average score of 17.6 exact responses over the 25 test questions. With the Active Revising, instead, an average score of 16.4 has been achieved. Lastly, the Single Phase strategy turned out to be the worse one, showing an average score of 15.1. Therefore, it appears that a winning strategy is one using more than one phase, and this is confirmed by the slightly positive linear correlation (0.14)observedbetweenthenumberofphasesand
Figure 8. Strategies analysis
the score achieved on the test. For both strategies using more than one phase (active and passive revising) the score is often improved through the execution of a new phase.
Theimprovementisevidentintheearlyphases and tends to be negligible in subsequent phases: starting from a value of 14.3 obtained after the first phase, the average score increases to 16.2 after the second phase. The presence of further phases brings the final score to an average value of 16.5. The average duration of the first phase in the Passive Revising strategy (14’50”) is longer than the one registered for the Active Revising strategy (11’51”). This result was predictable, since, by definition, the Active Revising strategy prescribes the skipping (= less reasoning) of the questions whose answer is more uncertain for the learners.
Another predictable result, due to the above arguments, is that the Passive Revising strategy has less phases than the Active one, on average (2.55 and 3.2, respectively).
The above results have been summarized in Figure 8.
161
RELATED WORK
Several different assessment tools and applications to support blended learning have been analyzed, starting from the most common Webbased e-learning platforms such as WebCT 4.1 Campus Edition (WebCT, 2005), Blackboard 6 (Blackboard, 2005), Click2Learn Aspen 2.0
(Aspen, 2005), EduSystem (EduSystem, 2005), and The Learning Manager 3.2 (The Learning Manager, 2005). The analysis has been carried out both by exercising the systems and by studying literature surveys and benchmark analyses (EduTools, 2005). Special emphasis has been placed on evaluating the existing systems with respect to the requirements identified in the previous section.
Intheliteraturewecanfindtwomaincategories ofassessmentsystems:thosewhichautomatically generate questions from the lecture material, and those which make use of a pre-populated question repository from which questions are chosen randomly. The firstkind of systems often requires the prior creation of a knowledge structure, like a concept graph or ontology, as for the system described in (McAlpine, 2005). Other systems of this type (Mitkov, 2003) use Natural Language Parsing to extract information from a text and generate the questions. Using these techniques, it is hard to bet on the good quality or readability of the generated questions. Such drawbacks often relegate the use of this kind of systems only to experimental purposes.
The systems which involve the tutor in the task of creating a set of questions to be stored in a repository prove to be more reliable and consequently are used more for official exams, in order to obtain an objective assessment. Those systems, such as the ones described in (Li & Sambasivam, 2003) and in (Lister & Jerram, 2001), sometimes use an XML test configuration file to define some rules for the question selection. In question repository based systems; the challenge
eWorkbook
is to give a good organization to the repository, to avoid question replication, and to use a good question selection procedure in order to assess learners’ skills on the desired subjects. Some systems, like Claroline (Claroline, 2005) just use a plain container to keep questions. In Moodle (Moodle, 2005) and (Capuano et al., 2003), the question repository is partitioned in sets, often called categories or macroareas, in order to have a per-subject organization of the questions. In (McGough et al., 2001) and (Gusev & Armenski, 2002) a hierarchically structured organization of the repository is exploited. In (McGough et al., 2001), a tree is associated to a lesson and each of its branches is used for assessing learners on a part of the lesson. A leaf in this tree is a set of questions. In (Gusev & Armenski, 2002) a more complete but complex system is described, where questions are classified exploiting similarities among them.
Only a few systems adopt some kinds of author’s right protection. Claroline and Moodle let the tutor choose whether to make his/her questions visible to other tutors or not.
Few systems among the analyzed ones have someformsofqualitycontrolofthequestions.An interesting feature is the opportunity to judge a questionoratestanalyzingthelearners’responses toit.Startingfromthisinformation,manycriteria canbeadopted.Inparticular,Hicks(Hicks,2002), reporting his experience with a large class at the University of Newcastle upon Tyne, identifies a good question as the one to which the better 20% of learners answers well and the worse 20% of learners answers incorrectly. In (Lira et al., 1990) the degree of difficulty of a test is calculated using the maximum possible (max) and minimum possible (min) score and the average score (avg) of the class according to the following formula:
((avg – min) / (max – avg)) * 100.
eWorkbook has a complete tracking system to judge the quality of a question: every time a
162
eWorkbook
significant change is made to a question, a new version of it is generated. For each version of the question, all the history of the learner’s answers is kept. From a statistical analysis, explained in detail in section “Question Quality Improvement Through Question Lifecycle”, we can guess the quality of the question and its improvement over time. The attempt to judge difficulty and quality of question items is not a new subject. Two main theories are noteworthy: Item Analysis and Item Response Theory (Hambleton & Swaminathan, 1985). Unfortunately, it is quite uncommon to find an assessment system that uses one of the effectively. Some explanations and a comparison between them can be found in (Fan, 1998).
Asforquestionselectionfromalargedatabase to compose tests, two algorithms were analyzed: the proposals of (Sun, 2000) and (Hwang et al., 2006).The former is aimed at constructing tests with similar difficulties. The difficulty is calculated using Item Response Theory model. The latter takes into account other parameters too, such as discrimination degree, length of the test time, number of test items and specified distribution of concept weights.
Most of the analyzed systems are complete LMS. The assessment tool is an integral part of them. eWorkbook was thought to be used by the large number of users of our university, so we gave to the didactics an organization in courses andclasses,tosupportmultiplechannelsinwhich to publish the tests.
As for a means for sequencing and control access to the tests, none of the tools analyzed has a flexible system. The system described in (Li & Sambasivam., 2003) permits the learner to sit an exam many times, until a minimum acceptable score is achieved. In (McGough et al., 2001) the questions are grouped into sets, and the strategy to pass a set, and consequently access to the next, is to give the correct response to 3 answers in a row for that set.
CONCLUSION AND FUTUREWORK
In the paper, we have presented eWorkbook, a system for the creation and deployment of assessment and self-assessment tests. The proposed systemcansignificantlyacceleratetheassessment process, thanks to the reusability of the authored content. We achieved reusability by allowing the tutorstosharetheirquestionswithothertutorsand by adopting a hierarchical subject-based question repository. Such an organization makes it easier to find, modify and select the questions for the tests. The system is even able to interoperate with other systems that support IMS QTI specification. The chance to mix fixed banks of questions with randomlychosenquestionsections,givesthetutor thechancetogettherightcompromisebetweenan objective assessment and the sureness to include a wide coverage of subjects. Author’s rights are protected through the use of separate permissions for reading, writing and using the questions.
The use of eWorkbook can help tutors in keep high the quality of the assessment, thanks to the Version Control System. This system tells the tutor if the changes he/she make to the questions positively affect the quality of the question. Other feedback information on questions are available too.
Our effort to make the application portable and usable makes it especially suitable for the academic use for which it was conceived, even thoughitisstillagoodchoiceindifferentenvironments. The wide choice of assessment strategies and the possibility to extend that choice with new user-defined strategies, help the tutor to tailor the test evaluation to the competency and skill level of the class. The learner can self-assess and fully reap the benefits of blended learning. The definition of access rules, like prerequisites and attempt limitation, compels the learner to follow the right learning path.
Thereportsectionisrichwithinformationand fit out of charts and tables. The tutor can have a complete and deep control over the performance
163
of the class and the learners even on a single macroarea, and over the effectiveness of the authored resources. The system lets tutors monitor learners’ strategies during on-line tests. The approach exploits data visualization to draw the data characterizing the learner’s test strategy, in order to trigger tutor’s attention and to let him/her discover previously unknown behavioural patterns of learners. In this way the tutor is provided with a powerful tool that let him/her review the whole assessment process, and evaluate possible improvements.
The system has been used for the English knowledge test by the students and the teachers of our faculty. The testing has shown that teachers, also with very little technical skills, can easily use eWorkbook to create assessment tests thus fully taking advantage of blended learning. Nevertheless, a more accurate evaluation of the effectiveness of the approach is foreseen for the current academic year. Moreover, future work will be devoted to test the scalability of the system with a larger number of simultaneously on-line users.Otherinterestingdevelopmentsareplanned as future work. Although multiple choice is the most common and widely adopted question type, and it is enough to arrange structured online tests, we are working in order to support other types of questions (e.g. fill-in, matching, performance, sequencing, likert, numeric) and questions based on external tools, like those proposed in (Hicks, 2002). Other efforts will be spent to introduce multimedia elements, like images, video and sound, and rich text capabilities in the rendering of the questions.
REFERENCES
ADL (2001). The SCORM Content Aggregation Model,Version1.2.AdvancedDistributedLearning Initiative, http://www.adlnet.gov
eWorkbook
Aspen (2005). Click2Learn Aspen, http://home. click2learn.com/en/aspen/index.asp
Bath, J. A. (1967). Answer-changing Behaviour on objective examinations. The Journal of Educational Research, 61, 105-107.
Blackboard (2005). http://www.blackboard.com
Capuano, N., Gaeta, M., Micarelli, A., & Sangineto, E. (2003). An intelligent web teacher system for learning personalisation and Semantic Web compatibility. Proceedings of the Eleventh International PEG Conference, St Petersburg, Russia.
Chef (2005). CHEF: CompreHensive collaborativE Framework. http://chefproject.org.
Claroline (2005). http://www.claroline.net
Costagliola, G., Fuccella, V., Giordano, M., & Polese, G. (2007). A Web-Based E-Testing System Supporting Test Quality Improvement. In
Proceedings of The 6th International Conference on Web-based Learning. (pp. 272–279).
DublinCore(2005).DublinCoreMetadataInitiative. http://dublincore.org
ECMAScript (2005). Standard ECMA-262, ECMAScript Language Specification. http://www. ecma-international.org/publications/files/ECMA- ST/Ecma-262.pdf
EduSystem(2005).http://www.mtsystem.hu/edusystem/en
EduTools (2005). http://www.edutools.info/ course/index.jsp
Fan, X. (1998). Item Response Theory and Classical Test Theory: An Empirical Comparison of Their Item/Person Statistics. Educational and Psychological Measurement, 58(3), 357-381.
Firebird (2005). http://firebird.sourceforge.net/
164
eWorkbook
Gusev,M.,&Armenski,G.(2002).onLineLearning and eTesting. In Proceedings of 24th International Conference on Information Technology Interfaces, Cavtat, Croatia, (pp. 147-152).
Hambleton, R. K., & Swaminathan, H. (1985).
Item Response Theory - Principles and Applications. Kluwer Academic Publishers Group, Netherlands
Hibernate (2005). http://www.hibernate.org.
Hicks, C. (2002). Delivery And Assessment Issues Involved in Very Large Group Teaching. In Proceedings of IEE 2nd Annual Symposium on EngineeringEducationProfessionalEngineering Scenarios, London, UK, (pp. 21/1-21/4).
Hwang, G. J., Lin, B. M. T., & Lin, T. L. (2006). An effective approach for test-sheet composition withlarge-scaleitembanks,Computers&Educa- tion, 46(2), 122-139.
IMS ASI (2004). IMS Global Learning Consortium, IMS Question & Test Interoperability: ASI Outcomesprocessing,FinalSpecificationVersion 1.2, http://www.imsglobal.org/question/index. html
IMS QTI (2005). IMS Global Learning Consortium: IMS Question & Test Interoperability: IMS Question & Test Interoperability Specification, http://www.imsglobal.org/question/index.html
JSP (2005). JavaServer Pages Technology, http:// java.sun.com/products/jsp
Johnston, J. J (1977). Exam Taking speed and grades. Teaching of Psychology, 4, 148-149.
Li, T., & Sambasivam, S. E. (2003). Question Difficulty Assessment in Intelligent Tutor Systems for Computer Architecture. Information Systems Education Journal, 1(51).
Lira, P., Bronfman, M., & Eyzaguirre, J. (1990). Multitest II - A Program for the Generation, Correction and Analysis of Multiple Choice
Tests. IEEE Transactions on Education, 33(4), 320-325.
Lister, R., & Jerram, P. (2001). Design for webbased on-demand multiple choice exams using XML. In Proceedings of IEEE International ConferenceonAdvancedLearningTechnologies, Madison, Wisconsin, USA, (pp. 383-384).
McAlpine, M. (2005). Principles of Assessment. CAA Centre, University of Luton. http://www. caacentre.ac.uk/dldocs/Bluepaper1.pdf
McClain, L. (1983). Behavior during examinations: A comparison of “A”, “C” and “F” students.
Teaching of Psychology, 10(2), 69-71.
McGough,J.,Mortensen,J.,Johnson,J.,&Fadali, S. (2001). A Web-based Testing System with DynamicQuestionGeneration.InProceedingsof31st ASEE/IEEE Frontiers in Education Conference, Reno, NV, USA, pp. S3C - 23-8 vol. 3.
Mitkov, R. (2003). Computer-Aided Generation of Multiple-Choice Tests. Proceedings of the HLT-NAACL 2003 Workshop on Building Educational Applications Using Natural Language Processing, (pp. 17–22).
Moodle (2005). http://www.claroline.net. MySql (2005). http://www.mysql.com.
Proctiæ, J., Bojiæ, D., & Tartalja, I. (2001). Test: Tools for Evaluation of Learners’ Tests - A Development Experience. In Proceedings of 31st ASEE/IEEE Frontiers in Education Conference, Reno, NV, USA, pp. F3A - 6-F3A-12 vol. 2
Sakai (2005). Sakai Project, http://www.sakaiproject.org.
Struts(2005).TheApacheStrutsWebApplication Framework, http://struts.apache.org.
Sun, K. T. (2000). An effective Item Selection Method for Educational Measurement. In Proceedingsof InternationalWorkshoponAdvanced
165
eWorkbook
Learning Technologies, Palmerston North, New |
The Learning Manager (2005). http://thelearn- |
Zealand, (pp. 105–106). |
ingmanager.com |
|
WebCT (2005). http://www.webct.com |
166
167
Chapter XIII
Choosing MOODLE:
An Evaluation of Learning Management
Systems at Athabasca
Brian Stewart |
Dietmar Kennepohl |
Athabasca University, Canada |
Athabasca University, Canada |
Derek Briton |
Rory McGreal |
Athabasca University, Canada |
Athabasca University, Canada |
Mike Gismondi |
Christine Nelson |
Athabasca University, Canada |
Athabasca University, Canada |
Bob Heller |
|
Athabasca University, Canada |
|
ABSTRACT
Athabasca University—Canada’s Open University evaluated learning management systems (LMS) for use by the university. Evaluative criteria were developed in order to ensure that different platforms were tested against weighted criteria representing the needs of the university. Three LMSs (WebCt, LotusNotes, and Moodle) were selected for the evaluation. Moodle was chosen with 11 first place ratings and with only one third place rating. Lotus Notes was second with five first place ratings. Moodle garnered 40% of the total weighted score with Lotus Notes getting 32%, and WebCT 29%. The first place preferences within individual criteria show the following: WebCT 6; LotusNotes 7; and Moodle 58.
INTRODUCTION
At Athabasca University (AU), a learning management system (LMS) committee was struck to report to the Academic Council composed of
up to 30 faculty and staff members. The LMS committee discussed strategies for making the transitiontoasinglelearningmanagementsystem as was identified in the AU Strategic University Plan (SUP) (Athabasca University, 2002 #1). In
Copyright © 2009, IGI Global, distributing in print or electronic forms without written permission of IGI Global is prohibited.
the AU SUP developed in 2002, the university community decided that the future development of the university’s learning systems required the adoption of a single learning management system. Three LMSs were proposed for evaluation,
WebCT, Lotus Notes, and Moodle. WebCT was being used by faculty in the Centre for Nursing and Health Studies and in the Master of Distance Education programs. Lotus Notes was being used intwodifferentformats,bytheSchoolofBusiness and the Centre for Innovation and Management. Another LMS, Bazaar, which was developed at AU and was being used by smaller groups in the Master of Arts in Integrated Studies program, was not considered, as it did not garner significant support for continuation among faculty.
The final evaluation of these LMSs was conductedthrougharatingsystem.Thisratingsystem was based on different criteria, including the university’smandateasanopendistancelearning institution, systems administration, initial and ongoing costs, instructional design features, and the teaching and learning tools available.
Mandate
The chosen LMS would need to accommodate the unique nature of AU’s mandate as an open distance education institution. In choosing an LMS, the evaluation committee members considered the need for:
•Flexibilityinstartandenddatesforstudents enrolling in courses
•Support for paced and individualized study courses
•Affordability for students
•Accessibility for students with disabilities
•Access at different connection speeds (dialup vs. high speed)
Choosing MOODLE
Systems Administration
Systems administration features had to facilitate:
•Integration with current registration procedures
•Singlesignoncapabilitiesandcompatibility with current authentication systems
•Flexible administration across centres and programs
•Secure access, authorization, and virus protection
•InteroperabilityusingSCORM,IEEELOM, and CanCore
Cost
The price tag for the system chosen was an important consideration, and included:
•Licensing fees
•Hardware and software costs
•Costs related to integration with the Banner registration system
•Cost of ongoing support (external and inhouse)
•Staff training costs
Instructional Design
Most of the criteria listed under this category in the Appendices tables are self explanatory. Some require further explanation:
•Granularity refers to the LMS’s capacity to separate content from presentation so that the content can be reused or redirected, accommodating content delivery on a variety of devices, including mobile devices and sharing learning objects across courses.
•Templates and modularization refers to the LMS’s capacity for customizing the
168
Choosing MOODLE
look and feel of different AU Centres and programs.
•Student Experience refers to the intuitive logical layout in the LMS from the students’ point of view, if it supports standard Web browsing, multiple platforms, systems, low bandwidth, and Java.
Teaching and Learning Tools
Criteria in this table are self-explanatory. For example, researchers evaluated whether or not the LMS had a workable assignment drop box, or whether or not it could accommodate XML and mobile device delivery. The testers also determined if the LMS had course authoring tools to create effective online quizzes or could display correct mathematical notation. Please see the tables in the Appendix for a complete list of criteria.
Methodology
Fourteenindividualsurveyformsandtwowritten submissions were used in the evaluation. Most of the forms were completed in their entirety, while some evaluators only completed the sections they felt comfortable with. Forms were sent out to all facultywhoexpressedaninterestintheevaluation process, and 17 completed forms were returned
Data was submitted for evaluation using a standard Excel spreadsheet. The spreadsheet allowed the evaluator to enter a priority value, which was used to weight the rating for each criterion. The spreadsheet was used to total the computed values for each submission in a summary table. In cases where a zero was entered, this was removed. In all cases, an evaluation had to rate the three platforms for each criterion. If all three were not evaluated, a value of zero was given for that particular criterion.
In order to ensure that the evaluations were rated on a consistent weighting scale, the submissions were averaged. This was done by taking the values from each evaluator’s priority column and placing them into the criteria weighting average table. A mean average value was then computed for each criterion labeled the average weighting index (AWE). This AWE was applied to each evaluator’s individual platform rating scores, removing the potential for bias to the rating scores from a consistently high weighting by any particular evaluator. It further allows a determination of the criteria that are considered most important to the decision.
The AWE was placed into the Criteria Totals sheet in the formerly labeled priority column. The values for each criterion rating under each platform were compiled as a summation of all the rating values submitted by the evaluators.
1.The summed value was multiplied by the AWE to yield a weighted score for each criterion under each platform.
2.These weighted scores were then added up intheirrespectivecategoriestogivethetotal category weighted score for the respective platform.
3.The category scores were then added up to yield a total platform weighted score.
RESULTS
The LMS Place Preference table shows the evaluators’ choices either from their numeric or their written submissions. The overwhelming choice was Moodle with 11 first place ratings and with only one third place rating from any of the evaluators. Lotus Notes was second with five first place ratings.
The criteria totals table presents the final results. Reflecting the place preferences, Moodle is clearly the group’s preferred choice. Moodle
169
garnered 40% of the total weighted score, with Lotus Notes getting 32% and WebCT 29%. The first place preferences within individual criteria show the following:
WebCT |
Notes |
Moodle |
6 |
7 |
58 |
CONCLUSIONi
Moodle has been selected by the group as the best choice for AU with a clear and unambiguous majority. It should be noted, however, that the characteristicsofthetestinggrouparenonrandom. Not all of the constituencies were equally represented and some, in fact, were over represented. Although, as a group, the sample of testers may be technologically adroit, they also bring biases and preferences to the testing arena, as a result of their background, that are likely reflected in the data. This may in-part explain some surprises in relationtoindividualcriteriaratings.Nonetheless, the strength of preference of the committee for Moodle would indicate that such biases did not determine the final evaluation results and that a broad consensus was reached with regard to the selection of Moodle.
Moodle Next Steps
In order for Moodle to be implemented effectively at AU, it ought to be introduced within a controlledandcoherentframework.Anoperating team should be established and charged with the development and implementation of a plan to commission and operate Moodle. Moodle will affect a broad range of university groups:
•Students
•Help-desk analysts/Call Centre analysts
•Tutors/coaches
•Course coordinators
•Course administrators
Choosing MOODLE
•Faculty
•Course producers
•Course designers
•Course materials providers
•Instructional designers
•System administration
•ITS infrastructural administration
There are also a significant number of tasks to be completed:
Commissioning
•Security
•System availability
•Authentication
•Version control
•System architecture
•Application configuration
Conversion
•Existing online courses
•Existing off-line courses
Training
•Tutors
•Help desk
•Faculty
•Designers
•System administrators
Presentation Framework
•Interface design
•Customising
•Templates
•Accessibility standards
Human Resources
•Training
•Workload assignments
Communication
1.Reporting
2.Informing
170
Choosing MOODLE
Research and Development
1.Test environment
2.Piloting methodology
3.Test procedures
4.Programming standards
5. Commissioning and upgrade procedures
REFERENCES
Selected references the group used during the LMS evaluation:
Commonwealth of Learning LMS Open Source Report. (2003, June). Retrieved March 8, 2007, from http://www.col.org/Consultancies/ 03LMSOpenSource.pdf
Earnshaw, A.C. Why do large IT projects Fail? RetrievedMarch8,2007,fromhttp://www.infoms. com/wp-large.htm
E-learning Accelerator Online Course Inventory List. Retrieved March 8, 2007, from http://intra. athabascau.ca/discussion/accelerator/
Western Consortium for Educational Technology (WCET) LMS Comparison Web
site. Retrieved March 8, 2007, from http:// www.edutools.info/course/compare/compare. jsp?product=142,176,235
Web Sites about Moodle
A list of articles about Moodle:
ht t p://moodle.org /mod /resou rce/view. php?id=102/
Humboldt State University Web site Moodle introduction: http://learn.humboldt.edu/login/index.php
A Blackboard Moodle comparison: http://www.humboldt.edu/~jdv1/moodle/all.htm Lotus
Basic corporate page: http://www-306.ibm.com/software/lotus/ School of Business demo page: http://sb.athabascau.ca/course/demo.nsf
WebCT ViSTa
(Note, at Au, we currently use the CE version)
Main corporate Web page:
http://www.webct.com/
171
Choosing MOODLE
AppENDIX A. LMS EvaEvation Provivional Results
RESULTS
For presentation purposes, the identity of the evaluators as it relates to the weighting index have not been included. The development of the average weighting index (AWE) was an open and collaborative exercise allowing transparency in developing a metric for determining the university’s needs as they relate to an LMS. Individual criteria rating preferences have been withheld, as they are believed to be representations of a personal viewpoint and are private to each evaluator.
The LMS place preference table shows the choices of the evaluators either from their numeric or their written submissions. The overwhelming choice of the evaluators was Moodle, with 11 first places and never lower than a second place rating from any of the evaluators. Lotus Notes was second with five first places.
The criteria weighting average table shows the calculation of the AWE. As stated above, the AWE is a mean average of all the submitted values for each criterion. The AWE values are in bold, while values of 9 and above have also been highlighted, indicating the criteria of most concern to the group. The high proportion of 9 values in the Systems Administration and Mandate indicate common views on the importance of these criteria. The lower AWE values in the Instructional Design and the Teaching and Learning demonstrate a broader range of opinion on the value of each of the criteria.
The potential weight figure is the maximum value the category could obtain if all categories were valued at 10. This is to indicate the relative importance the survey form gives to each category. The actual weight for the category is the realized weighted value for the category after the evaluator’s submissions. The highest actual potential was the Mandate, while Teaching and Learning and Instructional Design were the two lowest.
The criteria totals table presents the final results. The values under each platform have been calculated as stated above. Reflecting the place preferences, Moodle is clearly the preferred choice of the group. Moodle garnered 40% of the total weighted score, with Lotus Notes getting 32% and WebCT 29%.
The first place preferences within individual criteria show the following:
WebCT |
Notes |
Moodle |
6 |
7 |
59 |
Moodle was overwhelmingly seen to provide the best fit for these.
The percentage value to the right of the total weighted score column represents the final proportion of the weighted ratings that were attributed to the respective category. For example, 6% of all scores were attributed to the Mandate category. This can be taken to mean that of the total consideration given to the acceptance of a new LMS, 6% was based on our mandate. Given this, the 41% attributed to teaching and learning would seem appropriate, as it represents the highest category on which the evaluation is based.
The percentage values to the right of each of the LMS totals shows the proportion of the total weighted score gained by the respective platform. Thus, Moodle attained 44% of all scores for the Mandate category. Moodle achieved a higher share in all categories, resulting in a total of 40% of the total weighted
172
Choosing MOODLE
scores. Interestingly, the lowest value for Moodle was 37% in the Teaching and Learning category. This may again reflect the divergence of opinion on requirements and capabilities within this category.
DECISION
Moodle has been selected by the group with a clear and unambiguous majority. It has apparently been seen to offer the best choice among the three options. While there are some surprises in relation to individual criteria ratings, there can be little doubt that there is a consensus in regard to the selection of Moodle.
This work was previously published in International Journal of Distance Education Technologies, Vol. 5, Issue 3, edited by S. Chang and T. Shih, pp. 1-7, copyright 2007 by IGI Publishing (an imprint of IGI Global).
173