3.6. Elasticity Of Supply
Like demand curves, the shape and slope of supply curves of different products will vary, depending on their elasticity. The elasticity of supply measures the proportional change in quantity supplied following a price change. If a change in price has little effect on the quantity of a good or service offered for sale, the supply is inelastic. When a small change in price produces a large change in the quantity offered for sale, then the supply of the good or service is elastic.
At a high price, more items will be offered for sale than at a low price, and vice versa. If, for example, the wages that supermarkets paid for part-time, after-school help were to double from $4.25 to $8.50 per hour, there would be an increase in the number of students applying for those jobs. However, if the price of corn were to double from $2.75 to $5.50 per bushel, farmers could not rush more corn to market. Even though prices have increased by the same percentage, the percentage increase in the number of job applicants will most likely be greater than the percentage increase of the amount of corn offered for sale. This is because their elasticity of supply is different. The supply of after-school workers is relatively elastic, but the supply of corn is inelastic.
Goods or services that are easy to provide have an elastic supply, because sellers can increase or decrease production with price changes. Since there are many unemployed high school students, an increase in wages is likely to generate a large and immediate increase in the number of them willing to take a part-time job. As wages fall, these same job applicants will lose interest. They will decide that at the lower wages they would rather use their time for other things. So, the supply of after-school workers would be described as elastic.
Goods or services requiring time, skills, or techniques that are hard to acquire generally have an inelastic supply. It takes time to grow corn. Although the supply can be increased out of reserves farmers normally set aside for their livestock, eventually they will have to plant more corn. For that reason, the supply of corn is relatively inelastic.
3.7. Equilibrium
Supply and demand schedules show how many items buyers would purchase and how many items sellers would offer at different prices. But by themselves, they do not show at what price goods or services would actually change hands. When the two forces are brought together, however, something quite significant takes place. The interaction of supply and demand will result in an equilibrium or market price. The market price, where supply equals demand, is the one at which goods or services will actually be exchanged.
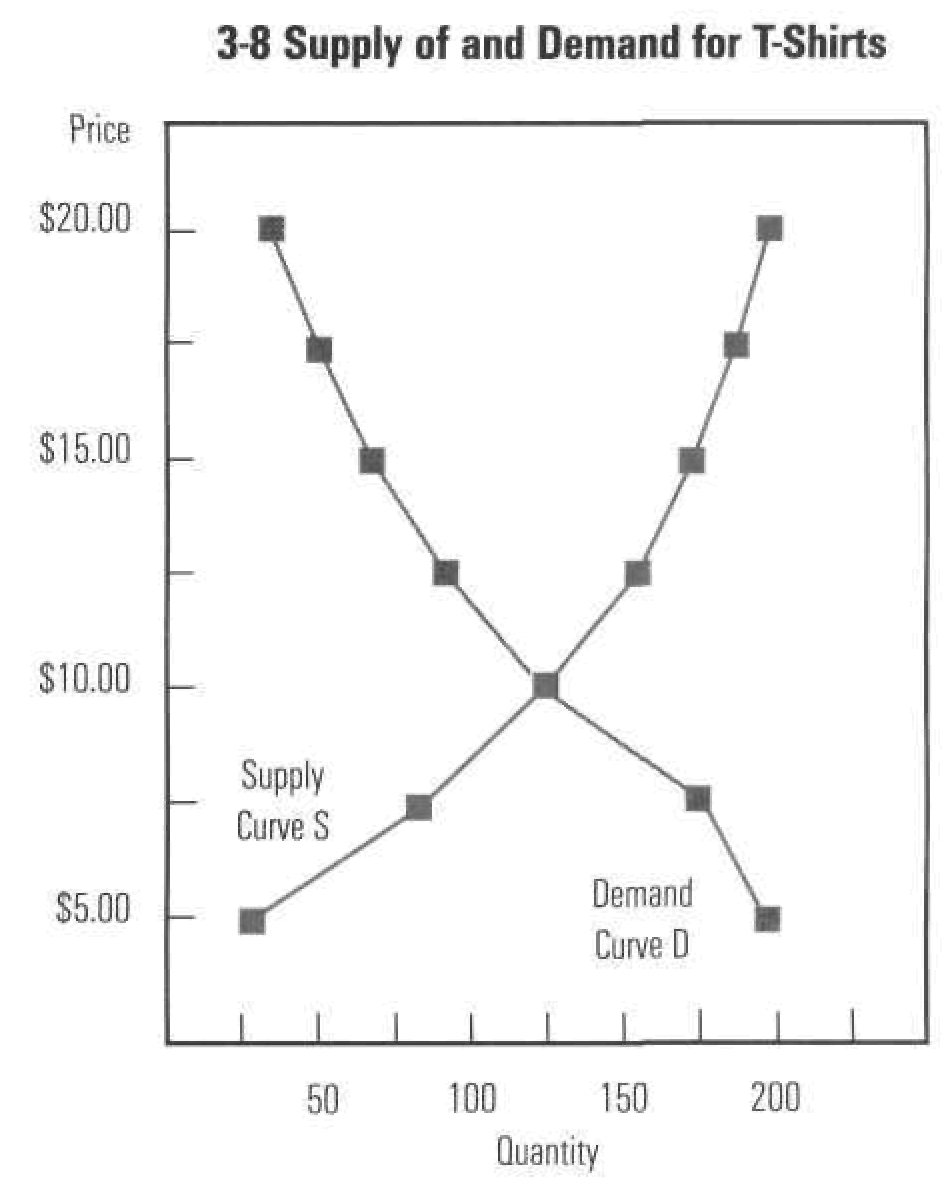
To illustrate, the following chart combines the demand and supply schedules for T-shirts.
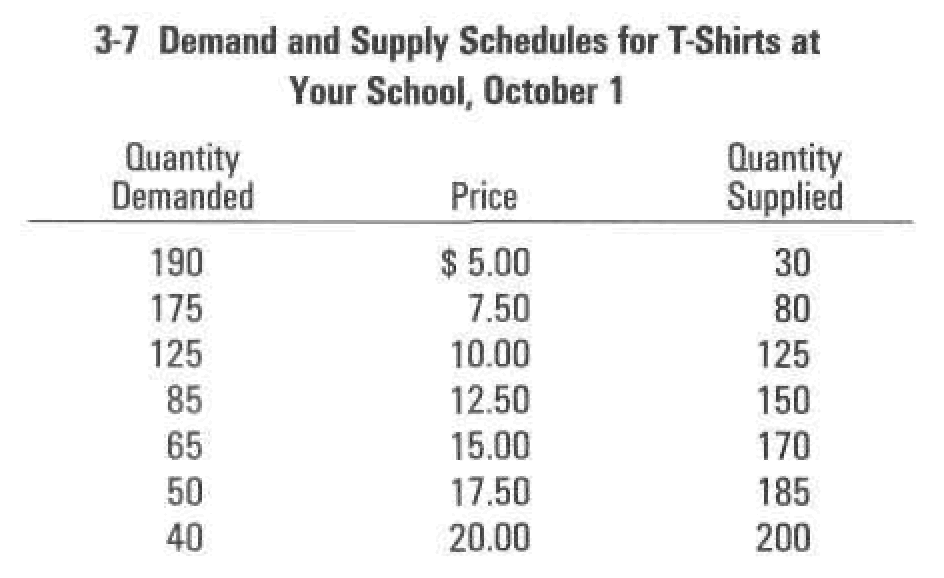
Table 3-7 and Figure 3-8 show that the market price would be $10.00 because at that price the quantity of T-shirts demanded and the quantity supplied are exactly equal. Once an equilibrium price is established, prices will go up and down some, but they seldom stray far from equilibrium. Why do prices become stable at the equilibrium price?
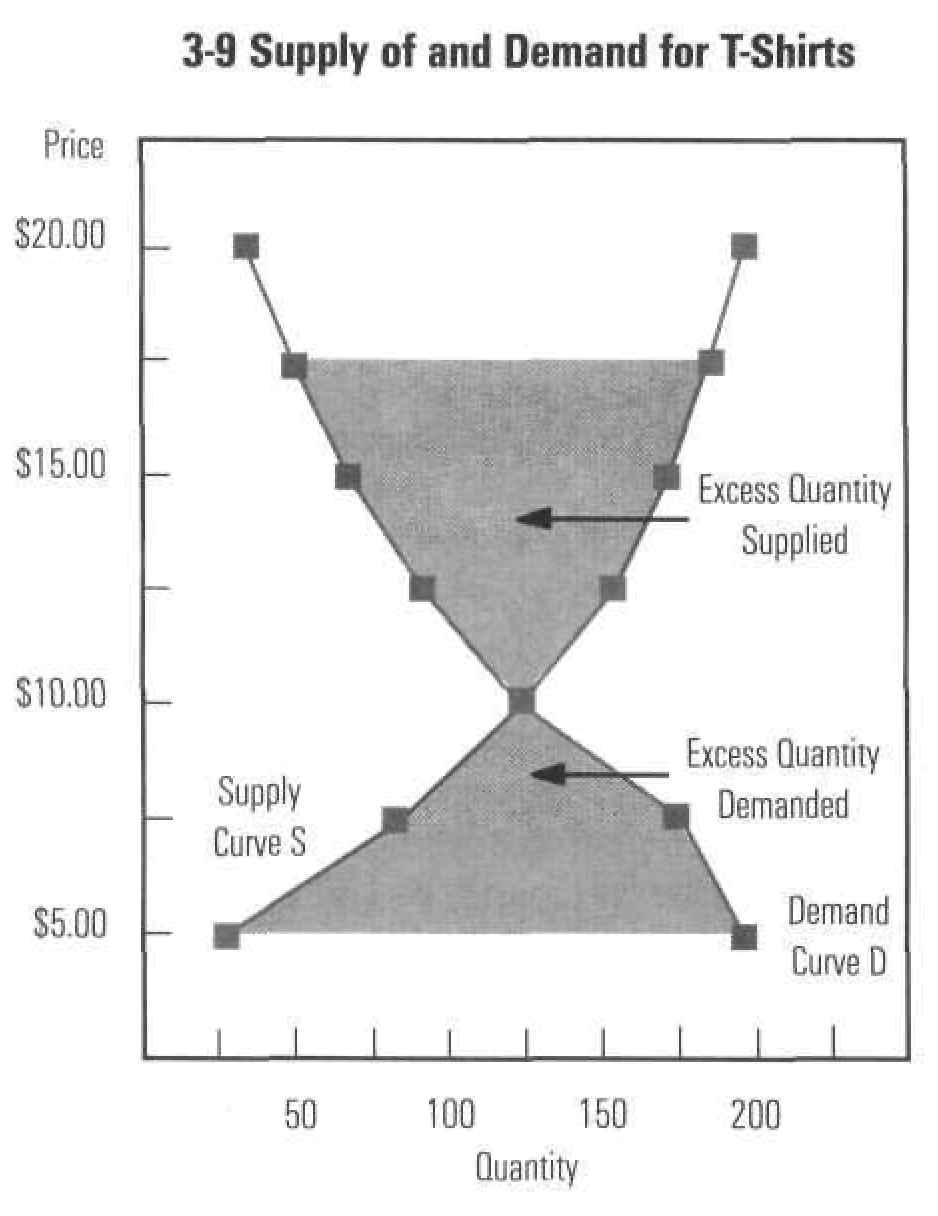
Excess Quantity Demanded. Suppose T-shirts sold for $7.50 on October 1. According to the Demand and Supply Schedule (Table 3-7), at that price consumers would be willing and able to buy 175 shirts. But Lauren and Ralph would not be willing to spend their time printing T-shirts to sell at such a low price. They would supply only 80 shirts at that price. They would realize, however, that they could ask more for their shirts when student demand for shirts is greater than their supply.
They would offer their T-shirts at higher and higher prices until the quantity they were willing to supply equaled the quantity consumers were willing and able to purchase. An excess quantity demanded will lead to price increases, which will continue until demand and supply are equal.
Excess Quantity Supplied. By contrast, suppose that Lauren and Ralph and others began selling T-shirts at $17.50 each. At that price (see Table 3-7) only 50 customers would be interested in a shirt. Lauren and Ralph, however, would hope to sell 185. There would be an excess quantity supplied—135 shirts.
With all those shirts, Lauren and Ralph would need to have a sale. As they lowered prices, they would sell more and more shirts. Here, again, the process would continue until the quantity supplied exactly equaled the quantity demanded.
One may conclude that an excess quantity supplied will result in price decreases until a new equilibrium is reached.
Equilibrium Price and Quantity. In both instances, prices increased or decreased as long as it took buyers and sellers to "clear the market"—to arrive at a price where the supply and the demand for T-shirts were exactly equal.
If, however, T-shirt sales had begun at $10.00, prices would not have changed at all. This is because $10.00 was the equilibrium price where the quantity demanded exactly equaled the quantity supplied. Figure 3-9 summarizes these points graphically.
As long as supply and demand remain unchanged, the equilibrium or market price will remain stable.