

Lectures_micro / Microeconomics_presentation_Chapter_11
.pdf
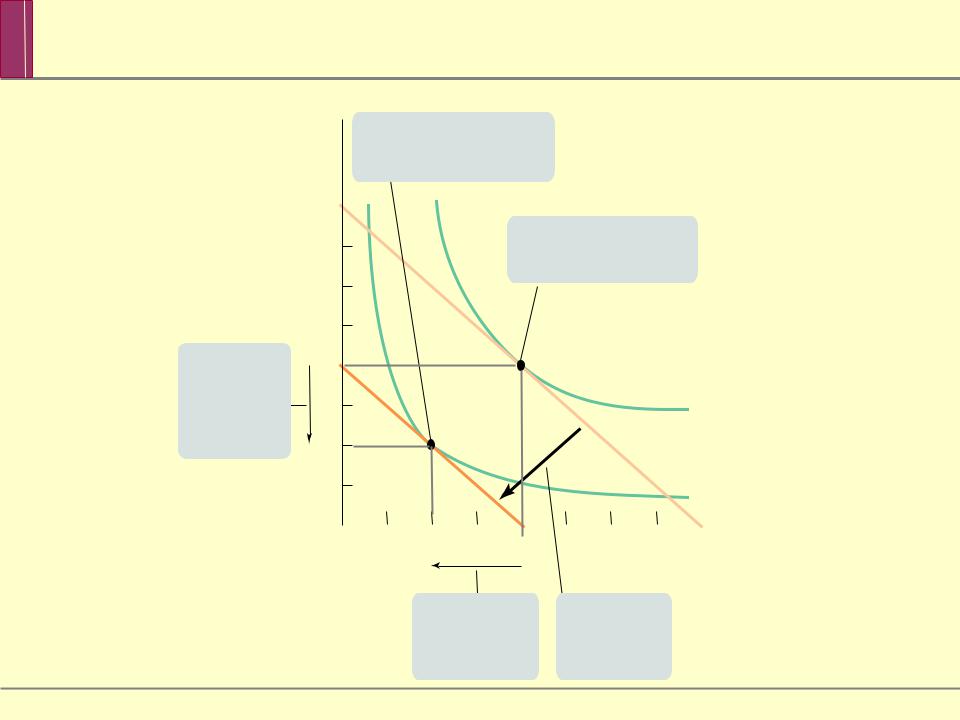
 Effect of a Change in Income on the Budget Line
Quantity of restaurant meals
100
A fall in income results in
a parallel |
shift of |
the |
. |
2
0
parallel outward shift of the budget line.
BL
3
BL
1
Quantity of rooms
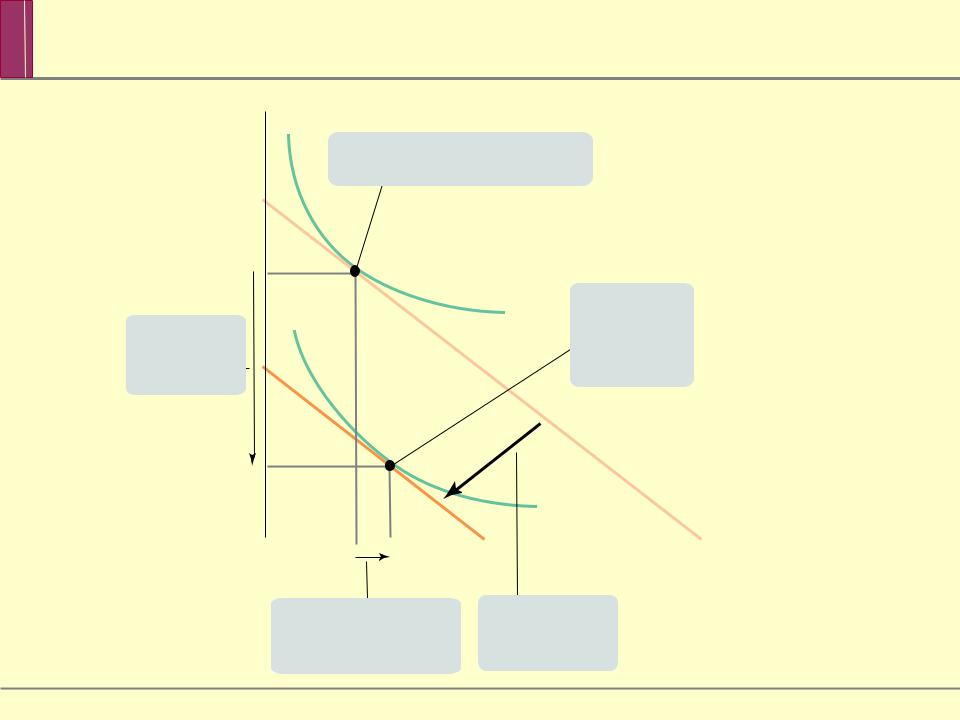
Quantity of restaurant meals
80
50
3. … and a fall in consumption of restaurant meals
0
Goods
Optimal consumption bundle income at of $1,200
|
BL |
|
|
1 |
|
|
Quantity of rooms |
|
2. … resulting |
1. A fall in |
|
in a fall in |
income shifts |
|
consumption |
the budget |
|
of rooms… |
line inward, … |
|
Quantity of restaurant meals
3...and a fall in consumption of restaurant meals
Good
Optimal consumption bundle at income of $2,400
Optimal consumption bundle at income of $1,200
|
|
1 |
|
|
|
Quantity of second-hand furniture |
|
2. … |
a rise |
1. A fall in income |
|
in consumption of |
shifts the budget |
||
second-hand furniture |
line inward, … |
||


 Income and Substitution Effects
The change in a consumer’s optimal consumption bundle caused by a change in price can be decomposed into two effects: the substitution effect, due to the change in relative price, and the income effect, due to the change in purchasing power.
The substitution effect refers to the substitution of the good that is now relatively cheaper for the good that is now relatively more expensive, holding the utility level constant. It is represented by movement along the original indifference curve.


 Income and Substitution Effects
When a price change alters a consumer’s purchasing power, the resulting change in consumption is the income effect. It is represented by a movement to a new indifference curve, keeping the relative price unchanged.
For normal goods, the income and substitution effects work in the same direction; so their demand curves always slope downward.
Although these effects work in opposite directions for inferior goods, their demand curves usually slope downward as well because the substitution effect is typically stronger than the income effect. The exception is the case of a Giffen good.
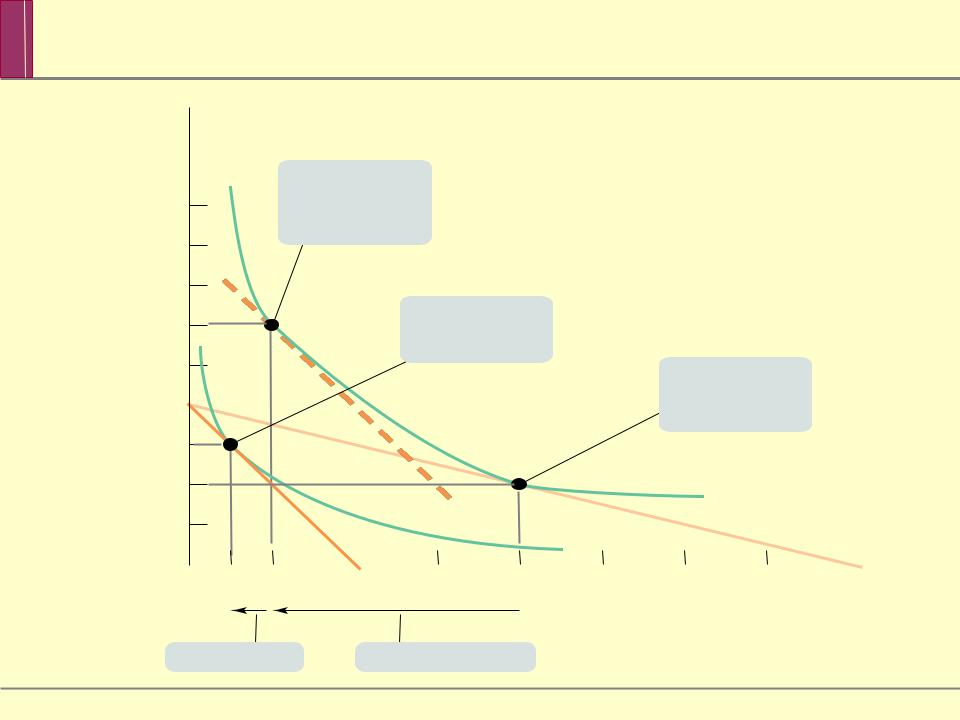
Quantity of restaurant meals
140
Original optimal consumption bundle
I |
BL |
1 |
1 |
10 |
16 |
Quantity of rooms
Income e ect

SUMMARY
1. Preferences can be represented by an indifference curve map, a series of indifference curves. Each curve shows all the consumption bundles that yield a given level of total utility. Indifference curves never cross, and greater distance from the origin indicates higher total utility levels. The indifference curves of ordinary goods slope downward and are convex in shape.

SUMMARY
2. The marginal rate of substitution, or MRS, of R in place of M—the rate at which a consumer is willing to substitute more R for less M—is equal to MUR/MUM and is also equal to minus the slope of the indifference curve when R is on the horizontal axis and M is on the vertical axis. Convex indifference curves get flatter as you move to the right along the horizontal axis and steeper as you move upward along the vertical axis because of diminishing marginal utility: a consumer requires more and more units of R to substitute for a forgone unit of M as the amount of
R consumed rises relative to the amount of M consumed.
3. Most goods are ordinary goods, goods for which a consumer requires additional units of some other good as compensation for giving up some of the good and for which there is diminishing marginal rate of substitution.

SUMMARY
4. A consumer maximizes utility by moving to the highest indifference curve his or her budget constraint allows. Using the tangency condition, the consumer chooses the bundle at which the indifference curve just touches the budget line. At this point, the relative price of R in terms of M, PR/PM (which is equal to minus the slope of the budget line when R is on the horizontal axis and M is on the vertical axis) is equal to the marginal rate of substitution of
R in place of M, MUR/MUM (which is equal to minus the slope of the indifference curve). This gives us the relative price rule: at the optimal consumption bundle, the relative price is equal to the marginal rate of substitution.

SUMMARY
5. When the marginal rate of substitution is constant, two goods are perfect substitutes and indifference curves are straight lines: there is only one relative price at which the consumer is willing to purchase both goods. When a consumer wants to consume the two goods in the same ratio, regardless of the relative price, the goods are perfect complements. In this case, the indifference curves form right angles and the marginal rate of substitution is undefined.