

Lectures_micro / Microeconomics_presentation_Chapter_11
.pdf
 Preferences and Choices
When we say that two consumers have different preferences, we mean that they have different utility functions.
This, in turn, means that they will have indifference curve maps with different shapes.
And those different maps will translate into different consumption choices, even among consumers with the same income who face the same prices.
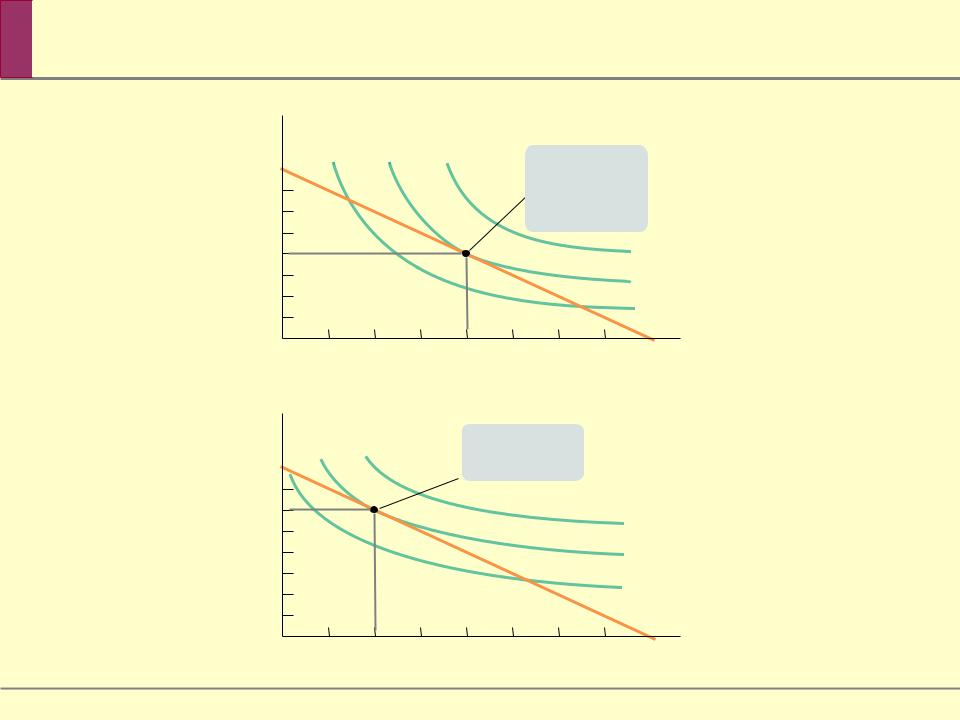

 Differences in Preferences


 A Test for Rationality


 Using Indifference Curves: Substitutes and Complements
What determines whether two goods are substitutes or complements?
It depends on the shape of a consumer’s indifference curves.
This relationship can be illustrated with two extreme cases: the cases of perfect substitutes and perfect complements.
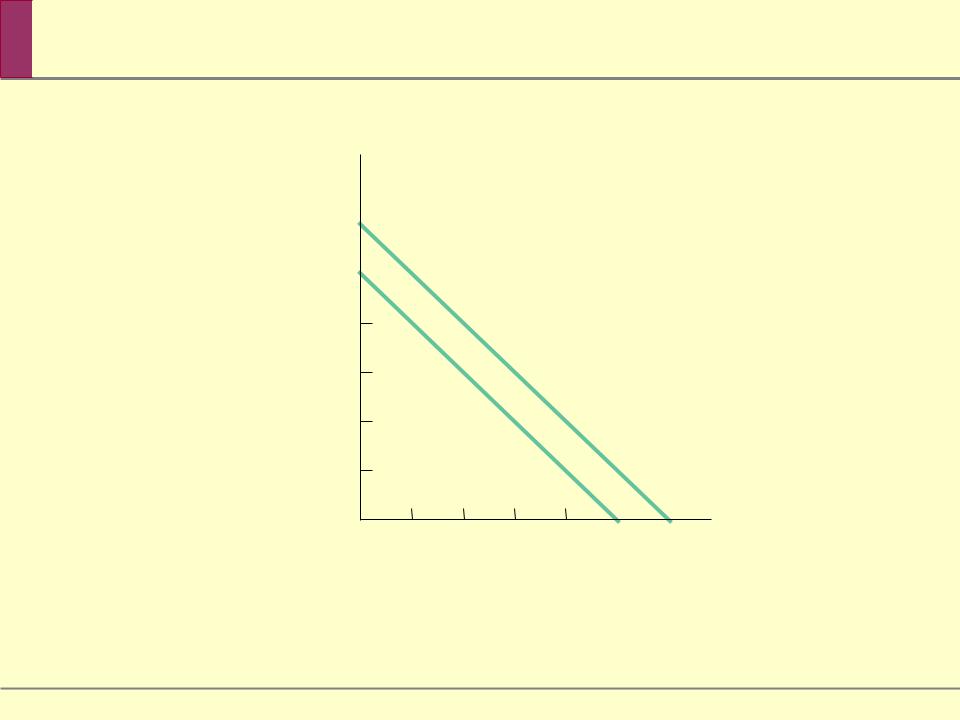

 Perfect Substitutes
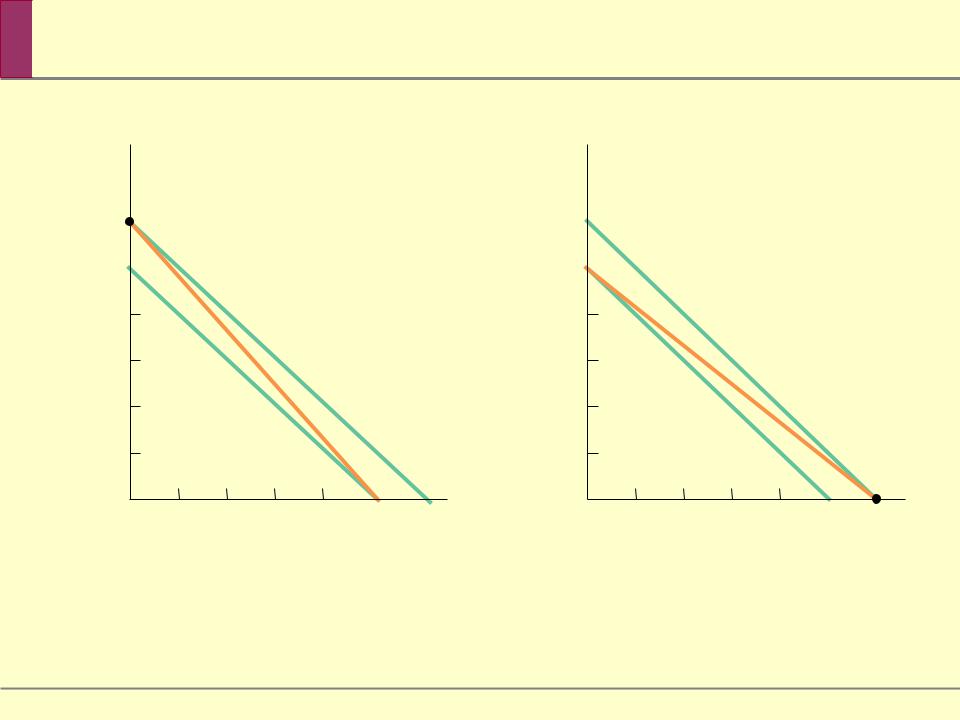

 Consumer Choice Between Perfect Substitutes
(a) Cokie Buys Only Peanut Butter Cookies
Quantity of |
|
|
|
|
|
|
peanut |
|
|
|
|
|
|
butter cookies |
A |
|
|
|
|
|
|
|
|
|
|
|
|
8 |
|
|
|
|
|
|
6 |
|
|
|
|
|
|
4 |
|
|
|
|
|
|
2 |
|
|
|
|
BL |
|
|
|
|
|
|
|
|
|
|
|
|
|
I |
I |
0 |
2 |
4 |
6 |
8 |
10 |
12 |
|
|
|
|
|
Quantity of |
|
|
|
|
|
|
chocolate chip |
|
|
|
|
|
|
|
cookies |
(b) Cokie Buys Only Chocolate Chip Cookies
Quantity of |
|
|
|
|
|
|
peanut |
|
|
|
|
|
|
butter |
|
|
|
|
|
|
cookies |
|
|
|
|
|
|
10 |
I 1 |
|
|
|
|
|
|
BL |
|
|
|
|
|
8 |
|
|
|
|
|
|
6 |
|
|
|
|
|
|
4 |
|
|
|
|
|
|
2 |
|
|
|
|
|
|
0 |
2 |
4 |
6 |
8 |
10 |
12 |
|
|
|
|
|
Quantity of |
|
|
|
|
|
|
chocolate chip |
|
|
|
|
|
|
|
cookies |
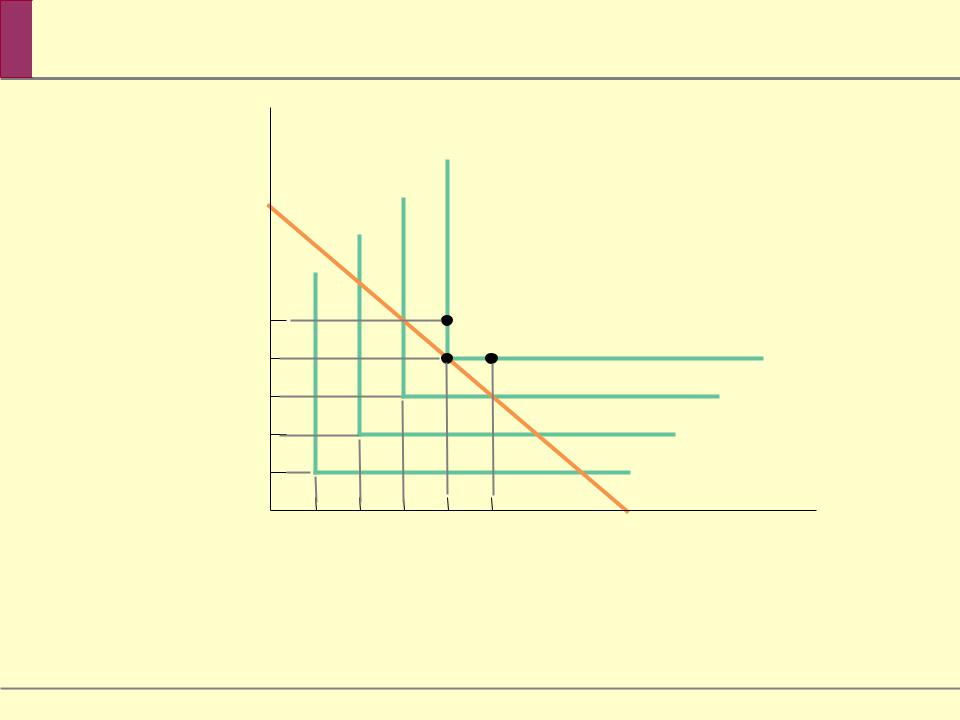

 Perfect Complements


 Prices, Income, and Demand
How would our consumption choice change if either the prices of goods or our income change?
First, let’s see the effects of a price increase illustrated in the following figure.
Then, we will consider the impact of a change in income.
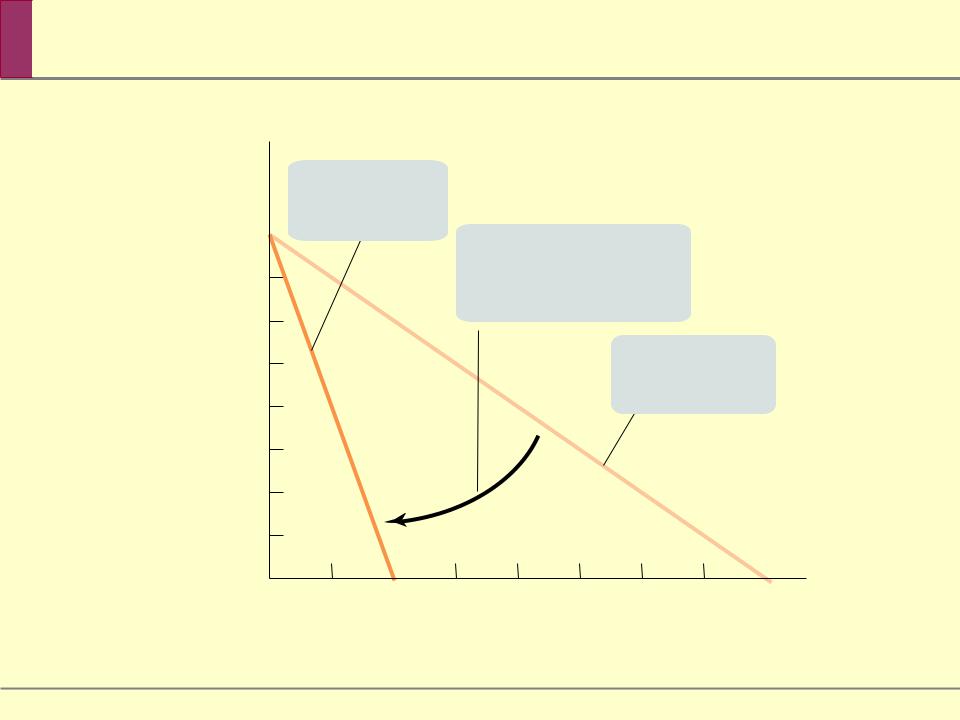

 Effects of a Price Increase on the Budget Line
Quantity of |
|
restaurant |
New BL: |
meals |
|
|
price of rooms = |
|
$600 |
relative price of rotates the
line inward.
Original BL:
price of rooms =
$150
30
20
1
0
Quantity of rooms


 Responding
Quantity of
restaurant
New
meals
70
3. … and increases restaurant meal consumption.
30
20
BL
1
0
Quantity of rooms
1.An increase in the relative price of rooms rotates the budget line…