

glossary-legends(Джепессен иструкция )
.pdfSID/STAR-4 |
INTRODUCTION |
2 MAR 12 |
GRAPHIC
Type of procedure. Arrival/Departure code. Arrival/Departure name.
Database identifiers are included when different than the Arrival/Departure code or name. Specified qualifying statements, such as runways, navigational requirements, or aircraft type. Runway layout is provided for all hard surface runways.
Arrival/Departure airport is highlighted with circular screen.
8 — Arrival/Departure track of procedure represents a common course used by multiple transitions. 9 — Airport is listed only when SID, DP, or STAR also serves multiple airports, which are screened. 10 — Starting Point of STAR and end point of SID/DP procedures are shown prominently.
11 — T placed after altitude denotes a Minimum Obstruction Clearance Altitude (MOCA).
12 — Radial and DME forms the fix. The DME, if not displayed is the segment distance, if shown it is the total distance from the forming Navaid.
13 — Altitude T is placed when the altitude changes along a track at other than a Navaid.
14 — Certain Special Use Airspace Areas are charted when referenced in procedure source.
© JEPPESEN, 2012. ALL RIGHTS RESERVED.

2 MAR 12 |
INTRODUCTION |
SID/STAR-5 |
15 — Transition name placed on the last segment of the SID/DP and the first segment of STAR procedures. 16 — Minimum Enroute Altitude (MEA) unless otherwise designated.
17 — Segment distance.
18 — Coordinates of fix or Navaids.
19 — Formation radials are presented in many ways based on Navaid position & compositional space. 20 — Route identification code.
21 — At the Changeover point, the pilot changes primary navigation to the next Navaid. 22 — Transition track.
23 — VOR radial on which aircraft is flying inbound towards the Navaid.
END OF SID/DP AND STAR LEGEND
© JEPPESEN, 2012. ALL RIGHTS RESERVED.
12 APR 13 |
INTRODUCTION |
AIRPORT-1 |
AIRPORT CHART LEGEND
AIRPORT
NOTE: This section of the Jeppesen legend provides a general overview regarding the depiction of airport diagrams and associated information.
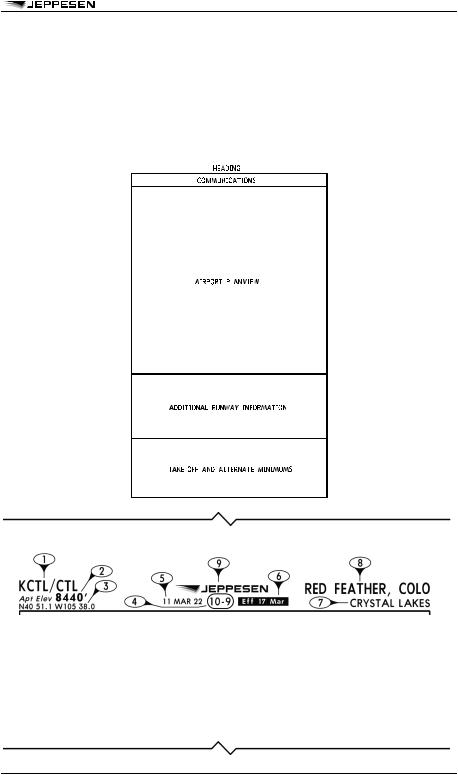
The following briefly explains the symbology used on airport charts throughout the world. Not all items explained apply to all charts. The airport chart is divided into specific areas of information as illustrated below. To enhance the usability for larger airports, the Communications and Airport Planview sections are depicted on one side of the chart. An added Notes Section along with the Additional Runway Information, Take-off minimums, and Alternate minimums sections are depicted on the reverse side of the chart.
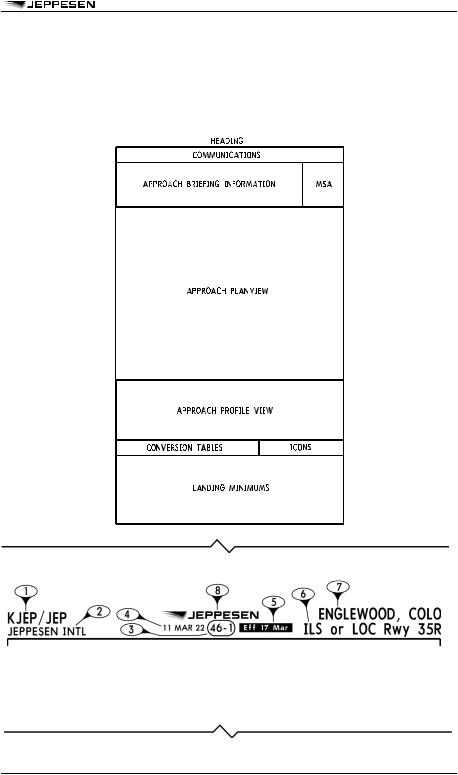
FORMAT
HEADING
1 — ICAO indicators and IATA airport identifiers. |
5 — |
Chart revision date. |
2 — Airport elevation. |
6 — |
Chart effective date. |
3 — Airport geographic latitude and longitude shown |
7 — |
Airport name. |
in degrees, minutes, and tenths of minutes. |
8 — |
Geographic location name. |
4 — Chart index number. Same as the first approach |
9 — |
Jeppesen company logo. |
chart when the airport chart is printed on the |
|
|
reverse side. |
|
|
© JEPPESEN, 2012, 2013. ALL RIGHTS RESERVED.
AIRPORT-2 |
INTRODUCTION |
12 APR 13 |
AIRPORT CHART LEGEND
COMMUNICATIONS
For Communications Information See Approach Chart Legend — Page APPROACH-2
AIRPORT PLANVIEW
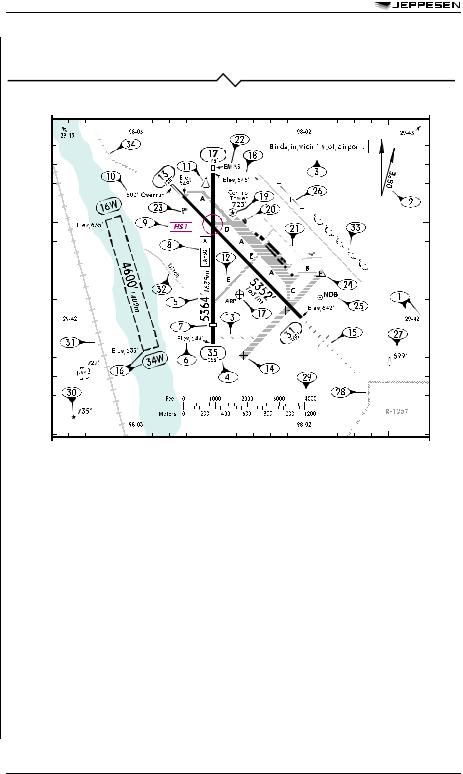
1 — The planview is a "To Scale" graphical depiction of the airport layout, a latitude/longitude grid in degrees, minutes, and tenths of minutes is depicted along the inside of the neat line.
2 — The airport magnetic variation is graphically and numerically depicted.
3 — Airport operational notes are placed within the planview. Notes pertaining to a specific area are placed within the area or tied to it.
4 — Runway designators (numbers) are magnetic unless followed by a "T" for true. Runway bearings are included when known.
5 — Physical length of the runway which does not include stopways, overruns, or adjustments for displaced thresholds. Shown in feet with the meter equivalent included at International Airports.
6 — The runway end elevation is depicted when known.
7 — When applicable, the physical location of displaced thresholds along the runway are shown. 8 — Stopping points along the runway are depicted for Land and Hold Short Operations.
9 — "Hot Spot" areas are depicted along with a corresponding label when applicable. A textual description is included within the planview or below the additional runway information band.
10 — When available, stopways and overruns are depicted with the applicable length.
11 — When known, the location of RVR transmissometers are shown with any applicable identifiers.
12 — All active taxiways and ramp areas are depicted using a grey area fill color. All taxiway identifiers and ramp names are included when known.
13 — All known permanently closed taxiways are shown.
14 — One of two depictions is used for closed runways depending on the nature of the closure:
a.Lengths and designators (numbers) are retained when the closure is temporary.
b.Lengths and designators (numbers) are removed when the closure is permanent. 15 — The configuration and length of all known approach light systems are shown.
©JEPPESEN, 2012, 2013. ALL RIGHTS RESERVED.
2 MAR 12 |
INTRODUCTION |
AIRPORT-3 |
16 — All seaplane operating areas/water runways a re shown. Runway numbers are followed by a "W", the physical length is included along with elevations.
17 — The geographical location of the Airport Reference Point (ARP) is depicted when known. 18 — Areas under construction are outlined using a light dashed line.
19 — When known, the location of the airport identification beacon is shown. 20 — Buildings on or near the airport are depicted.
21 — Roads on or near the airport are depicted.
22 — Location of Engineered Materials Arresting System (EMAS) pads are shown and labeled. 23 — All known wind direction indicators are depicted.
24 — Helicopter landing pads/areas.
25 — The geographical location of on airport VORs and NDBs is indicated and labeled. 26 — Pole lines that are on or near the airport are depicted.
27 — All known terrain high points and man-made structures with an elevation 50 feet above the nearest rwy end elevation are depicted. The applicable symbol and elevation are shown.
28 — Special use airspace, area outline and designator are depicted. A note, "Entire Chart Lies Within R-XXXX", is shown when the entire chart planview falls within a particular area.
29 — A scale for both feet and meters that is equivalent to the chart scale is shown.
30 — Hazard beacons within the planview are depicted along with an elevation if known. 31 — Railroad tracks on or near the airport are shown.
32 — Ditches in the vicinity of the airport are depicted.
33 — Tree lines are depicted. An open ended tree line indicates the border of a forested area. 34 — Bluffs are shown with the arrows of the symbol pointing down, or toward lower elevation.
ADDITIONAL RUNWAY INFORMATION BAND
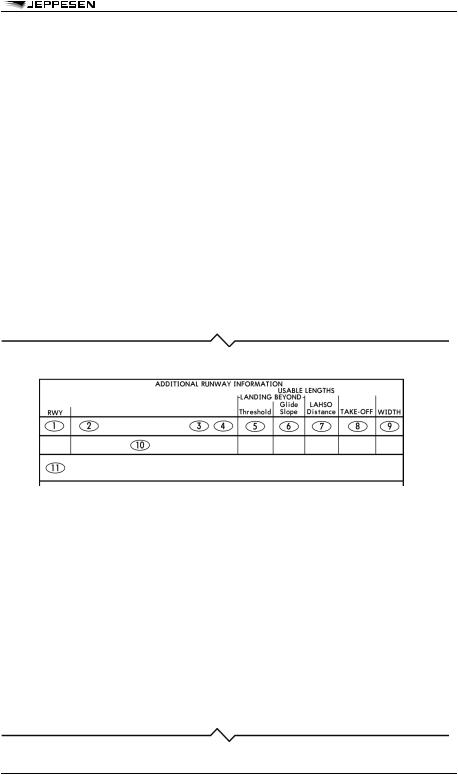
NOTE: For an explanation of the abbreviations used within the Additional Runway Information Band, see the Abbreviations Section. All distances depicted in the Additional Runway Information Band are in feet, the meter equivalent is also shown at International airports.
1 — Runway designators/numbers are depicted in the upper left and lower right corners of the box. All information shown to the right within the band applies to the indicated runways. When the information differs between runways, the band is separated with a line.
2 — All operational runway lighting and approach light systems are listed. 3 — Runway surface treatment (grooving) is indicated.
4 — "RVR" is depicted when one or more transmissometers are installed along the runway.
5 — When different from the physical runway length, landing distance beyond threshold is shown.
6 — When applicable, the distance from a point abeam the glide slope transmitter to the roll-out end of the rwy is shown. For PAR, the distance is from the GS interception with the runway.
7 — At airports with Land And Hold Short Operations (LAHSO), the distance from the runway threshold to the designated hold short point is shown.
8 — When take-off length is restricted, the physical rwy distance available for take-off is shown. 9 — The physical width of the runway is shown.
10 — This band is expanded to show information for all operational runways in numerical order. 11 — All notes related to the runway information depicted are shown in this section.
© JEPPESEN, 2012. ALL RIGHTS RESERVED.
AIRPORT-4 |
INTRODUCTION |
2 MAR 12 |
TAKE-OFF MINIMUMS
Publication of take-off minimums does not constitute authority for their use by all operators. Each individual operator is responsible for ensuring that the proper minimums are used based on authorization specific to their type of operation.
Wide variations exist regarding take-off minimums depending on the governing agency, typically though they consist of a visibility/ceiling and associated required conditions for use.
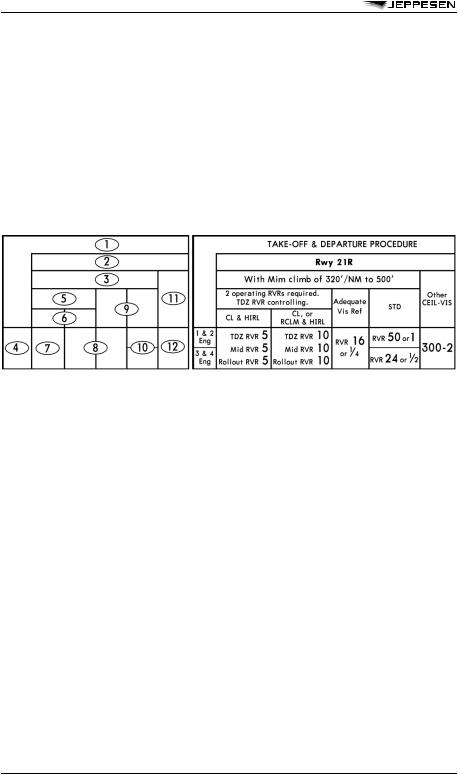
Generally, take-off minimums are shown in order of best (lowest) to worst (highest) starting at the top left and progressing to the bottom right of the format. This applies to the overall minimums box as well as for a particular runway or set of runways.
Visibilities and ceilings are shown in feet, statute/nautical miles, meters, and kilometers while RVR is shown in hundreds of feet and whole meters. Values in feet and statute/nautical miles are not labeled, for example; "RVR50" means 5000 feet RVR, "1" means 1 mile, and "300" means 300 feet. Values in meters are labeled with an "m" and kilometers with a "km". Altitudes listed within climb gradient requirements are above Mean Sea Level (MSL). Ceilings specified for take-off are heights Above Airport Level (AAL).
Typical format used for charting take-off minimums:
1 — Take-off minimums header indicating the contents of the minimums box.
2 — Runway number/numbers, minimums below apply to the designated runway. 3 — General conditions, those that affect a wide range of the depicted minimums.
4 — Type of aircraft information is normally depicted here, typically in the form of number of aircraft engines or aircraft approach categories.
5 — More specific conditions, those that affect only a few of the minimums.
6 — Very specific conditions, those that affect only the minimums directly below.
7 — Ceilings and or RVR/visibilities authorized based on the conditions and runways listed above. When a ceiling and visibility are listed, both are required. In this format example, these minimums would represent the "best" (lowest) available take-off minimums.
8 — Ceilings and or visibilities authorized based on the conditions above, minimums typically become "higher" with less restrictions.
9 — The use of abbreviations is prevalent within the take-off minimums band given that many of the conditions/restrictions have lengthy explanations. See the Chart Glossary and/or Abbreviations sections for a more detailed description.
10 — The take-off minimums for a given set of conditions can differ based on aircraft type. Separate minimums are depicted for each aircraft type scenario.
11 — Usually the term, "Other" is used to describe take-off minimums having no conditions.
12 — This being the farthest minimum box to the right, it would generally contain the highest set of take-off minimums with the least number of conditions for that particular runway.
© JEPPESEN, 2012. ALL RIGHTS RESERVED.
2 MAR 12 |
INTRODUCTION |
AIRPORT-5 |
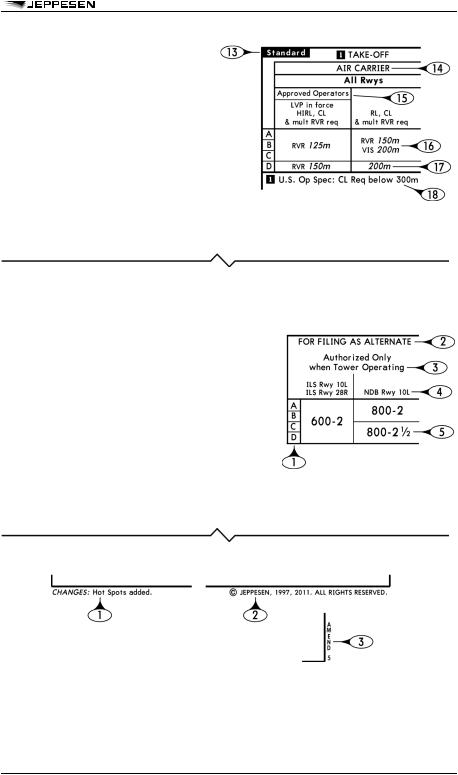
13 — Indicates take-off minimums are compliant with EU-OPS 1 regulations but never below State published values.
14 — The "Air Carrier" label indicates that the depicted take-off minimums are applicable for Air Carrier operations only.
15 — All operators should be aware that special approval, which may include unique training, is required prior to the use of these minimums.
16 — When the RVR and meteorological visibility values differ, both are shown and labeled accordingly.
17 — When the charted value can be used as either an RVR or meteorological visibility, no label is shown.
18 — All notes that pertain directly and only to the charted take-off minimums are depicted directly under and adjacent to the take-off minimums box.
ALTERNATE MINIMUMS
Only those alternate minimums that have been published by the governing State Authority specifically for the landing airport will be charted. The values shown will be those supplied by the State.
1 — Typically alternate minimums are based on the circle-to-land minimums applicable to the available approach procedures at the landing airport. As a result, the subsequent alternate minimums relate to the aircraft approach categories.
2 — The alternate minimums box is labeled as such.
3 — All applicable conditional notes are shown directly above the minimums they apply to.
4 — Approach procedure idents for all appropriate procedures with the applicable alternate minimums charted directly below.
5 — Ceilings and visibilities used in alternate minimums are shown in feet, statute/nautical miles, meters, and kilometers. Values in feet and statute/nautical miles are
not labeled, for example; "800" means 800 feet and "2 1/2" means 2 and 1/2 miles. Values in meters are labeled with an "m" and kilometers with a "km".
CHART BOUNDARY LINE INFORMATION
1 — A brief summary of the changes applied to the chart during the last revision. 2 — Jeppesen Copyright label.
3 — Shown when source amendment information has been supplied by the State. Normally these amendment numbers directly relate to the take-off or alternate minimums.
END OF AIRPORT CHART LEGEND
© JEPPESEN, 2012. ALL RIGHTS RESERVED.
2 MAR 12 |
INTRODUCTION |
APPROACH-1 |
APPROACH CHART LEGEND
NOTE: This section of the Jeppesen legend provides a general overview regarding the depiction of approach procedures.
Approach charts are graphic representations of instrument approach procedures prescribed by the governing authority. The following briefly explains the symbology used on approach charts throughout the world. Not all items explained apply to all charts. The approach chart is divided into specific areas of information as illustrated below.
FORMAT
HEADING
1 — ICAO indicators and IATA airport identifiers. |
5 — Chart effective date. |
||
2 — |
Airport name. |
6 — |
Procedure identification. |
3 — Index number. Charts are sequenced by |
7 — |
Geographical location name. |
|
|
runway number within similar type approaches. |
|
|
4 — |
Chart revision date. |
8 — |
Jeppesen company logo. |
© JEPPESEN, 2012. ALL RIGHTS RESERVED.

APPROACH-2 |
INTRODUCTION |
2 MAR 12 |
COMMUNICATIONS
1 — Communications are shown left to right in the |
6 — |
Indicates that radar services are available. |
order of normal use. |
|
|
2 — Communication service, call sign is omitted |
7 — Sectors are defined for each frequency when |
|
when the service is broadcast only. |
|
applicable. |
3 — Functionality of the service is shown when |
8 — |
Indicates the service is part time. |
applicable. |
|
|
4 — The service call sign is shown when transmit & |
9 — When the service is a secondary function, the |
|
receive or transmit only operations are available. |
|
call sign is omitted. |
5 — All available primary frequencies are depicted.
APPROACH BRIEFING INFORMATION
1 — Approach primary Navaid.
2 — Final approach course bearing.
3 — Crossing altitude at the FAF. Glide slope crossing altitude for precision approaches. Procedure altitude (Vertical Descent Altitude or Minimum Crossing Altitude) for non-precision approaches.
4 — Lowest DA(H) or MDA(H).
5 — Airport Elevation and Touchdown Zone/Threshold Elevation.
6 — Textual description of the Missed Approach Procedure.
7 — Altimeter Setting Information, Barometric Pressure Equivalents are included. 8 — Airport/Procedure Transition Level and Altitude.
9 — Notes applicable to the Approach Procedure.
MINIMUM SAFE or SECTOR ALTITUDE (MSA)
1 — Sector defining Radial/Bearing, always depicted to the Navaid/Fix or Airport Reference Point (ARP).
2 — Minimum safe/sector altitude.
3 — Navaid/Fix/ARP the MSA is predicated on.
NOTE: Normal coverage is a 25 NM radius from the forming facility/fix. If the protected coverage is other than 25 NM, that radius is depicted below the forming facility/fix.
© JEPPESEN, 2012. ALL RIGHTS RESERVED.
3 AUG 12 |
INTRODUCTION |
APPROACH-3 |
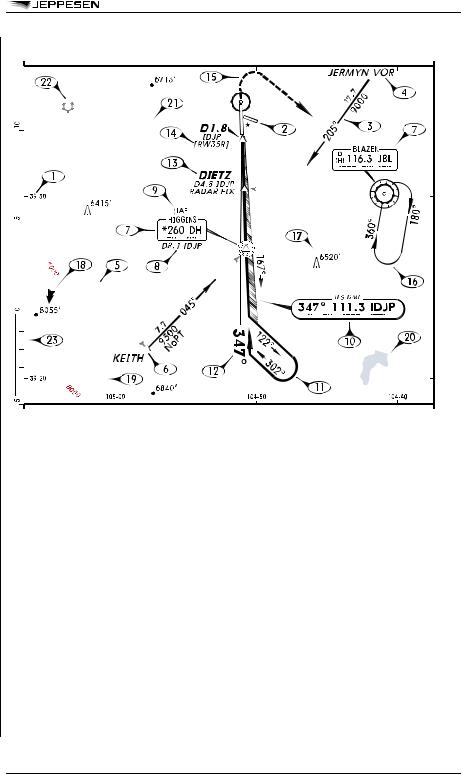
APPROACH PLANVIEW
1 — The planview is a graphical "To Scale" depiction of the approach procedure. Latitude and longitude tics are shown in 10 minute increments along the neatline.
2 — Complete runway layout is depicted for the primary airport.
3 — Approach transitions are depicted with a medium weight line. The bearing is normally inset within the track with the mileage and associated altitude placed along the track.
4 — Off-chart origination navaid/waypoint name. Navaid frequency, ident, and Morse code is shown when required for fix formation.
5 — VOR cross radials and NDB bearings used in forming a fix. DME formation distances are shown when applicable. Navaid frequency, ident, and Morse code shown as required.
6 — Airspace fixes depicted using several different symbols according to usage.
7 — Navaid boxes include the navaid name, identifier, Morse code, and frequency. A letter "D" indicates DME capability with an asterisk indicating part time.
8 — Substitute fix identification information located below facility box when applicable.
9 — Initial Approach Fixes and Intermediate Fixes are labeled as (IAF) and (IF) respectively.
10 — A shadowed navaid box indicates the primary navaid upon which lateral course guidance for the final approach segment is predicated.
11 — The final/intermediate approach course is indicated with a heavy weight line.
12 — The final approach course bearing shown in bold text, with a directional arrow as needed. 13 — Airspace fix names are shown near or tied to the fix, formational info is placed below name. 14 — Jeppesen-derived database identifiers are depicted when different from State-supplied name. 15 — The missed approach segment is shown with heavy weight dashed line work.
16 — Holding/Racetrack patterns are shown with both inbound and outbound bearings. Restrictions are charted when applicable, heavy weight tracks indicate the holding/racetrack is required.
17 — Some, but not all, terrain high points and man-made structures are depicted along with their elevations. Generally only high points 400’ or more above the airport elevation are shown.
© JEPPESEN, 2012. ALL RIGHTS RESERVED.