

202___
.pdfAdditional Reading
Additional Reading
I. Texts for Comprehension
A Model of the Demand for Tube Journeys
In the early 1980s there was a controversy over the “Fares Fair” policy of cutting bus and tube fares in London. Some people thought low fares would increase passengers and bring in extra revenue for London Transport, which runs the bus and tube services. Others thought that low fares would lead to disastrous losses in running London Transport. Eventually the matter was referred to the courts. Suppose you had been a consultant brought in to analyze the relationship between tube fares and revenue from running the tube: how would you have analyzed the problem?
To organize our thinking, or – as economists describe it – to build a model, we require a simplified picture of reality which picks out the most important elements of the problem. We begin with the simple equation.
Total fare collection = fare number of passengers |
(1) |
In this stark form, equation (1) emphasizes, and thus organizes our thoughts around, two factors: the fare and the number of passengers. London Transport directly controls the fare, but can influence the number of passengers only through the fare that is set. (Cleaner stations and better services might also encourage passengers, but we neglect these effects for the moment.)
It might be argued that the number of passengers is determined by habit, convenience, and tradition, and is therefore completely unresponsive to changes in fares. This is not the view or model of traveler behavior that an economist would initially adopt. It is possible to travel by car, bus, taxi, or tube, and decisions about a mode of transport are likely to be sensitive to the relative costs of the competing alternatives. Thus in equation (1) we must not view the number of passengers as fixed but develop a
111

Английскийязык.
Лексические основы чтения текстов по экономике
‘theory’ or ‘model’ (we use these terms interchangeably) of what determines the number of passengers. We must model the demand for tube journeys.
We can study the theory of demand in detail. Applying a little common sense, we can probably work out the most important elements straight away. First, the fare itself matters. Other things equal, higher tube fares reduce the quantity of tube journeys demanded. Of course, what matters is the price of the tube relative to the price of other means of transport – cars, buses, and taxis. If their prices remain constant, lower tube fares will encourage tube passengers. Rises in the price of these other means of transport will also encourage tube passengers even though tube fares remain unaltered.
We now have a bare-bones model of the demand for tube journeys. We summarize this model in the formal statement:
Quantity of tube journeys demanded = f (tube fare, taxi fare, |
(2) |
petrol price, bus fare, ...) |
|
This statement reads as follows. The quantity of tube journeys ‘depends on’, or ‘is a function of’, the tube fare, the taxi fare, petrol prices, bus fares, and some other things. The notation f is just a shorthand for ‘depends on all the things listed inside the brackets’. In equation (2) we have named explicitly the most important determinants of the demand for tube journeys. The row of dots reminds us that we have omitted some possible determinants of the demand for tube journeys in an effort to simplify our analysis. For example, tube demand probably depends on the temperature. It gets very uncomfortable in the underground when it is very hot. Since the purpose of our model is to study changes in the number of tube passengers, it will probably be all right to neglect the weather provided weather conditions are broadly the same every year.
To answer our original question, it is not sufficient to know the factors on which the demand for tube journeys depends. We need to know how the number of passengers varies with each of the factors we have identified in our model. Other things equal, we assume that an increase in tube fares will reduce tube passengers
112

Additional Reading
and that an increase in the price of any of the competing modes of transport will increase tube passengers. To make real progress, we shall somehow have to quantify each of these separate effects. Then, given predictions for bus and taxi fares and the price of petrol, we would be able to use our model to predict the number of tube passengers who would want to travel at each possible tube fare that might be set by London Transport. Multiplying the fare per journey by the predicted corresponding number of journeys demanded at this fare, we could then predict London Transport revenue given any decision about the level of tube fares.
Writing down a model is a safe way of forcing ourselves to look for all the relevant effects, to worry about which effects must be taken into account and which are minor and can probably be ignored in answering the question we have set ourselves. Without writing down a model, we might have forgotten about the influence of bus fares on tube journeys, an omission that might have led to serious errors in trying to understand and forecast revenue rose from tube fares.
You have read the text. Check your understanding:
1)What controversy was there in 1980 over the ‘Fares Fair’ policy of cutting bus and tube fares in London?
2)How would economists organize the solution of fares problem?
3)How can the equation one organize our thoughts?
4)What organization directly controls the fares?
5)How can London Transport influence the number of passengers?
6)Is the number of passengers responsive to the changes in fares?
7)What theory or model should an economist develop to solve the problem of the number of passengers?
8)What is the relationship between fares and demand for tube journeys?
9)What is the dependence of the quantity of tube passengers on the fares of other means of transport?
10)For what purpose can we use the model given in the text?
113
Английскийязык.
Лексические основы чтения текстов по экономике
The Circular Flow of Income
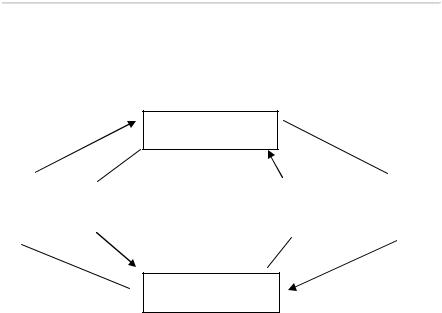
A useful tool for analyzing how an economy works is the circular flow of income. It is often used in macroeconomics – the study of the whole economy. The circular flow shows how money flows around the economy.
HOUSEHOLDS
Rent, |
Land, |
Goods |
Expenditure |
wages, (2) |
labor and (1) |
(4) and |
(3) on goods |
interest |
capital |
services |
and services |
and profit |
|
|
(consumption) |
BUSINESSES
Figure 1. The circular flow of income
In Figure 1, businesses (or producers) buy land, labor and capital from households – the users of goods and services (point 1). Households receive rent, wages, interest and profit (income) in return. This is shown as point 2. The money they earn is spent (point 3) on goods and services produced by businesses (point 4). So, money (or income) flows from businesses to households and back again – a circular flow of income around the economy.
How much money is flowing around the economy? The money earned by households, their income (Y), is spent on goods and services (E), which are produced by businesses – their output
(O). In the national accounts of economies these are all defined so that they are equal. We can say that the value of :
Y = E = O
(where = represents “must equal”)
In theory households are supposed to spend all their money on goods and services. In practice they will spend some money
114
Additional Reading
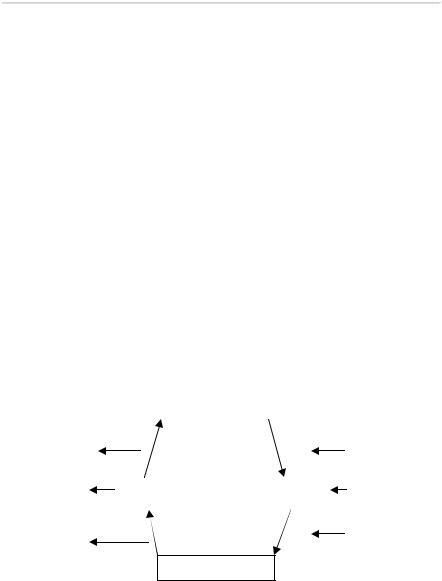
(known as consumption) and save some as well. Savings take money out of the circular flow – a withdrawal.
What about businesses? They are not likely to spend all their revenue on rent and wages. They will also invest some in machinery and equipment. These are used to produce goods and services which increase money in the economy – an injection. There are a number of injections and withdrawals in a complex economy. Injections can include:
investment (I) – spending on fixed capital, such as machinery and factories, and circulating capital, such as stocks and work-in-progress which enter the circular flow;
government spending (G) – spending by government on new schools and motorways or subsidies to firms;
exports (X) – goods and services sold abroad, earning money for the UK which enters the circular flow of income.
Withdrawals can be:
savings (S) – money saved by households;
taxation (T) – money taken out of the economy from businesses and households by government through taxation;
imports (M) – goods and services coming into the country paid for by money leaving the circular flow.
|
|
|
|
|
|
HOUSEHOLDS |
|
|
|
|
||
|
|
|
|
|
|
|
|
|
|
|
|
|
|
|
|
|
|
|
|
|
|
|
|
|
|
|
Savings |
|
|
|
|
|
|
|
|
Investment |
||
|
|
|
|
|
|
|
|
|
|
|
|
|
|
|
|
|
|
|
|
|
|
|
|
|
|
|
Taxes |
|
Income |
|
|
|
Expenditure |
|
Government |
|||
|
|
|
|
|
|
|
|
|
|
|
spending |
|
|
|
|
|
|
|
|
|
|
|
|
||
|
|
|
|
|
|
|
|
|
|
|
|
|
|
|
|
|
|
|
|
|
|
|
|
|
|
|
Imports |
|
|
|
|
|
|
|
|
|
Exports |
|
|
|
|
|
|
|
|
|
|
|
|
||
|
|
|
|
|
|
|
|
|
|
|
|
|
|
|
|
|
|
|
|
|
|
|
|
|
|
BUSINESSES
Figure 2. The circular flow of income showing injections and withdrawals
115

Английскийязык.
Лексические основы чтения текстов по экономике
The value of a country’s economic activity is known as its Gross National Product (GNP). It can be measured using three methods:
income method – adding up all the incomes earned by households (rent, wages, interest, profit);
output method – adding up the value of all goods and services produced by businesses;
expenditure method – adding up the spending of consumers (C), the investment of business (I), the expenditure of government (G) and the spending of people overseas on exports minus the spending of a country on imports (X – M). The relationship is expressed as:
Y = C + I + G + (X – M)
where Y equals GNP.
Whichever method is used, it will give the same figure for GNP because income = output = expenditure. This is true of all circular flows of income.
You have read the text. Check your understanding:
1)What does the circular flow of income show?
2)What do producers buy from households?
3)What do households receive from businesses?
4)On what do households spend the money they earn?
5)Why must the income of households equal the output of businesses?
6)What can be the impact on the entertainment industry of the following events:
a.greater availability of grants for setting up new businesses;
b.a developing trend for consumers to devote more of their income to savings;
c.a 2% reduction in income tax?
7)Will these events be injections into or withdrawals from the circular flow of income?
116

Additional Reading
The Determinants of Price Elasticity
What determines whether the price elasticity of demand for a good is high (say, -5) or low (say, -0,5)? Ultimately the answer must be sought in consumer tastes. If it is considered socially essential to own a television, higher television prices may have little effect on quantity demanded. If televisions are considered a frivolous luxury, the demand elasticity will be much higher. Psychologists and sociologists may be able to explain more fully than economists why tastes are as they are. Nevertheless, as economists, we can identify some considerations likely to affect consumer responses to changes in the price of a good. The most important consideration is the ease with which consumers can substitute another good that fulfils approximately the same function.
Consider two extreme cases. Suppose first that the price of all cigarettes is raised 1 per cent, perhaps because the cigarette tax has been raised. Do you expect the quantity of cigarettes demanded to fall by 5 per cent or by 0,5 per cent? Probably the latter. People who can easily quit smoking have already done so. A few smokers may try to cut down but this effect is unlikely to be large. In contrast, suppose the price of one particular brand of cigarettes is increased by 1 per cent, all other brand prices remaining unchanged. We should now expect a much larger quantity response from buyers. With so many other brands available at unchanged prices, consumers will switch away from the more expensive brand to other brands that basically fulfil the same function of nicotine provision. For a particular cigarette brand the demand elasticity could be quite high.
Ease of substitution implies a high demand elasticity for a particular good. In fact, our example suggests a general rule. The more narrowly we define a commodity (a particular brand of cigarettes rather than cigarettes in general, or oil rather than energy as a whole), the larger will be the price elasticity of demand.
Measuring Price Elasticities
To illustrate these general principles we report estimates of price elasticities of demand in Table 1. The table confirms that the
117

Английскийязык.
Лексические основы чтения текстов по экономике
demand for general categories of basic commodities, such as fuel, food, or even household durable goods, is inelastic. As a category, only services such as haircuts, the theatre, and sauna bath, have an elastic demand. Households simply do not have much scope to alter the broad pattern of their purchases.
In contrast, there is a much wider variation in the demand elasticities for narrower definitions of commodities. Even then, the demand for some commodities, such as dairy produce, is very inelastic. However, particular kinds of services such as entertainment and catering have a much more elastic demand. Small changes in the relative price of restaurant meals and theatre tickets may lead households to switch in large numbers between eating out and going to the theatre, whereas the demand for getting out of the house on a Saturday evening may be relatively insensitive to the price of all Saturday night activities taken as a whole.
Table1
Estimates of price elasticities of demand in the UK
Good |
Demand |
Good |
Demand |
(General Category) |
Elasticity |
(Narrower Category) |
Elasticity |
Fuel and light |
0,47 |
Dairy produce |
0,05 |
Food |
0,52 |
Bread and cereals |
0,22 |
Alcohol |
0,83 |
Entertainment |
1,40 |
Durables |
0,89 |
Expenditure abroad |
1,63 |
Services |
1,02 |
Catering |
2,61 |
You have read the text. Check your understanding:
1)What determines whether the price elasticity of demand for a good is high or low?
2)For what categories of commodities is demand usually inelastic?
3)Is the demand elasticity for narrower definitions of commodities high or low?
118

Additional Reading
Money
Money makes the world go round, to paraphrase an old saw. But money is also a wonderfully mysterious idea. Think of it: a group of people, most of whom have never met each other, have agreed that a piece of paper is worth something and can be used to acquire goods and services. A dollar buys you a cup of coffee. Why? Because we’ve all decided that it works best to believe that a piece of paper is good for a cup of coffee.
It wasn’t always so. Long ago, before money, or currency, before paper and coins, people traded things: a bushel of wheat for a ceramic bowl, for example. This barter system worked fine, but it had disadvantages. It wasn’t practical to lug around bushel baskets of grain all day long. So bartering evolved to using smaller, more transportable objects. Some people use beads. Others used gems. The value of the various trinkets used varied widely, meaning that most transactions still required quite a bit of negotiation.
Gold became a popular currency before the widespread adoption of paper money. In 1091 B.C.E., the Chinese approved the use of gold bars as a form of money. The Roman Empire issued gold coins. In 1284 Vienna introduced the gold ducat, which would be a dominant world currency for almost five centuries.
The transition to paper money moved along an erratic path. China introduced paper money in the ninth century, but its use died out about five hundred years later, when rampant printing of currency led to terrible inflation. When too much currency is printed, the value of each piece of currency declines. As the amount of currency increases, it takes more currency to buy the same thing. China didn’t return to paper money for several hundred years.
Paper arrived in the United States in 1690, when colonists in Massachusetts printed notes. For a period of time, paper money in the United States and elsewhere could be converted into something else, usually gold. In other words, if someone gave you five dollars for a cup of coffee, you could take that five dollars and redeem it for gold or some other precious metal. Paper money’s convertibility helped provide assurance to those who used the money in transactions that it was worth the number printed on the paper.
119

Английскийязык.
Лексические основы чтения текстов по экономике
Paper money is no longer convertible to gold and silver. Indeed, paper money is worth what it is because the government says that’s what it’s worth. Rather than the value of paper being set to something such as gold (“the gold standard”), currency systems today are called “fiat” systems. In other words, by fiat, or government order, the currency is simply worth what it is.
You have read the text. Check your understanding.
1)How did barter system work?
2)What are disadvantages of barter system?
3)What was the most popular currency before adoption of paper money?
4)What leads to inflation in the countries where paper money is used?
5)How is value of paper money determined nowadays?
Trading Money
Because money is not backed by a precious metal, its market value is determined by several other factors. Among them: the strength of the government backing the money; a nation’s fiscal and trade policies; the relative flow of capital among nations; and the rate of return, or interest rate, that currency owners can expect.
More than $1 trillion in currency moves around the world each day via the currency markets. These markets are essentially the trading in various currencies that occurs through large banks. Dollars buy Euros, and yen buy Swiss francs. The currency markets, unlike the bond or stock markets, technically operate all hours, everyday. Of course, traders need someone to trade with, so activity on holidays and weekends is very light.
The trading of “free-floating” currencies establishes the exchange rate among those currencies. The market determines how much the dollar is worth compared to the euro, for instance. Governments can take steps to affect the value of their currency, but the market has the final say. A government can purchase massive
120