Microsoft Word - Structural Health Monitoring of Railroad Wheels (1)
.pdf
Structural Health Monitoring of Railroad Wheels Using Wheel Impact Load Detectors
Brant Stratman, Yongming Liu, Sankaran Mahadevan*
Vanderbilt University, Nashville, TN 37235, USA
Abstract
This paper proposes two quantitative criteria for removing railroad wheels from service, based on real-time structural health monitoring trends that are developed using data collected from trains while in-service. The data is collected using Wheel Impact Load Detectors (WILDs). These impact load trends are able to distinguish wheels with a high probability of failure from high impact wheels with a low probability of failure. The trends indicate the critical wheels that actually need to be removed, while at the same time allowing wheels that aren’t critical to remain in service. As a result, the safety of the railroad will be much improved by being able to identify and remove wheels that have high likelihood of causing catastrophic failures.
1Introduction
Traditional inspection techniques used in the railroad industry, such as drive-by inspections where all of the wheels on the train are glanced at while an inspection vehicle drives by, are not as accurate and reliable as more rigorous and quantitative inspection methods. Many damaged wheels aren’t found, while many useable wheels are removed when they could remain in service. By using Wheel Impact Load Detectors (WILDs), structural health monitoring trends can be developed based on the wheel impact data which indicates the actual condition of the wheels. The trends can indicate the critical
* Corresponding author, Tel.: 615-322-3040; Fax: 615-322-3365; Email:Sankaran.Mahadevan@vanderbilt.edu
wheels that actually need to be removed, while at the same time allowing wheels that aren’t critical to remain in service.
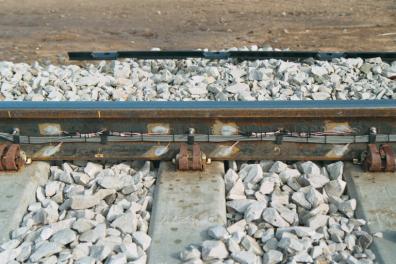
The WILD system is composed of a series of strain gages welded to the rail. The strain gages quantify the force applied to the rail through a mathematical relationship between the applied load and the deflection of the foot of the rail. These impact forces are used to monitor locomotive and rail car wheel health to ensure safe train operations.
The use of WILDs by railroads has resulted in the removal of high impact wheels that damage bearings, lading, rail, other mechanical components, and the wheels themselves. Although wheels with extremely high impacts are rare on a percentage basis, small percentages do not equate to small effects. For example, high impact wheels have been observed to increase the surface crack growth rate on a rail by a factor of nearly 100
times than that under non-impact loading conditions1. Also, it has been shown in a numerical study that dynamic impacts have a detrimental effect on concrete sleeper
health by increasing the risk of crack initiation2.
High impact wheels are wheels that have an impact force of 90,000 pounds or greater. High impact wheels are most often wheels that have a flat spot on the tread surface, known as a slid flat. Slid flats are generally caused when a hand break is left engaged while the train is in motion; because the wheel cannot rotate, the friction between the wheel and rail causes the surface of the wheel to become flat instead of round. Other high impact wheels are caused by major defects in the tread surface; these high impact wheels have a higher probability of leading to catastrophic failure than slid flat wheels. It is assumed that derailment is a worst case scenario, but that financial loss begins well before the vehicle derails due to the high impacts between the wheel and rail.
2
It has been observed that some high impact wheels can remain in service for a
couple of years before failure, while others fail almost immediately3. This indicates that the high impact force alone is not responsible for wheel failures. Only high impact wheels that have a defect present pose a significant risk of failure. It has been reported that the crack growth rate of metallic materials under impact fatigue is significantly
higher than under non-impact fatigue4,5.
Currently the Association of American Railroads’ (AAR) wheel impact load limit
for wayside detectors is 90,000 pounds6. Early experience with wheel impact load detectors showed that a large percentage of high impact wheels were not condemnable
under AAR rules7, although such detectors were effective at finding high impact wheels.
Many of the most catastrophic wheel failure modes, namely shattered rim failures and vertical split rim failures, occur below the 90,000 pound condemning limit making the WILD system ineffective when looking at individual impacts.
This paper proposes two additional criteria for removal of wheels with high likelihood of failure, based on two real-time structural health monitoring trends that were developed using data collected from in-service trains. These impact trends are able to distinguish wheels with a high probability of failure from high impact wheels with a low probability of failure. As a result, the safety of the railroad will be much improved by being able to identify and remove wheels that have the highest likelihood of causing catastrophic failures.
2Wheel Impact Load Detectors
A Wheel Impact Load Detector (WILD) is used to manage the wheel impact load spectrum for targeted removals of defective wheels from service. The WILD continually
3
monitors locomotive and rail car wheel health to ensure safe train operations. WILDs scan millions of wheels per day throughout the international rail industry.
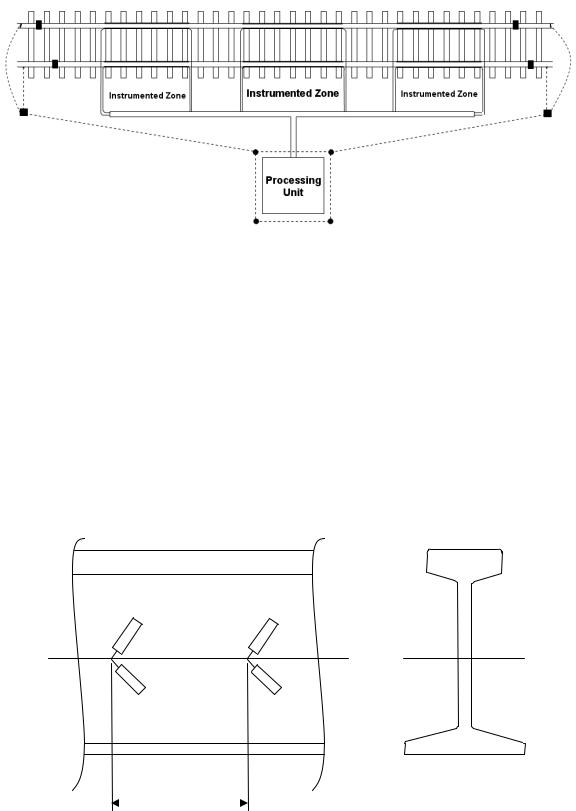
The installation of WILDs requires no radical modification of the existing track structure. A series of strain gage load circuits, micro-welded directly to the neutral axis of a rail, create an instrumented zone for the measurement of vertical forces exerted by each wheel of a passing train. Signal processors, housed in a nearby unit, electronically analyze the data to isolate wheel tread irregularities (see Figure 1). If any wheel generates a force that exceeds a tailored alarming threshold, a report identifies that wheel for action. A low-level alarm identifies cars for service at the next available opportunity; a mid-level alarm limits a train's maximum speed until the car can be set aside for the wheel to be removed; and a high-level alarm directs a train to stop as quickly and safely as possible to avoid a potential derailment. These reports are usually distributed in realtime to such interested parties as rail traffic control centers and car shops.
There are two widely used noncontact methods of quantifying the extent of
damage on the wheel8: strain-based systems, and accelerometer based systems. The strain-based system quantifies the force applied to the rail through a mathematical relationship between the applied load and the deflection of the foot of the rail. Strain in the rail foot is used as a direct measure of the load at the rail head. The accelerometer based system uses accelerometers placed on the rail to infer the extent of damage on the wheels from the accelerometer’s output. In some cases, the accelerometer output is converted to a force. The strain-based system is used for load measurements in this study.
4

Figure 1 Schematic of a WILD site.
One setup for a strain gauge-based wheel impact monitor consists of 11 strain
gauge cribs, per rail9,10,11. The gauges are bonded beneath the foot of the rail and the applied force was determined from the shear strain. Some overviews of a typical strain
gauge wheel detection system can be found in1,10,11. Fundamentally, the system consists of strain gauges instrumented as shown in Figure 2, on both sides of the rail web with the middle of the strain bridge being in the center of a crib.
2 |
1 |
Neutral axis
3 |
4 |
Side |
Front |
300mm
Figure 2 Rail web schematic; full-bridge setup.
5
The stain gauges are then wired into a full-bridge circuit where both sides of the web are taken into account to nullify the effects of any off-center strikes. According to the arrangement as shown in Figure 2, the output of the bridge is then defined by the following equation:
|
GF |
|
|
|
|
|
||
Fout |
(t ) = |
|
[ε1 (t )− ε 2 (t )+ ε 3 (t )− ε 4 |
(t )] V |
CF |
(1) |
||
4 |
||||||||
|
|
|
|
|
|
|
||
where Fout(t) is the output force and εn(t) are the respective dynamic output strains; both
are functions of time. GF is the gauge factor as specified by the manufacturer of the strain gauges, V is the input excitation voltage, and CF is a calibration factor. Traditionally, CF is simply obtained by quasi-statically loading the instrumented structure prior to testing.
For the work presented in this paper each WILD site was made up of 128 strain gages; 32 strain gages for vertical force measurements and 32 strain gages for lateral forces measurements, per rail. In this setup two strain gages are required to give one vertical force measurement and two strain gages are required to give one lateral force measurement (Figure 3).
Each WILD site collected 16 vertical force values and 16 lateral force values per rail (according to the instrumented zones in Figure 1); the strain gages were spaced for maximum exposure to all wheel sizes. For most wheel sizes the force between the wheel and rail was collected for 90% of the wheel revolution.
In order to reduce data storage space the 16 vertical and 16 lateral force values for each rail were used to calculate a vertical average force, vertical peak force, lateral average force, and lateral peak force measurement for each wheel. This paper focuses
6

solely on the vertical average and vertical peak forces; these loads will be referred to as the nominal (average) and peak loads throughout the rest of the paper.
Figure 3 Strain gage setup for this study.
The nominal load is the average of the 16 WILD impact measurements for the wheel. The peak load equals the peak reading of the 16 WILD impact measurements. A high peak load compared to nominal load would indicate a non-round (defect) spot on the wheel, while a peak load equal to the nominal load would indicate a perfectly round wheel.
The nominal loads of all eight wheels on a train car can be used to identify unbalanced/shifted loads and overloads. For a full 286K GRL freight car, the load per wheel is 35,750 pounds. Therefore, if a wheel impact load detector recorded an impact reading of 90,000 pounds, the applied dynamic load is 54,250 pounds in addition to the
normal (nominal) wheel load12. The ratio of the peak load to the nominal load can be
used to detect wheel defects in an empty car13. Two semi-normalized impact forces, the dynamic impact load and ratio, are calculated from the following formulas:
7
Dynamic impact load = (peak load)− (nominal load) |
(2) |
||
Ratio = |
(peak load) |
(3) |
|
|
|
||
(nominal load) |
|||
The dynamic impact load and ratio are referred to as semi-normalized impact forces because they cancel out the effect the weight has on the impact reading. For example, a wheel carrying more weight will have a higher peak load simply because there is more force on the wheel. Similarly, a train moving at a higher speed will have a higher peak load simply because there is more force on the wheel. Since the dynamic impact load and ratio cancel out the effect the weight of the car has on impact reading, but the speed of the train still affects their readings, these are considered only seminormalized impact values.
3Wheel Failures and Failure Modes
In recent years, higher train speeds and increased axle loads have led to larger wheel/rail contact forces. Also, efforts have been made to optimize wheel and rail design. This evolution tends to change the major wheel rim damage from wear to
fatigue14. Unlike the slow deterioration process of wear, fatigue causes abrupt fractures in wheels or tread surface material loss.
Railroad wheels may fail in different ways corresponding to different failure
mechanisms15,16,17. Shattered rims and vertical split rims account for the majority of wheel failures in North America.
Shattered rim defects are the result of large fatigue cracks that propagate roughly
parallel to the wheel tread surface19,18. They form and grow ½ to ¾ inch (12-20 mm)
8

below the tread surface19. They can grow up to a length of several hundred millimeters. Ekberg et al reported that a shattered rim can initiate from both inclusions and non-
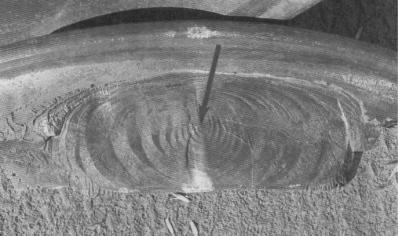
inclusion locations20. An examination of shattered rim fracture surfaces normally reveals a clamshell pattern as seen in Figure 4. If service damage is not too extensive, the crack initiation site is often clearly visible.
Figure 4 Typical Shattered Rim; arrow points to origin.
Once shattered rims initiate in the wheel rim, propagation occurs rapidly under normal wheel loading. Studies have shown that to initiate cracking a large load, such as
an impact, may be required21,22,23. Shattered rims tend to occur in either relatively new wheels or those close to their condemning limit.
Vertical split rims are another type of wheel failure that is believed to be related to high impact loads. A vertical split rim is believed to be due to strength failure; the failure is a sudden failure characterized by vertical crack propagation where the tread surface of the wheel is detached.
A large amount of scatter has been observed in the fatigue life distribution of railroad wheels, ranging from several months to several decades (Figure 5).
9

|
1 |
|
|
|
|
|
Probability |
0.8 |
Field data |
|
|
|
|
0.6 |
|
|
|
|
|
|
0.4 |
|
|
|
|
|
|
|
|
|
|
|
|
|
|
0.2 |
|
|
|
|
|
|
0 |
|
|
|
|
|
|
5 |
6 |
7 |
8 |
9 |
10 |
Fatigue life (log(N))
|
0.3 |
|
|
|
|
|
|
0.25 |
Field data |
|
|
|
|
Frequency |
|
|
|
|
|
|
0.2 |
|
|
|
|
|
|
0.15 |
|
|
|
|
|
|
0.1 |
|
|
|
|
|
|
|
0.05 |
|
|
|
|
|
|
0 |
|
|
|
|
|
|
5 |
6 |
7 |
8 |
9 |
10 |
Fatigue life (log(N))
a) CDF b) Frequency histogram
Figure 5 Empirical CDF and frequency histogram of wheel field data.
In Figure 5, it is seen that the field data has two ranges of fatigue life distribution. This phenomenon can be clearly seen in the frequency diagram (Figure 5(b)). It also can be seen that the number of wheels experiencing premature failure is only a small fraction of wheels (around 10%) and does not greatly affect the overall mean fatigue life. However, their effects are significant at the tail region, which affects the reliability evaluation.
Berge24 and Stone and Geoffrey25 suggest that the large stress, perhaps due to wheel/rail impact or material discontinuity, has important effect on the shattered rim failure. Also, the large on-tread brake loading and the thermal stresses arising from on-
tread friction braking will reduce the fatigue life of railroad wheels26. The observed premature fatigue failure (earlier failure modal in Figure 5(b)) is possibly due to the above mentioned factors or their combinations, such as initial defects, brake loading, and thermal loading.
From the discussion of the failure modes and the fatigue failure life data, and also from Figure 5, it is clear that catastrophic wheel failures can occur suddenly at any point during the wheels’ lifetime. For this reason, the railroad industry will benefit from real-
10
