

6 . Analysis of purchasing activity of Master Stone llp
6.1 . Dynamics and structure of volume of purchases on product range
Dynamics of total amount of purchases is presented in figure 5.
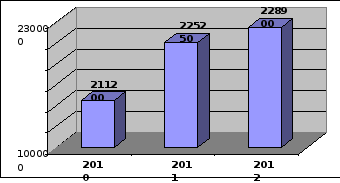
Fig. 5. Dynamics of total amount of purchases of Master Stone LLP
As show figure 5 data the volume of purchases of Master Stone LLP in 2011 increased by 14050 thousand tenges. or for 6,65%, and in 2012 – on 3650 thousand tenges. or for 1,62%.
We pass to the analysis and an assessment of dynamics and volume of purchases on the range of Master Stone LLP. For this purpose we will make table 16.
|
№ |
Names of commodity groups |
2011 |
2012 |
Growth rate, (+,-) |
Deviation | ||||||
|
% | |||||||||||
|
one th. KZT. |
Sp. weight, % |
one th. KZT. |
Sp. weight, % |
|
absolute |
relative | |||||
|
|
% | ||||||||||
|
1 |
Marble
|
60250 |
26,75 |
64500 |
28,18 |
126,68 |
4250 |
1,43 | |||
|
2 |
Granite |
53500 |
23,75 |
55000 |
24,03 |
107,14 |
1500 |
0,28 | |||
|
3 |
Quartz Agglomerate
|
7500 |
3,33 |
8000 |
3,49 |
106,67 |
500 |
0,17 | |||
|
4 |
Travertin
|
40000 |
17,76 |
42500 |
18,57 |
119,09 |
2500 |
0,81 | |||
|
5 |
Artificial stone
|
12000 |
5,33 |
5650 |
2,47 |
47,08 |
-6350 |
-2,86 | |||
|
6 |
Travertin
|
30000 |
13,32 |
30250 |
13,22 |
100,83 |
250 |
-0,10 | |||
|
7 |
Ready products
|
22000 |
9,77 |
23000 |
10,05 |
104,55 |
1000 |
0,28 | |||
|
|
Total |
225250 |
100,00 |
228900 |
100,00 |
101,62 |
3650 |
| |||
According to table 16 it is possible to draw the following conclusions. In structure of purchases of 2011 the following commodity groups have the greatest specific weight:
1 . Marble – 26,75%.
2 . Granite – 23,75%.
3 . Travertin – 13,32%.
In 2012 the three of leaders remains former, but change specific weight a little:
1 . Marble – 28,18%.
2 . Granite – 24,03%.
3 . Travertin – 13,22%.
In structure of purchases of 2011 the following commodity groups have the smallest specific weight:
1 . Artificial stone – 5,33%.
2 . Quartz Agglomerate – 3,33%.
In structure of purchases of 201 the following commodity groups have the smallest specific weight:
1 . Quartz Agglomerate –3,49%.
2 . Artificial stone – 2,47%.
For the analyzed period of special structural changes didn't occur, except decrease in specific weight of " Artificial stone " group for 2,86%.
6.2 . Dynamics and structure of volume of purchases on suppliers
We pass to the analysis and an assessment of dynamics and volume of purchases on suppliers of Master Stone LLP. For this purpose we will make table 24.
Table 17.
Information on dynamics and structure of purchases of Master Stone LLP on suppliers.
|
№ |
Names of commodity groups |
2011 |
2012 |
Growth rate, (+,-) |
Deviation | ||||||
|
(+,-) | |||||||||||
|
one th. KZT. |
Sp. weight, % |
one th. KZT. |
Sp. weight, % |
absolute |
relative | ||||||
|
% | |||||||||||
|
1 |
ИСКБ |
32500 |
14,43 |
32500 |
14,20 |
100,00 |
0 |
-0,23 | |||
|
2 |
АЛЬКОВ |
32000 |
14,21 |
35900 |
15,68 |
112,19 |
3900 |
1,48 | |||
|
3 |
АТРИБУТ ТОО |
20000 |
8,88 |
23000 |
10,05 |
115,00 |
3000 |
1,17 | |||
|
4 |
ВАНСТРОЙСЕРВИС ТОО |
20000 |
8,88 |
20000 |
8,74 |
100,00 |
0 |
-0,14 | |||
|
5 |
ВЫСОТРЕМСТРОЙ ТОО |
19500 |
8,66 |
8000 |
3,49 |
41,03 |
-11500 |
-5,16 | |||
|
6 |
ИМСТАЛЬКОН-1 АМФ ОАО |
17500 |
7,77 |
18000 |
7,86 |
102,86 |
500 |
0,09 | |||
|
7 |
МОНОЛИТСТРОЙ МСФ |
15000 |
6,66 |
17500 |
7,65 |
116,67 |
2500 |
0,99 | |||
|
8 |
НИСАДА |
14000 |
6,22 |
14000 |
6,12 |
100,00 |
0 |
-0,10 | |||
|
9 |
Others, inconstan customers |
54750 |
24,3 |
60000 |
26,21 |
110,7 |
5250 |
1,91 | |||
|
|
Total |
225250 |
100 |
228900 |
100 |
101,62 |
3650 |
| |||
According to table 17 it is possible to draw the following conclusions. In structure of purchases of 2011 the following suppliers have the greatest specific weight:
1 . " ИСКБ " – 14,43%.
2 . АЛЬКОВ – 14,21%.
3 . АТРИБУТ LLP – 8,88%.
In 2012 the three of leaders remains former, but change specific weight a little:
1 . АЛЬКОВ – 15,68%.
2 . " ИСКБ " – 14,20%.
3 . АТРИБУТ LLP – 10,05%.
For the analyzed period of special structural changes didn't occur, except decrease in specific weight of the supplier of " ВЫСОТРЕМСТРОЙ LLP" for 5,16%.