

2 ANALYSIS OF THE EFFECTIVENESS OF RISK MANAGEMENT IN 10 TOP BANKS
2.1 Basic financial review of activity results China construction bank
The banking industry experienced a strong recovery after the worst of the financial crisis, but continued to be weighed down due to the ongoing Eurozone crisis and concerns of sluggish growth in the United States. An evolving banking landscape in emerging economies (especially China and Latin America) is expected to transform the banking industry in the future. Meanwhile , regulations continue to evolve and create an ever-tightening regulatory environment for the banking industry.
Many information resources provide information about the 10 strongest banks in the world. Table 2.1 shows the top 10 banks in the opinion of Capgemini Company.
Table 2.1 – Top 10 banks in the world in terms of pre-tax profit
|
Rank |
Country |
Institution |
Pre-tax profit (bill) |
|
1. |
China |
China Construction Bank |
34.8 |
|
2. |
China |
Commercial Bank of China |
30.2 |
|
3. |
China |
Bank of China |
26.76 |
|
4. |
USA |
JP Morgan Chase |
26.75 |
|
5. |
China |
Agricultural Bank of China |
25.1 |
|
6. |
USA |
Wells Fargo |
23.3 |
|
7. |
Great Britain |
HSBC |
21.8 |
|
8. |
Japan |
Mitsubishi UFJ |
17.6 |
|
9. |
USA |
Citigroup |
14.7 |
|
10. |
France |
BNP Paribas |
12.5 |
Assets of the Top 10 banks globally grew by 4,9 % in 2012 and registered a growth across all regions in 2012, except in Europe where asset growth was down 0.5% due to concerns about Eurozone debt. The Latin America region registered an impressive growth of 20.5% in assets in 2012, as compared to the other global regions. This resurgence of the economies in the region was driven primarily by rising consumerism and financial inclusion.
Pre-tax profitability of the banking sector has witnessed a moderate growth of 4.6% during 2011–12. This growth has been largely driven by the emerging economies while the profitability of European banks has continued to be negatively impacted due to the Eurozone crisis.
For banks, top priorities include regulatory compliance, improving asset quality, enhancing customer centricity, focusing on digital convergence, and tackling competition from non-banks. Banks are therefore making business and technology investments to change their business models to comply with new regulatory requirements, enhancing capital adequacy, rolling out new channels such as social media, and leveraging customer data analytics and predictive analytics to enhance customer understanding and prevent fraud.
Assets of the top banks grew across all regions in 2012, except in Europe where asset growth was slightly down by 0.5%. The Latin America region registered an impressive growth of 20.5% in 2012, as compared to the other regions.
This resurgence of the economies in the region was driven primarily by rising consumerism and financial inclusion.
The banking industry assets in the emerging markets of the Latin America region and Asia-Pacific grew the most in 2012, at 20.5% and 9.5%, respectively. The key reason for growth in emerging markets such as China, India, and Brazil can be attributed to financial inclusion of the “bankable” income segment. In contrast to this, while North America grew by 6.1%, during the same period Europe declined marginally by 0.5%.
In terms of operational efficiency, the banking industry experienced very contrasting results. Return on assets (ROA) for top banks in Europe and Latin America declined in 2012, but improved marginally for banks in the Asia-Pacific and North America regions. Emerging market banks led the way on ROA where it remained highest for Latin America at 1.6%, followed by the Asia-Pacific region at 1.1%. The ROA for top global banks in the Latin America region decreased significantly by 25 basis points in 2012, which can be primarily attributed to the strong growth in the assets of the banks compared to profitability.
On the other hand, the ROA for European banks declined by nine basis points in 2011, due to substantial losses and write-offs suffered from the impact of theEurozone crisis. This led to a decrease in the assets along with the profitability, as most banks had substantial exposure to sovereign debt held by governments. The ROA of banks in North America witnessed a marginal increase of four basis points, as the economy started recovering in 2012.
China Construction Bank Corporation, established in October 1954 and headquartered in Beijing, is a leading large-scale joint stock commercial bank in Mainland China with world-renowned reputation. The Bank was listed on Hong Kong Stock Exchange in October 2005 (stock code: 939) and listed on the Shanghai Stock Exchange in September 2007 (stock code: 601939). At the end of 2013, the Bank’s market capitalisation reached US$187.8 billion, ranking 5th among listed banks in the world.
With 14,650 branches and sub-branches in Mainland China, the Bank provides services to 3,065,400 corporate customers and 291 million personal customers, and maintains close cooperative relationships with a significant number of high-end customers and leading enterprises of strategic industries in the Chinese economy. The Bank maintains overseas branches in Hong Kong, Singapore, Frankfurt, Johannesburg, Tokyo, Osaka, Seoul, New York, Ho Chi Minh City, Sydney, Melbourne, Taipei and Luxembourg, and owns various subsidiaries, such as CCB Asia, CCB International, CCB London, CCB Russia, CCB Dubai, CCB Europe, CCB Principal Asset Management, CCB Financial Leasing, CCB Trust and CCB Life.
The Bank upholds its “customer-centric, market-oriented” business concept, adheres to its development strategy of “integration, multifunction and intensiveness”, and strives to provide customers with premium and all-round modern financial services by accelerating innovation of products, channels and service modes. With a number of core business indicators leading the market, the Bank vigorously promotes the development of emerging businesses including electronic banking, private banking, credit cards, cash management, and pension, while maintaining its traditional businesses advantages in infrastructure and housing finance. The Bank constantly optimises business and management processes, and increases investments in the construction of fundamentals like information systems, aiming to enhance its capability of risk prevention and market competitiveness.
The Bank advocates fulfilment of citizen responsibilities as its corporate
mission and pro-actively combines business development with undertaking of social responsibilities, dedicated to building a bank with sustainable development that serves the general public, improves people’s livelihood, promotes low carbon and environmental protection.The financial information set forth in this annual report is prepared on a consolidated basis in accordance with the IFRS, and expressed in RMB unless otherwise stated.
In 2013, the global economy appeared to be in slow recovery. The U.S. economic recovery gained momentum and the euro zone and Japanese economies showed signs of improvement. Part of emerging market economies recorded slower growth and faced increasing risks. According to the report published by the International Monetary Fund, the growth rate of global economy was 3.0% in 2013, a decrease of 0.1 percentage point from 2012.
In 2013, China’s economy maintained steady growth on the whole. Although faced with complex internal and external environment, the fundamentals that supported the steady growth of China’s economy had not changed in essence. Economic restructuring and reform were making progress, investment and consumption increased steadily, structure of import and export was further optimised and employment remained stable. In 2013, China’s GDP was RMB56.9 trillion, up 7.7% over 2012, while the consumer price index increased by 2.6% over the previous year.In 2013, China’s financial market continued to grow smoothly. The PBOC furthered the reform of interest rate liberalisation. The PBOC removed the control over interest rates on loans offered by financial institutions to their clients on 20 July, and established the self-regulatory pricing mechanism for market interest rates and the centralised quotation and release mechanism for Loan Prime Rate (LPR) afterwards. The monetary credit growth was in line with expectations, and the loan structure continued to improve. At the end of 2013, the outstanding broad money supply M2 increased by 13.6% over the previous year to RMB110.7 trillion, and the narrow money supply M1 increased by 9.3% to RMB33.7 trillion. The amount of loans granted in RMB increased by 14.1% to RMB71.9 trillion. Deposits in RMB increased by 13.8% over 2012 to RMB104.4 trillion.
In 2014, the global economic environment will still be subject to variables and risks, and the growth in domestic economy will be faced with multiple tests including shifting of growth rate and structure adjustment.
As the financing structure, capital use, interest rate and exchange rate of the whole society are experiencing deeper and quicker changes, the Group will be faced with unprecedented challenges in consolidating the operating results. Adhering to the development strategy featuring “integration,multifunction and intensiveness”, the Group will accelerate the development of innovation and strategic transformation, continue to fully support and serve the real economy, stick to sound development and stringently hold the bottom line in preventing risks, thereby constantly endeavouring to enhance its capability in value creation.
In 2013, the Group’s income tax expense reached 64,684 million, an increase of 6,847 million over 2012. The effective income tax rate was 23.12%, lower than the 25% statutory rate, largely because the interest income from the PRC government bonds held by the Group was non-taxable in accordance with tax regulations.
The table 2.2 and figure 2.1 sets forth the composition of the Group’s impairment losses during respective periods.
Table 2.2 - The composition of the Group’s impairment losses
|
(In millions of RMB)
|
Year 2011
|
Year 2012
|
Year 2013
|
|
Loans and advances to customers |
32,403 |
38,330 |
42,666 |
|
Investments |
1,610 |
1,296 |
(130) |
|
Available-for-sale financial assets |
1,130 |
(236) |
(949) |
|
Held-to-maturity investments |
(15) |
1,126 |
1,056 |
|
Debt securities classified as receivables |
495 |
406 |
(237) |
|
Others |
1,770 |
415 |
673 |
|
Total impairment losses |
35,783 |
40,041 |
43,209 |
In 2013, the Group’s impairment losses were 43,209 million, an increase of 3,168 million, or 7.91%, over 2012. In this amount, impairment losses on loans and advances to customers were 42,666 million, an increase of 4,336 million,or 11.31%, over 2012. Reversal of impairment losses on investments was 130 million, a decrease of 1,426 million, or 110.03%, over 2012.
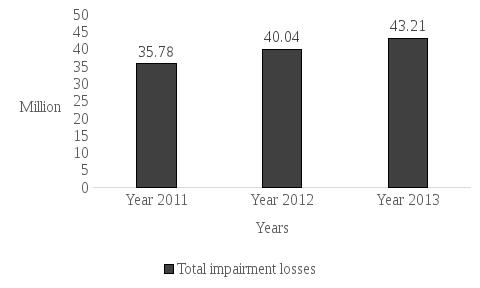
Figure 2.1 - The composition of the Group’s impairment losses
The large global banks typically offer all three services, with smaller banks usually focusing more on the investment banking division side covering advisory and mergers and acquisitions (M&A).Table 2.3 and figure 2.2 reports about the effectiveness of investment activity China Construction Bank.
Table 2.3 - The composition of the Group’s investments
|
Indicators |
2011 |
2012 |
2013 |
|||||
|
Amount |
% |
Amount |
% |
Amount |
% |
|||
|
Debt securities investments |
23,096 |
0.84 |
2,847,441 |
99.33 |
3,115,865 |
91.25 |
||
|
Equity instruments |
675,058 |
24.62 |
17,967 |
0.63 |
19,249 |
0.56 |
||
|
Funds |
1,743,569 |
63.60 |
1,240 |
0.04 |
937 |
0.03 |
||
|
Other debt instruments |
300,027 |
10.94 |
– |
– |
278,566 |
8.16 |
||
|
Total investments |
2,741,750 |
100 |
2,866,648 |
100 |
3,414,617 |
100 |
||
In 2013, in accordance with its annual investment and trading strategy and risk policy requirements, the Group proactively dealt with regulatory and market changes to achieve the balance between risks and returns. As at 31 December 2013, the Group’s investments totalled 3,414,617 million, an increase of 547,969 million, or 19.12% over 2012.

Figure 2.2 - The composition of the Group’s investments
In this amount, debt securities investments accounted for 91.25% of total investments, a decrease of 8.08 percentage points over 2012. Other debt instruments accounted for 8.16% of total investments, which were financial assets designated at fair value through profit or loss arising from investments in deposits with banks and non-bank financial institutions of part of newly issued principal- guaranteed wealth management products.
A deposit account is a savings account, current account, or other type of bank account, at a banking institution that allows money to be deposited and withdrawn by the account holder. These transactions are recorded on the bank's books, and the resulting balance is recorded as a liability for the bank and represents the amount owed by the bank to the customer. Some banks may charge a fee for this service, while others may pay the customer interest on the funds deposited. Customer deposits have great influence on the activities of banks in general (Table 2.4)
Table 2.4 - Deposits from customers by product type in China Construction Bank
|
Indicators |
2011 |
2012 |
2013 |
|||
|
Amount |
% |
Amount |
% |
Amount |
% |
|
|
1.Corporate deposits |
5,410,592 |
54.17 |
6,073,726 |
53.55 |
6,443,255 |
52.71 |
|
demand deposits |
3,493,316 |
34.98 |
3,714,628 |
32.75 |
4,064,038 |
33.25 |
|
time deposits |
1,917,276 |
19.19 |
2,359,098 |
20.80 |
2,379,217 |
19.46 |
|
2.Personal deposits |
4,415,965 |
44.22 |
5,077,930 |
44.77 |
5,514,647 |
45.12 |
|
demand deposits |
1,829,399 |
18.32 |
2,092,791 |
18.45 |
2,510,525 |
20.54 |
|
time deposits |
2,586,566 |
25.90 |
2,985,139 |
26.32 |
3,004,122 |
24.58 |
|
3.Overseas operations and subsidiaries |
160,893 |
1.61 |
191,423 |
1.68 |
265,135 |
2.17 |
|
4.Total deposits from customers |
9,987,450 |
100 |
11,343,07 |
100 |
12,223,03 |
100 |
For a more precise analysis of these changes show in the Figure 2.3. As at 31 December 2013, the Group’s total deposits from customers reached 12,223,037 million, an increase of 879,958 million, or 7.76% over 2012. In this amount, domestic demand deposits of the Bank increased by 767,144 million, or 13.21%, higher than the 0.73% growth of time deposits. The Group’s off-balance sheet items include derivatives, commitments and contingent liabilities.
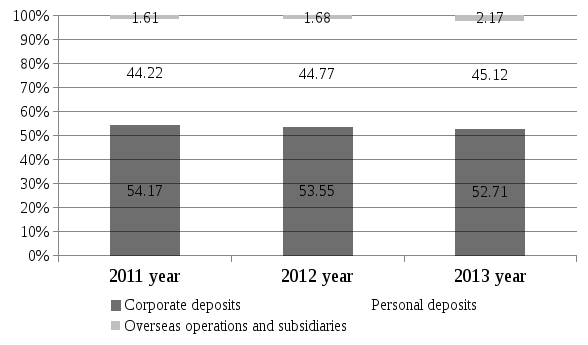
Figure 2.3 - Deposits from customers by product type in China Construction Bank
Derivatives include interest rate contracts, exchange rate contracts, precious metal contracts, and equity instrument contracts. Please refer to Note “Derivatives” in the “Financial Statements” of this annual report for details on the nominal amounts and fair value of derivatives. Commitments and contingent liabilities include credit commitments, operating lease commitments, capital commitments, underwriting obligations, redemption obligations, outstanding litigation and disputes. The Group enhanced the refined management over off-balance sheet activities and continued to advance the adjustments to off-balance sheet structure. Among these, credit commitments were the largest component, with a balance of 2,310,227 million as at 31 December 2013, an increase of 293,928 million over 2012. Please refer to Note “Commitments and Contingent Liabilities” in the “Financial Statements” of this annual report for details on commitments and contingent liabilities.
2.2 Assess the level of risk management оf China construction bank
In 2013, both domestic and global economic and financial situations remained complex and volatile. The growth rate of global economy edged down, developed economies achieved slightly strengthened growth momentum, while emerging economies experienced increasing pressure in economic growth, resulting in significant regional divergence. The Chinese economy in general made progress while ensuring stability. The economic growth slowed down in tandem with accelerated structural adjustments, the market-oriented reforms were rapidly promoted, competition from inside and outside the financial sector became increasingly intense, financial reforms were continuously deepened and regulatory policies were further tightened. All these were testing the Group’s adaptability to changes, adjustment ability and promoting capability for management reforms, and driving the Group to steadily move forward, actively develop transformation and get a head start among peers.
Adhering to the strategy featuring “integration, multifunction and intensiveness” and scrupulously abiding by the general keynote of steady development, the Group persisted in supporting the real economy and accelerated strategic transformation. It maintained a “stable” operation as a whole during the process of upgrading and transforming traditional businesses and accelerating the development of emerging businesses, realised “progress” in strategic focuses and key areas, and achieved new growth while maintaining stability in operating results and market performances. All these produced generous returns to shareholders, customers and the society. At the end of 2013, the Group’s total assets exceeded RMB15 trillion. The return on average assets and the return on average equity were 1.47% and 21.23%, respectively. Total capital ratio was 13.34%. Our key financial indicators continued to lead the market. On account of the favourable operating results, the Board of the Bank has recommended a final cash dividend of RMB 0.30 per share.
In 2013, the Bank refined its comprehensive risk management framework, strengthened control over key business lines and potential risk fields, proactively dealt with practical issues in market risk management and operational risk management, with remarkably improved initiative, prospectiveness and effectiveness in terms of risk management.
Refining comprehensive risk management framework system . Based on regulatory requirements and business development needs, the Bank developed a comprehensive risk management approach, and defined the processes of recognition and measurement, monitoring and control, as well as reporting on various kinds of risks. Based on risks sorted out in different business lines and fields, the Bank developed a plan to set up a comprehensive risk management responsibility mechanism covering all employees, whole processes, all institutions and all risk types. This helped to establish a good foundation for a sound comprehensive risk management system. The Bank explored to establish a system to monitor and analyse various risks, enrich the comprehensive risk report, and conduct view research on comprehensive risk management, to improve the overall ability of risk warning and control.
Optimising the foundation of risk management. The Bank studied and formulated risk management policies on off-balance sheet business, and clarified risk selection and access bottom line for off-balance sheet business. The Bank improved the organisational system of risk management for overseas entities, standardised their credit risk classification and post-lending management, and launched risk investigation and analysis on their material loans. The Bank refined the country-specific risk management system, and scientifically made provisions for country-specific risk. It amended collateral management measures and completed the second phase of collateral system optimisation in order to support the revaluation and monitoring of the collaterals. The Bank developed risk management policies for wealth management business, clarified requirements on industries and customer selection standards, and integrated the wealth management business into the bank-wide unified credit approval management. It promoted the Group’s consolidation risk management system, conveyed the bank’s unified preference, policy, limit, standard and rating to all subsidiaries, and strengthened the risk management of cross-border and cross-industry institutions.
Completing the regulatory inspection and evaluation of advanced measurement on capital management . While maintaining the operation and maintenance and continuous monitoring of 27 corporate customer credit rating models, the Bank pertinently accomplished customer rating optimisation for wholesale and retail industry as well as newly established small businesses. It developed technology tools such as score cards for small and micro business application and behaviour, and for anti-fraud management of credit card business. The optimisation of launching and application of the nine score cards for credit card and personal loans well supported automated approval and bulk monitoring. Currently, the Bank has the ability to independently develop risk measurement tools. The implementation level of advanced measurement on capital management was basically in line with that of the world leading banks, which laid a solid foundation for the implementation of Capital Management Measures for Commercial Banks issued by the CBRC.
The Board of Directors of the Bank has established Risk Management Committee, responsible for making risk management strategies and policies, monitoring the implementation, and evaluating the overall risk profile on a regular basis.
The Bank has established a centralised and vertical risk management organisation structure, with a vertical risk management line, consisting of “chief risk officer – risk supervisors – risk heads – risk managers”.
At the head office level, the chief risk officer is responsible for comprehensive risk management under the direct leadership of the president. The Risk Management Department is responsible for overall risk reporting, formulating risk management policies, developing risk measurement tools, monitoring and analysis and other issues. The market risk management department and the risk management team for overseas entities under the Risk Management Department are responsible for the risk management of financial market business and overseas entities respectively. The Credit Management Department is responsible for credit approval and credit risk monitoring. Other departments at the head office perform their risk management duties within their respective scopes of duty.
At branch level, there are risk supervisors in tier-one branches, who report to the chief risk officer, and are responsible for organising risk management and credit approval within the branch. There are risk heads at tier-two branches and risk managers at sub-branches, responsible for risk management in their respective branch or sub-branch. The risk management personnel have two reporting lines: the first reporting line is to risk management officers at higher levels, and the second is to managers of their respective entities or business units.
At subsidiary level, the Bank vigorously promotes the establishment of a comprehensive risk management framework. It strengthens prospective risk management and consolidation of risk management at group level, enhances internal control and internal audit system to lead and push forward the subsidiaries to launch their risk self-examination and investigation in order to discover and improve internal control deficiencies and problems in time.
The Risk Management Department takes the lead in the development and implementation of the credit risk measurement tools including customers rating and facilities grading and is responsible for the special assets resolutions. The Credit Management Department is responsible for establishing credit risk management policies and monitoring the quality of credit assets. The Credit Approval Department is responsible for the group’s comprehensive credit limits and credit approval of various credit businesses. While the Credit Management Department takes the lead, both the Credit Management Department and the Credit Approval Department will coordinate with the Corporate Banking Department, the SME Business Department, the Institutional Banking Department, the International Business Department, the Group Clients Department, the Housing Finance & Personal Lending Department, the Credit Card Center, and the Legal Affairs Department to implement the credit risk management policies and procedures.
With respect to the credit risk management of corporate and institutional business, the Group has accelerated the adjustment of its credit portfolio structure, enhanced post-lending monitoring, and refined the industry-specific guideline and policy baseline for credit approval. Management also fine-tuned the credit acceptance and exit policies, and optimised its economic capital and credit risk limit management. All these policies have implemented to improve the overall asset quality. The Group manages credit risk throughout the entire credit process including pre-lending evaluations, credit approval and post-lending monitoring. The Group performs pre-lending evaluations by assessing the entity’s credit ratings based on internal rating criteria and assessing the risks and rewards with respect to the proposed project. Credit approvals are granted by designated Credit Approval Officers. The Group continually monitors credit businesses, particularly those related to targeted industries, geographical segments, products and clients. Any adverse events that may significantly affect a borrower’s repayment ability are reported timely and measures are implemented to prevent and control risks.
With respect to the personal credit business, the Group relies on credit assessment of applicants as the basis for loan approval. Customer relationship managers are required to assess the income level, credit history, and repayment ability of the applicant. The customer relationship managers then forward the application and recommendations to the loan-approval departments for consent. The Group monitors borrowers’ repayment ability, the status of collateral and any changes to collateral value. Once a loan becomes overdue, the Group starts the recovery process according to standard personal loan recovery procedures.
To mitigate risks, the Group requests the customers to provide collateral and guarantees where appropriate. A fine management system and operating procedure for collateral have been developed, and there is a guideline to specify the suitability of accepting specific types of collateral. Collateral values, structures and legal covenants are regularly reviewed to ensure that they still serve their intended purposes and conform to market practices.
Risk Management Department is the overall business risk management department. Credit Management Department is the overall credit risk management department. Credit Approval Department is the overall credit business approval department. Internal Control and Compliance Department is the coordination department for operating risk management and internal control and compliance risk management. Other departments are responsible for various corresponding risks.
To identify, evaluate, monitor and manage risk, the Group has designed a comprehensive governance framework, internal control policies and procedures. Risk management policies and systems are reviewed regularly to reflect changes in market conditions, products and services offered. The Group, through its training system, standardised management and process management, aims at developing a disciplined and constructive control environment, in which all employees understand their roles and obligations.
In line with regulatory requirements, the Group proactively adopted a series of measures to prevent large exposure concentration risk, including further tightening lending criteria, adjusting business structure, controlling the credit granting pace, revitalising existing credit assets and innovating products. At the end of 2013, the gross loans to the largest single borrower accounted for 3.86% of the net capital of the Group, while those to the ten largest customers accounted for 14.76% of the net capital.
The following table 2.5 presents the maximum exposure to credit risk as at the end of the reporting period without taking into consideration any collateral held or other credit enhancement.
Table 2.5 - Concentration of loans
|
Indicators |
2011 |
2012 |
2013 |
|
Ratio of loans to the largest single customer (%) Ratio of loans to the ten largest customers (%) |
2.76 |
3.30 |
3.86 |
|
Ratio of loans to the largest single customer (%) Ratio of loans to the ten largest customers (%) |
16 |
15.18 |
14.76 |
Liquidity risk is the type of risk that occurs when, despite its debt servicing ability, the Bank cannot obtain sufficient funds in time, or at a reasonable cost, to meet the needs of asset growth or repay liabilities as they are due. The Bank’s objective for liquidity risk management is to maintain a reasonable level of liquidity, and ensure the payment and settlement security in compliance with the regulatory requirements, while striving to enhance fund yields by deploying its funds in an effective and reasonable way.
In 2013, the PBC lowered the statutory deposit reserve ratio twice by a total of one percentage point, and continuously injected liquidity into the market through reverse repurchase transactions, gradually easing the tight liquidity situation in the interbank market. However, as the statutory deposit reserve ratio was still at a high level, the banks’ function of creating derivative deposits was inhibited to some extent, leading to increased competition for deposits business. In response to its liquidity situation, the Bank took timely measures, including actively attracting deposits, adjusting the amounts of investments in debt securities, financial assets held under resale agreements, deposits with banks and non-bank financial institutions, and other products that have large influence on liquidity, and making flexible adjustments in accordance with its liquidity position. The results (table 2.6) showed that under the stress scenarios, although liquidity risk increased, it stayed within a controllable range.
Table 2.6 - The liquidity ratios of RMB and foreign currency of the Group
|
% |
Indicator |
Regulatory standard |
2011 |
2012 |
2013 |
|
Liquidity ratio |
RMB |
≥25 |
51.96 |
53.70 |
56.73 |
|
Foreign currency |
≥25 |
57.20 |
53.54 |
58.81 |
Through these effective measures, the Bank continued to maintain a reasonable level of liquidity, and ensured normal payment and settlement. Figure 2.4 shows the effect of these parameters on the bank's liquidity.
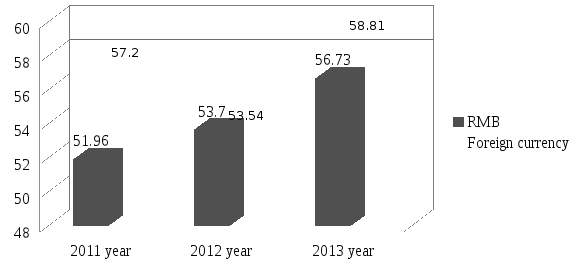
Figure 2.4 - The liquidity ratios of RMB and foreign currency of the Group
The Bank conducted regular stress tests on its liquidity risk, in order to gauge its risk tolerance in extreme scenarios of low probability and other adverse circumstances.
Amount due from banks and non-bank financial institutions includes deposits and placements with banks and non-bank financial institutions, and financial assets held under resale agreements of which counterparties are banks and non-bank financial institutions (Table 2.7).
Table 2.7 - Distribution of amounts due from banks and non-bank financial institutions
|
Indicator |
Group |
Bank |
|||
|
2012 |
2013 |
2012 |
2013 |
||
|
1 |
2 |
3 |
4 |
5 |
|
|
Individually assessed and impaired gross amount |
82 |
38 |
82 |
35 |
|
|
Allowances for impairment losses |
(56) |
(34) |
(56) |
(31) |
|
|
Subtotal |
26 |
4 |
26 |
4 |
|
|
Neither overdue nor impaired |
|||||
|
– grade A to AAA |
957,554 |
656,824 |
961,185 |
745,727 |
|
|
Continuation of table 2.7 |
|||||
|
1 |
2 |
3 |
4 |
5 |
|
|
– grade B to BBB |
4,169 |
3,688 |
4,096 |
3,231 |
|
|
– unrated |
70,487 |
94,282 |
73,870 |
94,211 |
|
|
Subtotal |
1,032,210 |
754,794 |
|
|
|
|
Total |
1,032,236 |
754,798 |
1,039,151 |
843,169 |
|
Amounts neither overdue nor impaired are analysed above according to the Group and the Bank’s internal credit rating. Unrated amounts due from banks and non-bank financial institutions include amounts due from a number of banks and non-bank financial institutions for which the Group and the Bank have not assigned an internal credit rating.
Market risk is the risk of loss, in respect of the Group’s on and off balance sheet activities, arising from adverse movements in market rates including interest rates, foreign exchange rates, commodity prices and stock prices. Market risk arises from both the Group’s trading and non-trading business. A trading book consists of positions in financial instruments and commodities held either with trading intent or in order to hedge other elements of the trading book. Non-trading book records those financial instruments and commodities which are not included in the trading book.
The Risk Management Department is responsible for formulating standardised market risk management policies and rules and supervising the implementation of market risk management policies and rules of the Bank. The Asset and Liability Management Department (the “ALM”) and the International Business Department are responsible for managing the size and structure of the assets and liabilities in response to non-trading market risk. The Financial Market Department manages the Head Office’s RMB and foreign currency investment portfolios, conducts proprietary and customer-driven transactions, as well as implementing market risk management policies and rules. The Audit Department is responsible for regularly performing independent audits of the reliability and effectiveness of the processes constituting the risk management system.
The Group’s interest rate risk mainly comprises repricing risk and basis risk arising from mismatch of term structure and pricing basis of assets and liabilities. The Group uses multiple tools such as repricing gap analysis, sensitivity analysis on net interest income, scenario analysis and stress testing, etc. to monitor the interest rate risk periodically.
The Group’s foreign exchange exposure mainly comprises exposures from foreign currency portfolios within treasury proprietary investments in debt securities and money market placements, and currency exposures from its overseas business. The Group manages its foreign exchange exposure by spot foreign exchange transactions and by matching its foreign currency denominated assets with corresponding liabilities in the same currency, and also uses derivatives in the management of its own foreign currency asset and liability portfolios and structural positions.
The Group is also exposed to market risk in respect of its customer driven derivatives portfolio and manages this risk by entering into back-to-back hedging transactions on a trade-by-trade basis with overseas banks and non- bank financial institutions.
The Group monitors market risk separately in respect of trading portfolios and non-trading portfolios. Trading portfolios include exchange rate and interest rate derivatives as well as trading securities. The historical simulation model for the Value-at-risk (“VaR”) analysis is a major tool used by the Bank to measure and monitor the market risk of its trading portfolio. Net interest income sensitivity analysis, interest rate repricing gap analysis and foreign exchange risk concentration analysis are the major tools used by the Group to monitor the market risk of its overall businesses.
Interest rate risk is the risk of loss in the overall income and economic value of the banking book as a result of adverse movements in interest rates, term structure and other interest-related factors. Repricing risk and basis risk arising from mismatch of term structure and pricing basis of assets and liabilities are the primary sources of interest rate risk for the Bank. The overall objective of the Bank’s interest rate risk management is to maintain steady growth of net interest income, while keeping interest rate risk within a tolerable range in accordance with the risk appetite and risk management capability.
In 2013, the Bank further refined its interest rate risk system framework, and formulated emergency response scheme for the interest rate risk of its banking book. It conducted regular analysis by comprehensively using multiple tools such as interest rate sensitivity gap, net interest income sensitivity analysis, scenario simulation and stress testing, to enhance regular analysis and prediction of the net interest margin.
The overall interest rate risk in 2012 was kept within the set tolerable level and the net interest margin remained stable. In response to influence of the interest rate liberalisation, the Bank adopted the pricing strategy, which combined the standardised and differentiated techniques, adjusted the authorisation in time, and optimised the system, to promptly respond to the demands of customers.
VaR is a technique which estimates the potential losses that could occur on risk positions taken, due to movements in market interest rates, foreign exchange rates and other market prices over a specified time horizon and at a given level of confidence.
The Risk Management Department calculates interest rates, foreign exchange rates and commodity prices VaR for the Bank’s trading portfolio.
By reference to historical movements in interest rates, foreign exchange rates and commodity prices, the Risk Management Department calculates VaR on a daily basis for the trading portfolio and monitors regularly.
VaR is calculated at a confidence level of 99% and with a holding period of one day.A summary of the VaR of the Bank’s trading portfolio as at the end of the reporting period and during the respective years submitted in Table 2.8.
VaR for each risk factor is the independently derived largest potential loss in a specific holding period and at a certain confidence level due to fluctuations solely in that risk factor.
Table 2.8 - VaR analysis of China Construction Bank
|
Indicators |
2011 |
2012 |
2013 |
||||
|
as at 2011 year
|
Average
|
as at 2012 year |
Average |
as at 2013 year |
Average |
||
|
Risk valuation of trading portfolio: |
57 |
90 |
53 |
63 |
128 |
64 |
|
|
-Interest rate risk |
18 |
25 |
44 |
42 |
117 |
36 |
|
|
-Foreign exchange risk |
49 |
84 |
32 |
41 |
94 |
53 |
|
|
-Commodity risk |
8 |
25 |
– |
4 |
7 |
2 |
|
The individual VaRs do not add up to the total VaR as there is diversification effect due to correlation amongst the risk factors.Figure 2.5 illustrate changes in VAR analysis results during 2011, 2012 and 2013 years.
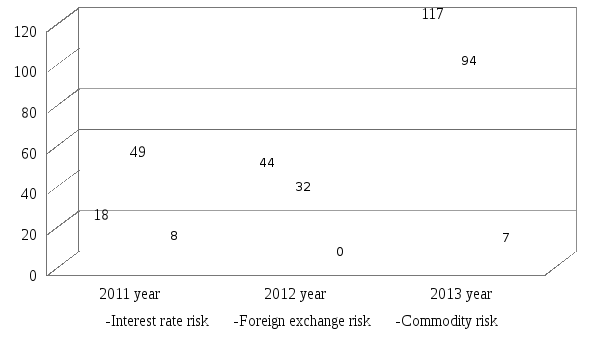
Figure 2.5 – Changes in VAR analysis results in China Construction Bank
Although VaR is an important tool for measuring market risk, the assumptions on which the model is based give rise to some limitations, including the following:
1) A 1-day holding period assumes that it is possible to hedge or dispose of positions within that period.This is considered to be a realistic assumption in almost all cases but may not be the case in situations in which there is severe market illiquidity for a prolonged period;
2) A 99 percent confidence level does not reflect losses that may occur beyond this level. Within the model used there is 1 percent probability that losses could exceed the VaR;
3) VaR is calculated on an end-of-day basis and does not reflect exposures that may arise on positions during the trading day;
4) The use of historical data as a basis for determining the possible range of future outcomes may not always cover all possible scenarios, especially those of an exceptional nature;
5) The VaR measure is dependent upon the Bank’s position and the volatility of market prices. The VaR of an unchanged position reduces if the market price volatility declines and vice versa.
Operational risk includes the risks resulted from flawed or erroneous internal processes, people and systems, or external events. The Group strengthened its operational risk control over key business areas and key positions according to regulatory requirements and the development trend of operational risk. The Group continued to promote the usage of operational risk management tools and improve the overall operational risk management information system.
Foreign exchange rate risk is the risk of impact of adverse movement in foreign exchange rates on a bank’s financial position. The Bank is exposed to foreign exchange rate risks primarily because it holds loans, deposits, marketable securities and financial derivatives that are denominated in currencies other than RMB.
In 2013, the Bank continuously optimised the measurement, monitoring and reporting system of foreign exchange rate risk, and regularly reported to the senior management the composition of indicators such as foreign exchange rate risk exposure, stress tests and movement analysis (Table 2.9). The Bank attached importance to the construction of foreign exchange rate risk management system, and maintained a leading position among domestic peers in the system measurement capability. In terms of the transactional risk, the Bank optimised the measurement method of gold exchange rate risk exposure, while adjusted the measurement of US dollar exchange rate risk exposure to facilitate the trading in US dollar of the precious metal business of platinum and silver in the international market. In terms of the non-transactional risk, the Bank initiated the optimisation of asset and liability management system, to fully bring in the management data of overseas branches.
Table 2.9 – Currency concentration of China Construction Bank
|
Indicators |
2011 |
2012 |
2013 |
|||
|
USD |
Total |
USD |
Total |
USD |
Total |
|
|
Spot assets |
358,091 |
658,797 |
524,730 |
804,603 |
731,627 |
944,234 |
|
Spot liabilities |
(276,244) |
(595,467) |
(432,09) |
(771,753) |
(540,063) |
(831,751) |
|
Forward purchases |
303,678 |
423,113 |
409,707 |
651,546 |
740,072 |
902,813 |
|
Forward sales |
(383,693) |
(466,934) |
(499,732) |
(684,656) |
(924,064) |
(991,025) |
|
Net options position |
– |
– |
28 |
27 |
200 |
200 |
|
Net long position |
1,832 |
19,509 |
2,704 |
(233) |
7,772 |
24,471 |
As at 31 December 2012, the net exposure of the Group’s foreign exchange rate risk was a negative value of RMB 233 million, a decrease of RMB 19,742 million compared to 2011, indicating the further decrease of the Bank’s foreign exchange rate risk. Net long position in 2011 was 19,509. But in 2013 year this indicator increase to 24,471.All indicators have positive trand . During parced years all indexes are increasing. It’s occurs because bank revised his financial policy and started to optimize their activity.
Figure 2.6 present net long position during 2011 , 2012 and 2013 years.
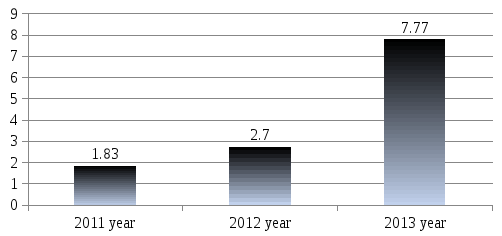
Figure 2.6 – Net long position in China Construction Bank
The Board is responsible for establishing a robust internal control policy of valuation, and takes the ultimate responsibility for the adequacy and effectiveness of internal control system. The Supervisory Board takes charge of supervising the performance of the Board and Senior Management. According to the requirements of the Board and the Supervisory Board, Management’s responsibility is to organise and implement the internal control system over the valuation process to ensure the effectiveness of the internal control system of valuation.
The Group has established an independent valuation process for financial assets and financial liabilities. The relevant departments are responsible for performing valuation, verifying valuation model and accounting of valuation results.
Certain financial assets and financial liabilities of the Group are subject to enforceable master netting arrangements or similar agreements. The agreement between the Group and the counterparty generally allows for net settlement of the relevant financial assets and financial liabilities when both elect to settle on a net basis. In the absence of such an election, financial assets and financial liabilities will be settled on a gross basis, however, each party to the master netting arrangements or similar agreements will have the option to settle all such amounts on a net basis in the event of default of the other party. Certain financial assets and financial liabilities of the Group are subject to enforceable master netting arrangements or similar agreements which are not offset in accordance with IFRS.As at 31 December 2013, the amount of the financial assets and financial liabilities subject to enforceable master netting arrangements or similar agreements are not material to the Group.
The Group has implemented a comprehensive capital management policy, covering the management of regulatory capital, economic capital and accounting capital, including but not limited to management of capital adequacy ratio, capital planning, capital raising and economic capital.
Capital adequacy ratio is a reflection of the Group’s ability to maintain a stable operation and resist adverse risks. In accordance with CBRC’s “Measures for Capital Management of Commercial Banks (trial)” and relevant regulations, commercial banks should meet the minimum capital requirements from 1 January 2013. The Common Equity Tier 1 ratio should be at or above a minimum of 5%, Tier 1 ratio at or above a minimum of 6% and total capital ratio at or above a minimum of 8%. Systemically important domestic banks should also meet the 1% additional capital requirement, with their Common Equity Tier 1 capital. Meanwhile, in accordance with CBRC’s “Notice of relevant transitional arrangement for implementation of Measures for Capital Management of Commercial Banks (trial)”, a capital conservation buffer will be introduced progressively during the transitional period, which will be raised through Common Equity Tier 1 capital. If a countercyclical buffer is required or the Pillar 2 capital requirement is raised by the regulator to a specific commercial bank, the minimum requirements should be met within the transitional period.
The Group timely monitors, analyses and reports capital adequacy ratios, assesses if the capital management objectives have been met and exercises effective management of capital adequacy ratio. The Group adopts various measures such as controlling asset growth, adjusting the structure of risk assets, accumulating internal capital and raising capital through external channels, to ensure that the Common Equity Tier 1 ratio, Tier 1 ratio and total capital ratio of the Group and the Bank are in full compliance with regulatory requirements and meet internal management requirements. This helps to insulate against potential risks as well as support healthy business developments. The Group now fully complies with all regulatory requirements in this respect.
The Group’s capital planning has taken the regulatory requirements, the Group’s development strategy and risk appetite into consideration, and based on those factors the Group projects the capital usage and need. The Group regularly compares its position with its capital adequacy ratio target to ensure capital will be adequate for future or otherwise to plan for supplementation of capital.
The capital raising management of the Group involves reasonable utilisation of various capital instruments to ensure that both external regulatory and internal capital management objectives are met, taking in account capital planning and operating environment. This helps to optimise the Group’s total capital and structure, as well as improve the competitiveness of the Group’s cost of capital.
In 2013, the Bank continued to strengthen the building of anti-money laundering (AML) management policies and systems. By optimising the rules for filtering suspicious transactions and customer risk level classification, the Bank improved the reporting data quality of AML. In addition, the Bank carried out reinforced trainings and information-sharing on AML, and conducted transformation research on AML, which helped to define the method and process of AML, which are more closely related to daily operation and management.
Reputation risk is the risk of negative impacts or damages to the banks’ overall image, reputation and brand value, arising when commercial banks’ operational, managerial and other behaviours or contingencies are reported negatively by the media.
In 2013, the Bank further emphasized on reputation risk management, enhanced the reputation risk awareness among all levels of management and staff, clarified duties and requirements, and improved accountability management. The Bank launched the new generation public sentiment monitoring system, and set up the quick response mechanism for public sentiment both vertically and horizontally, to improve the reporting and response efficiency for public sentiment. In addition, the Bank amended its reputation risk management measures on the Group level and enhanced reputation risk controls over its subsidiaries and overseas entities. The Bank made emergency planning for reputation risk matters, clarified working procedures, and organised emergency drills in order to improve the reputation risk management capability.
The Bank conducts consolidated management over its subsidiaries, and imposes comprehensive and continuous management over the Group’s capital, finance and risks based on the single legal person, to identify, measure, monitor and assess the overall risk profile of the Group. In 2013, the Bank strengthened overall planning of consolidated management, optimised consolidated management system, and orderly conducted the follow-up consolidated management targeted at the weak links.
Reinforcing the Group’s large risk exposure management. The Bank optimised the industry limit management scheme by incorporating the subsidiaries into the industry limit management scope. The Bank promoted the unified credit management on the Group level to prevent excessive concentration of risks.
Conducting monitoring and supervision of consolidated management. The Bank organised and conducted examinations on consolidated risks, and timely found out and improved internal control deficiencies. The Bank actively cooperated with the CBRC to conduct on-site inspection of connected businesses of the shadow bank as well as the related audit checks by the National Audit Office to promote the Group’s compliance operation.
Enhancing risk management in other fields on the Group level. The Bank reinforced liquidity risk management on the Group level, and incorporated the liquidity risk profile of its subsidiaries into the Bank’s liquidity risk monitoring report. The Bank standardised the prevention work related to the Group’s legal risks, and made emergency response plans on material risks and contingencies in legal category. In addition, the Bank enhanced the data management of the Group’s internal transactions, with improved consolidated management of internal transactions.
Promoting the building of consolidated management information system in an active manner. The Bank initially established an information reporting and submission platform of the consolidated management in compliance with both the internal and external management requirements. The Bank integrated the financial statements and the underlying data of its subsidiaries, and clarified the information reporting and submission mechanism for consolidated management, to improve the standardisation and accuracy.
In order to promote the establishment of a sound and effective risk management mechanism, internal control system and corporate governance procedures, the Bank’s internal audit department evaluates the effectiveness of the internal controls and risk management, the effect of corporate governance procedures, the efficiency of business operations, and the economic responsibilities of key managers, and puts forward suggestions for improvement on the basis of its internal audit.
2.3 Effectiveness analysis of risk management in China construction bank
In 2013, the Group recorded profit before tax of 279,806 million, up 11.28% over 2012. Net profit was 215,122 million, up 11.12% over 2012 The steady growth of the Group’s profitability was mainly due to the following factors: First, the interest-earning assets increased moderately, pushing up net interest income by 36,342 million, or 10.29% over 2012. Second, the Group actively conducted service and product innovations, with the net fee and commission income steadily increasing by 10,776 million, or 11.52% over the previous year. And third, the Group further improved its cost management and optimised its expenses structure, resulting in a significant decrease in the growth rate of operating expenses compared with that of last year.
The table 2.10 sets forth the Group’s composition of the statement of comprehensive income and the changes during the respective periods.
Table 2.10 - The Group’s composition of the statement of comprehensive income
|
Indicators |
2011 |
2012 |
2013 |
Changes 2012/2011 |
Changes 2013/2012 |
|
Net interest income |
304,572 |
353,202 |
389,544 |
15.97 |
10.29 |
|
Net fee and commission income |
86,994 |
93,507 |
121,596 |
7.49 |
11.22 |
|
Other operating income |
7,837 |
15,824 |
104,283 |
101.91 |
11.52 |
|
Operating income |
399,403 |
462,533 |
511,140 |
15.81 |
10.51 |
|
Operating expenses |
(144,537) |
(171,081) |
(188,185) |
18.36 |
10.00 |
|
Impairment losses |
(35,783) |
(40,041) |
(43,209) |
11.90 |
7.91 |
|
Share of profits |
24 |
28 |
60 |
16.67 |
114.29 |
|
Profit before tax |
219,107 |
251,439 |
279,806 |
14.76 |
11.28 |
|
Income tax expense |
(49,668) |
(57,837) |
(64,684) |
16.45 |
11.84 |
|
Net profit |
169,439 |
193,602 |
215,122 |
14.26 |
11.12 |
|
Other comprehensive income for the year, net of tax |
(1,918) |
(3,511) |
(23,422) |
83.06 |
555.34 |
|
Total comprehensive income for the year |
167,521 |
190,091 |
191,700 |
13.47 |
0.88 |
In 2013, the Group’s net interest income was 389,544 million, an increase of 36,342 million, or 10.29%, over the previous year. The net interest income accounted for 76.21% of the operating income. Figure 2.7 shows changes in net interest income , net fee and commission income , operating income.
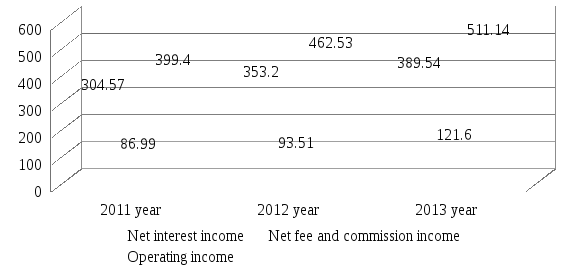
Figure 2.7 - The Group’s composition of the statement of income
In 2012, the Group’s net interest income was 353,202 million, an increase of 48,630 million, or 15.97%, over the previous year. The net interest income accounted for 76.36% of the operating income.
Table 2.11 sets forth the Group’s average balances of assets and liabilities, related interest income or expense, and average yields or costs during the respective periods.
Table 2.11 - Group’s average balances of assets and liabilities, related interest income or expense of China Construction Bank
|
Indicators |
2011 |
2012 |
2013 |
|||
|
Average balance |
Interest income/ expense |
Average balance |
Interest income/ expense |
Average balance |
Interest income/ expense |
|
|
1 |
2 |
3 |
4 |
5 |
6 |
7 |
|
Total interest-earning assets |
11,292,800 |
482,247 |
12,845,124 |
603,241 |
14,220,279 |
646,253 |
|
Total allowances for impairment losses |
(164,389) |
- |
(193,168) |
- |
(222,278) |
- |
|
Non-interest-earning assets |
383,077 |
- |
513,587 |
- |
523,820 |
- |
|
Total assets |
11,511,488 |
482,247 |
13,165,543 |
603,241 |
14,521,821 |
646,253 |
|
Continuation of table 2.7 |
||||||
|
1 |
2 |
3 |
4 |
5 |
6 |
7 |
|
Total interest liabilities
|
10,452,801 |
177,675 |
11,815,615 |
250,039 |
12,992,418 |
256,709 |
|
Non-interest-bearing liabilities |
282,713 |
- |
440,434 |
- |
495,122 |
- |
|
Total liabilities |
10,735,514 |
177,675 |
12,256,049 |
250,039 |
13,487,540 |
256,709 |
|
Net interest income |
- |
304,572
|
- |
353,202 |
- |
389,544 |
In 2013, in active response to challenges and opportunities arising from interest rate liberalisation, the Group cultivated and improved its pricing ability under the condition of interest rate liberalisation, refined its pricing models and authorisation management, enhanced the pricing support for branches and the bank counters and improved its deposit and loan pricing ability. As a result, the Group maintained relatively stable net interest margin and net interest spread, which were 2.74% and 2.56%, slightly decreased by one and two basis points year-on-year, respectively.
The net interest income of some banks is more sensitive to changes in interest rates than others. This can vary according to several factors, such as the type of assets and liabilities that are held. Banks with variable rate assets and liabilities will obviously be more vulnerable to changes in interest rates than those with fixed-rate assets. Banks with liabilities that reprice more often or quicker than its assets will also be affected by interest rate changes.
Net interest income (NII) is the difference between revenues generated by interest-bearing assets and the cost of servicing (interest-burdened) liabilities. For banks, the assets typically include commercial and personal loans, mortgages, construction loans and investment securities. The liabilities consist primarily of customers' deposits. NII is the difference between interest payments the bank receives on loans outstanding and interest payments the bank makes to customers on their deposits.
Net interest income increased by 36,342 million (Table 2.12) over the previous year, in which an increase of 49,705 million was due to the movement of average balances of assets and liabilities, and a decrease of 13,363 million was due to the movement of average yields or costs.
Table 2.12 - The effects of the movement of the average balances and average interest rates of China Construction Bank
|
(In millions of RMB) |
Volume factor |
Interest rate factor |
Change in interest income/expense |
|
Assets |
|
|
|
|
Gross loans and advances to customers |
64,289 |
(36,931) |
27,358 |
|
Investments in debt securities |
4,487 |
4,645 |
9,132 |
|
Deposits with central banks |
1,892 |
1,003 |
2,895 |
|
Deposits and placements with banks and non-bank financial institutions |
2,644 |
1,385 |
4,029 |
|
Financial assets held under resale agreements |
(350) |
(52) |
(402) |
|
Change in interest income |
72,962 |
(29,950) |
43,012 |
|
Liabilities |
|
|
|
|
Deposits from customers |
21,927 |
(9,930) |
11,997 |
|
Deposits and placements from banks and non-bank financial institutions |
(4,548) |
(6,258) |
(10,806) |
|
Financial assets sold under repurchase agreements |
(1,068) |
(89) |
(1,157) |
|
Debt securities issued |
3,266 |
(423) |
2,843 |
|
Other interest-bearing liabilities |
3,680 |
113 |
3,793 |
|
Change in interest expense |
23,257 |
(16,587) |
6,670 |
|
Change in net interest income |
49,705 |
(13,363) |
36,342 |
After calculation we observe positive dynamic. It says about effectiveness of risk management. Bank singled out sucsesfull policy and new management tools.Change in net interest income is 36,342. The greatest impact for this index has volume factor.
For some companies, interest income is small or meaningless. For others, such as an insurance company that generates profit by investing the money it holds for policyholders into interest paying bonds, it is a crucial part of the business. For example, in 2014, the insurance industry is approaching a period where the bonds held in the corporate portfolios, the ones that were bought back when interest rates were much higher, will be coming up to their maturity dates. That means the money will have to be put into lower yielding bonds, causing a substantial hit to profits; something very few investors are factoring into their calculation at the moment, causing insurance stocks to be overvalued because past earnings aren't indicative of future interest income.Table 2.13 shows changes in interest income.
Table 2.13 - Forth the average balance of each component of the Group’s loans and advances to customers
|
Indicators |
2011 |
2012 |
2013 |
|
Corporate loans and advances |
249,226 |
307,355 |
316,540 |
|
Short-term loans |
76,110 |
104,219 |
108,233 |
|
Medium to long-term loans |
173,116 |
203,136 |
208,307 |
|
Personal loans and advances |
82,732 |
112,586 |
129,438 |
|
Discounted bills |
7,496 |
8,694 |
7,510 |
|
Overseas operations and subsidiaries |
8,066 |
13,056 |
15,561 |
|
Gross loans and advances to customers |
347,520 |
441,691 |
469,049 |
Corporate loans and advances increase on 58,129 or 23 % in 2012 year and on 9185 or 2,9 % in 2013.And Short-term loans increase on 28,109 or 36% in 2012 .In 2013 year this indicator increase on 4,014 or 3,8 %. Personal loans and advances have positive dynamic and increase on 29,854 or 36 %. Figure 2.8 illustrate these increases.
In this amount, the proportion of interest income from loans and advances to customers, investments in debt securities, deposits with central banks, deposits and placements with banks and non-bank financial institutions, financial assets held under resale agreements was 73.22%, 16.65%, 5.75%, 3.46% and 0.92% respectively.
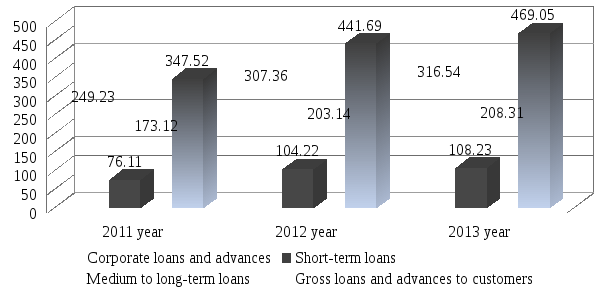
Figure 2.8 - Forth the average balance of each component of the Group’s loans and advances to customers
Interest income from loans and advances to customers rose by 27,358 million, or 6.19% year-on-year, to 469,049 million, mainly because the average balance of loans and advances to customers increased by 15.33%, and the average yield of loans and advances to customers decreased by 50 basis points to 5.79% over the previous year, mainly due to the repricing of existing loans interest rate. The Group actively adjusted credit structure and enhanced pricing management, and the weighted average interest rate for newly granted loans maintained at a good level.
Interest income from investments in debt securities grew by 9,132 million, or 9.09% over 2012, to 109,576 million. This was mainly because the average balance and average yield of investments in debt securities increased over 2012, due to the optimisation of structure of investments portfolio, and increased investments in high-yield debt securities.
Interest income from deposits with central banks amounted to 37,589 million, an increase of 2,895 million, or 8.34% over 2012. This was mainly due to the increase of the average balance of deposits with central banks.
Revenue taken in by financial institutions from account-related charges to customers. Charges that generate fee income include non-sufficient funds fees, overdraft charges, late fees, over-the-limit fees, wire transfer fees, monthly service charges, account research fees and more. Credit unions, banks and credit card companies are types of financial institutions that earn fee income.
In 2012, the Group’s net fee and commission income increased by 7.49% over 2011 to 93,507 million. The ratio of net fee and commission income to operating income dropped by 1.56 percentage points to 20.22% (Table 2.13). The slower growth rate of net fee and commission income was mainly due to the following factors :
a) with the slowdown of economic growth in China, growth rates of market-related products fell;
b) the regulatory standards tended to be more stringent, calling for a higher standard in setting service fees;
c) the Group voluntarily waived service charges on certain personal and small business customers.
Figure 2.9 present changes of fee and commission income of China Construction Bank.
Table 2.13 – Fee and commission income of China Construction Bank
|
Indicator |
2011 |
2012 |
2013 |
Changes 12/11 |
Changes 13/12 |
|
Fee and commission income |
89,494 |
96,218 |
107,432 |
7.51 |
11.65 |
|
Bank card fees |
14,910 |
20,137 |
25,783 |
35.06 |
28.04 |
|
Consultancy and advisory fees |
17,488 |
19,722 |
21,130 |
12.77 |
7.14 |
|
Settlement and clearing fees |
14,210 |
11,423 |
12,422 |
(10.12) |
8.75 |
|
Agency service fees |
13,484 |
12,772 |
12,395 |
(15.28) |
(2.95) |
|
Wealth management service fees |
7,907 |
9,381 |
10,680 |
18.64 |
13.85 |
|
Commission on trust and fiduciary activities |
7,732 |
8,380 |
9,135 |
8.38 |
9.01 |
|
Electronic banking service fees |
4,246 |
4,760 |
5,740 |
12.11 |
20.59 |
|
Credit commitment fees |
2,369 |
2,636 |
2,741 |
11.27 |
3.98 |
|
Guarantee fees |
2,495 |
1,931 |
1,886 |
(22.61) |
(2.33) |
|
Others |
4,653 |
5,076 |
5,520 |
9.09 |
8.75 |
|
Fee and commission expense |
(2,500) |
(2,711) |
(3,149) |
8.44 |
16.16 |
|
Net fee and commission income |
86,994 |
93,507 |
104,283 |
7.49 |
11.52 |