

курсова_1 / 1997
.pdf
|
|
|
|
|
|
|
|
9 |
|
500 |
|
|
|
|
|
|
|
(Ah) |
400 |
|
|
|
|
|
|
|
|
|
|
|
|
|
|
|
|
Capacity |
300 |
|
|
|
|
|
|
|
200 |
|
|
|
|
|
|
|
|
Actual |
|
|
|
|
|
|
|
|
|
|
|
|
|
|
|
|
|
|
100 |
|
|
|
|
|
|
|
|
0 |
0 |
100 |
200 |
300 |
400 |
500 |
600 |
|
|
|
|
|
Current (amps) |
|
|
|
Figure 4 Actual Capacity versus Discharge Current for Four Different VRLA cell sizes. (Nominal capacities of cells shown are 198, 264, 330, and 462 Ah.)
4.1Input File Preparation
4.1.1Battery Cycle Life and Capacity
The battery cycle life and capacity data used for the NiCd cells is as appears in Figure 1 and Table 1 respectively. The cycle life and capacity data used for the VRLA cells is shown in Figures 3 and 4.
4.1.2Cell Discharge Profile
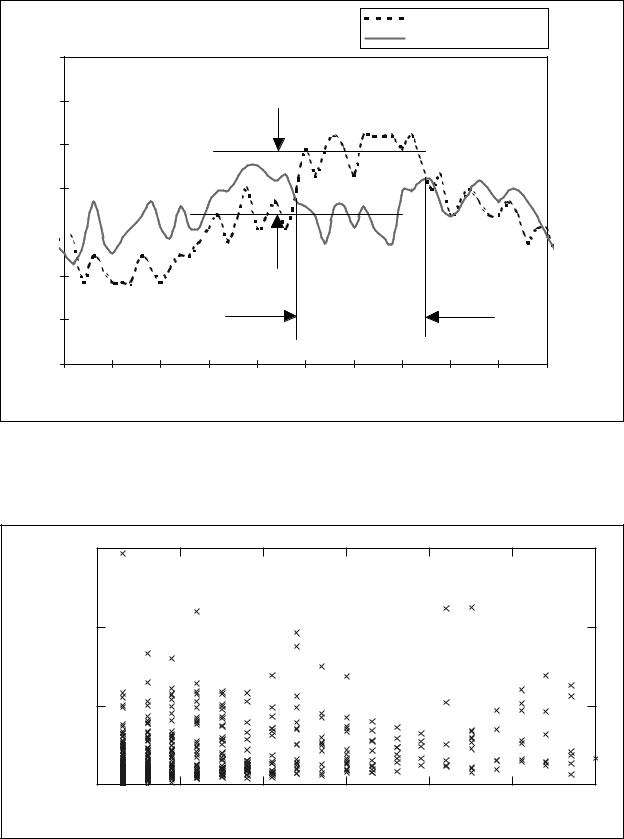
The discharge profile input consists of a series of approximately 600 discharge events of specified current and duration. This series was obtained through an analysis of measured time series data of available wind power and village load at an Alaskan village. As shown in Figure 5, a discharge event is defined at a distinct period where the village load continuously exceeds the available wind power. Due to the strategy of using battery storage for short term peak shaving, only discharge events of less than 30 minutes were included in the data set. The battery bank has a nominal voltage
of 240 volts. For each discharge event, the average discharge current is determined from the average discharge power assuming a battery discharge voltage of 210 volts. The discharge isolated in Figure 4 has a current of 36.7 A and a duration of 14 minutes. The complete discharge data set, which represents a system operating period of 7 days, is shown in Figure 6.
10
Power (kW)
Village Load
Available Wind Power
85
average discharge power = 7.07 kW average discharge current = 33.67 A
80
75
70
65 


60
55
discharge duration = 14 minutes
50 |
|
|
|
|
|
|
|
|
|
|
10100 |
10105 |
10110 |
10115 |
10120 |
10125 |
10130 |
10135 |
10140 |
10145 |
10150 |
Time (minutes)
Figure 5 Determination of Current and Duration of Each Discharge Event
|
300 |
|
|
|
|
|
|
|
(amps) |
200 |
|
|
|
|
|
|
|
Current |
|
|
|
|
|
|
|
|
|
|
|
|
|
|
|
|
|
Discharge |
100 |
|
|
|
|
|
|
|
|
|
|
|
|
|
|
|
|
|
0 |
0 |
5 |
10 |
15 |
20 |
25 |
30 |
|
|
|
|
Discharge Duration (minutes) |
|
|
||
Figure 6 The Complete Data Set of Discharge Events used in the Analysis Example

11
4.1.3Final Discharge Voltage
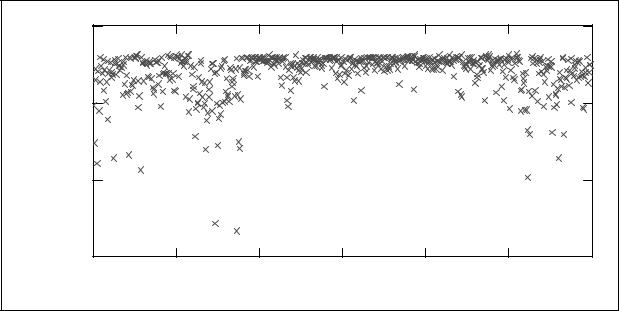
When sizing a battery for a given application, it is important to verify that the cell size chosen can actually deliver the required current for the required length of time without dropping below a certain minimum voltage. The minimum acceptable voltage per cell will depend on the specific battery type and on the voltage window tolerable by the load. So, in addition to the effective discharge and cell life calculations, our computer model determines the final discharge voltage for each discharge event. Knowing the minimum cell voltage that would be reached based on the prescribed discharge profile will help prevent an inappropriate battery choice made strictly based on predicted life time. The final discharge voltage computation is done by interpolating the cell manufacturer’s discharge voltage versus DOD data for each discharge event. This method requires that we assume an initial state of charge for each discharge. In our analysis we assumed that the cell would begin each discharge at 80% state of charge, which will not of course be exactly true. It is however, a desirable operating target. The manufacturer’s data for the NiCd cells of the example analysis is shown in Figure 7. The final discharge voltages calculated for a 111 Ah NiCd cell subjected to the set of discharge events represented in Figure 6 is shown in Figure 8.
|
1.4 |
|
|
|
|
|
|
|
|
|
|
|
|
1.3 |
|
|
|
|
|
|
|
|
|
|
|
|
1.2 |
|
|
|
|
|
|
|
|
|
|
|
Voltage |
1.1 |
|
|
|
|
|
|
|
|
|
|
|
|
|
|
|
|
|
|
|
|
|
|
|
|
Cell |
1 |
|
|
|
|
|
|
|
|
|
|
|
|
|
|
|
|
|
|
|
|
|
|
|
|
|
0.9 |
|
|
|
|
|
|
|
|
|
|
|
|
0.8 |
|
|
|
|
|
|
|
|
|
|
|
|
0.7 |
0 |
10 |
20 |
30 |
40 |
50 |
60 |
70 |
80 |
90 |
100 |
|
|
|
|
|
|
Absolute Depth of Discharge (%) |
|
|
|
|||
Figure 7 Discharge Voltage versus Depth of Discharge for Various Discharge Currents Based on Manufacturer’s Data for Pocket Plate NiCd Cells.
|
|
|
|
|
|
|
12 |
|
1.4 |
|
|
|
|
|
|
Voltage |
1.2 |
|
|
|
|
|
|
Discharge |
|
|
|
|
|
|
|
1 |
|
|
|
|
|
|
|
Final |
|
|
|
|
|
|
|
|
0.8 |
100 |
200 |
300 |
400 |
500 |
600 |
|
0 |
||||||
|
|
|
Discharge Event Number |
|
|
||
Figure 8 Final Discharge Voltages for each Discharge Event on a 111 Ah NiCd cell.
4.2Results of the Example Analysis
The results of the analysis are shown in Table 2. The minimum acceptable discharge voltage for the NiCd cells is about 0.8 volts. Therefore we can eliminate from consideration all but the two largest NiCd cells. We did not have sufficient discharge voltage versus DOD data for the VRLA to compute the minimum discharge voltage that would be caused by our prescribed discharge profile. As one would expect, the predicted cell life time increases with increasing nominal capacity, because the larger cells are not working as hard and thus not wearing as rapidly as the smaller ones. The annualized cost of a 240V battery bank is computed using purchase prices of $1,100/kWh nominal capacity for the NiCd cells and $250/kWh for the VRLA cells. The larger sizes of the VRLA cells appear to offer a more economical battery for this application than either of the NiCd cells. However, several things would have to be verified before making a final selection, for example: 1) Is it reasonable, given battery aging processes, to expect a VRLA battery to last 11 or 19 years? 2) Can the VRLA cells handle the rapid charge rates (which would be about equal to the maximum discharge rates) called for in this application? 3) Do the minimum final discharge voltages for the VRLA cells fall within the acceptable range?

|
|
|
|
|
|
13 |
|
|
|
|
|
|
|
Cell Type |
Nominal |
Nominal Charge |
Effective Discharge |
Predicted Life |
Minimum |
Annualized Cost |
|
Capacity |
Life |
(Ah per 7 days) |
(years) |
Discharge |
of 240V Battery |
|
(Ah) |
(Ah) |
|
|
Volts per Cell |
|
|
|
|
|
|
|
|
NiCd |
58 |
119000 |
1805 |
1.3 |
<0 |
-- |
|
|
|
|
|
|
|
NiCd |
67 |
138000 |
1307 |
2.0 |
<0 |
-- |
|
|
|
|
|
|
|
NiCd |
85 |
175000 |
798 |
4.2 |
<0 |
-- |
|
|
|
|
|
|
|
NiCd |
93 |
191000 |
672 |
5.5 |
.39 |
-- |
|
|
|
|
|
|
|
NiCd |
102 |
210000 |
574 |
7.0 |
.59 |
-- |
|
|
|
|
|
|
|
NiCd |
111 |
228000 |
496 |
8.8 |
.69 |
-- |
|
|
|
|
|
|
|
NiCd |
128 |
263000 |
386 |
13.1 |
.84 |
$2,580 |
|
|
|
|
|
|
|
NiCd |
137 |
282000 |
344 |
15.7 |
.92 |
$2,304 |
|
|
|
|
|
|
|
VRLA |
198 |
152000 |
1713 |
1.7 |
NAd |
$6,988 |
VRLA |
264 |
212000 |
578 |
6.7 |
NA |
$2,364 |
|
|
|
|
|
|
|
VRLA |
330 |
253000 |
455 |
10.6 |
NA |
$1,868 |
|
|
|
|
|
|
|
VRLA |
462 |
354000 |
357 |
19.0 |
NA |
$1,459 |
Table 2 Results of the Comparative Battery Life Analysis
5.Conclusions
We have presented a method for estimating the life of battery cells subjected to a specified pattern of discharge cycles of varying depth and rate. The method relies largely on battery cycle life and capacity data commonly available from battery manufacturers, but its accuracy could be enhanced by test data on the effect of discharge rate on cycle life. We have demonstrated the potential utility of the method if it proves to be valid, but we cannot yet verify the validity of the method, because we do not have sufficient life cycle data. Obtaining cycle life data over a wide range of discharge rates and for different battery types should be a focus of future work.
If battery cell life testing shows the model to be accurate, and as the parameters of Equation 4 are determined for a variety of cell types, the method could be combined with one of the excellent battery performance models that exist5 to make it less dependent on the availability of detailed capacity data from battery manufacturers.
dFinal discharge voltage data not available for the VRLA cells.
14
List of Symbols
'A |
amp-hour life of a cell subjected under actual operating conditions |
'R |
amp-hour life of a cell under repeated discharges of rated DOD and rated discharge current |
CA |
amp-hour capacity of a cell at a given discharge current |
CR |
amp-hour capacity of a cell at rated discharge current |
D |
actual discharge as a percentage of rated capacity |
DR |
percent depth of discharge at which rated cycle life was determined |
dactual |
actual amp-hour discharge |
deff |
effective amp-hour discharge as adjusted for depth and rate of discharge |
I |
discharge current |
L |
cycle life of cell at a given percent discharge and discharge current |
LR |
cycle life at rated depth of discharge and rated discharge current |
Ltime |
life time (years) of the cell under actual operating conditions |
T |
time period corresponding to the series of discharge events used as input data |
References
1.H. Wenzl, Understanding Batteries - The Effect of Discharging and Charging, pp. 38-39. Dr. Heinz Wenzl, Consultant for Batteries & Power Technology, Am Bergwaldchen 27,
D-37520 Osterode,Germany, 1996.
2.P. Symons, “Life Estimation of Lead-Acid Battery Cells for Utility Energy Storage,” Proceedings of the Fifth conference on Batteries for Utility Storage, San Juan, Puerto Rico; July, 1995.
3.H. Wenzl, op.cit., pp.13-20.
4.A. Winsel, E. Voss, U. Hullmeine, Die Kugelhaufenelektrode, Dechema Monographien, Bd. 121, Frankfurt a. Main, Germany, 1989.
5.J. Manwell, J. McGowan, I. Baring-Gould, W. Stein; “Recent Progress in Battery Models for Hybrid Wind Power Systems”; Proceedings of the WINDPOWER ‘95 Conference; Washington, DC; March 26-30, 1995.