

Cell Biology Protocols
.pdfto evaporate (15 min). The aim is to remove the rest of ethanol, which is not miscible with DGD.
7.Prewarm a mixture of 1 : 1 (v/v) DGD : isobutanol in the oven at 60 ◦C and pour over the cells. Leave the samples in the oven until butanol evaporates
(approximately 30 min) and infiltrate the cells with molten DGD (60 ◦C) twice, 60 min each.
8.Place the samples at room temperature to solidify. For cells on coverslips, peel the coverslip from DGD; the cells will remain embedded in DGD as a monolayer. For samples in the capsules, cut away the capsule and trim the block to a surface of 1–2 mm.
9. Cut with glass or diamond knives at angle of 10◦ on the microtome. Thickness between 0.1 and 1 µm can be obtained, but we had best results with 0.3 µm sections. The interference colour of the sections is the same as for Epon sections.
10.Collect the sections on the carboncoated copper grinds that have additionally been coated with poly-L- lysine.
11.Remove DGD by immersing the grids for 1 h in toluene at room temperature.
12.Transfer the grids to a 1 : 1 (v/v) solution of ethanol : toluene for 5 min, and then to three changes of 100% ethanol
(each 10 min). At this step the sections may be processed for immunogold staining, as described in Procedure 3 below. If immunocytochemistry is not required, immerse the grids for 5 min in a 1 : 1 (v/v) mixture ethanol : HMDS followed by three changes of HMDS, 10 min each. Air-dry.
13.The sections may optionally be carboncoated to increase the robustness of the samples.
PROTOCOL 6.32 |
321 |
3. Staining with antibodies
Reagents
Buffered paraformaldehyde/glutaraldehyde: 3.7% paraformaldehyde and 0.1% glutaraldehyde in extraction buffer 1
Comment: Prepared freshly, stored at 4 ◦C for up to 3 h.
PTA buffer (PBS-Tween-albumin): 0.05% (v/v) Tween 20, 0.1% (w/v) bovine serum albumin in PBS
Comments: Place a vessel with PBS on a magnetic stirrer and dissolve the required amount of Tween 20. Switch the stirrer off, sprinkle albumin pulver on the fluid surface, switch the stirrer on and stir slowly until albumin is dissolved (about 1 h). Sterile filtrate. PTA buffer can be stored at 4 ◦C for a week or frozen for several months.
Glutaraldehyde cacodylate buffer: 2.5% glutaraldehyde dissolved in 0.1 M sodium cacodylate buffer, pH 7.2
Buffered osmium tetroxide: prepared as for section 2, above
Antibodies
Primary mouse, rabbit and goat antibodies have been used. An antibody that worked for the post-embedding immunogold electron microscopy is also likely to work for EFEM. We used the following secondary, gold-labelled antibodies: donkey anti-rabbit (4 nm gold), donkey antigoat (12 nm), donkey anti-mouse (20 and 30 nm) (Jackson ImmunoResearch, West Grove, PA). We dilute antibodies in PTA buffer or in PBS. PTA buffer gives lower background staining.
Procedure 3
We have developed the following postembedding protocol, where the sections
322 IN VITRO TECHNIQUES
are stained after DGD embedding. An alternative pre-embedding protocol can be found in ref. 4. Post-embedding staining gives results with a very low background, but some epitopes may be masked during prior embedding steps.
1.Cell extraction: performed as above in Procedure 1 (steps 1–5).
2.Fixation. Pure glutaraldehyde is a heavily cross-linking agent and may mask some epitopes. If problems are encountered we had good results after fixing
with buffered paraformaldehyde/glutaraldehyde for 3 h at 4 ◦C. This solution should be prepared freshly from the EMgrade reagents. Osmium post-fixation (steps 7–9, Procedure 2) is omitted.
3.Embedding in DGD, sectioning, removal of DGD: performed as above in section 2, steps 10–17.
4.Rehydrate the material by immersing
in a series of alcohols: 100, 96, 90, 80, 70, 50, 30%, 2 × 5 min at room temperature (RT).
5.Rinse the grids with the material by
floating them on PBS for 10 min followed by PTA buffer 10 min, RT. All incubation/washing steps are performed by placing the grids on a large drop of fluid placed on Parafilm or similar hydrophobic membrane, specimen side down.
6.Block with 5% normal donkey serum in PTA buffer for 10 min, RT.
7.Incubate with the first antibody. Depending on the type of antibody, incubation times from 2 h to overnight are
appropriate. For short times incubation at 37 ◦C rather than at 4 ◦C gives better results. All antibody dilutions are made in PTA buffer.
8.Rinse in PTA buffer three times, 5 min each, RT.
9.If double or triple staining is performed incubate with additional primary antibodies.
10. Rinse in PTA buffer three times,
5 min each at RT, followed by additional blocking with 5% normal donkey serum in PTA buffer for 10 min.
11.Incubate with gold-labelled secondary
donkey antibodies diluted in PTA. Usually 1–2 h at 37 ◦C would suffice.
12.Rinse in PBS, 3 × 10 min, RT.
13.Rinse in sodium cacodylate buffer, three times, 5 min, RT.
14.Fixed in glutaraldehyde cacodylate buffer for 1 h at 37 ◦C.
15.Post-fix in buffered osmium tetroxide
for 30 min |
followed by a rinse for |
30 min in |
sodium cacodylate buffer |
at RT. |
|
16.Dehydrate in ethanol 50–100% as described above (Procedure 2, step 5).
17.Transfer to the mixture 1 : 1 (v/v) 100% ethanol : HMDS for 10 min followed by three changes of HMDS, 10 min each. Air-dry.
18.The grids containing the dried samples can be lightly carbon coated in a Kinlay carbon evaporator and stored in a dessicator.
Results
Images of cell scaffolds after cell extraction and EFEM (Procedures 1 and 2) should reveal a continuous meshwork of filaments in the cytoplasmic and nuclear areas (Figure 6.31). The thickness and arrangement of filaments depend on cell type and state of differentiation. For example in C6 glioma the cell line cytomatrix comprises 10–15 nm branched fibrils, 5 nm microfilaments and short
PROTOCOL 6.32 |
323 |
(a)
(b)
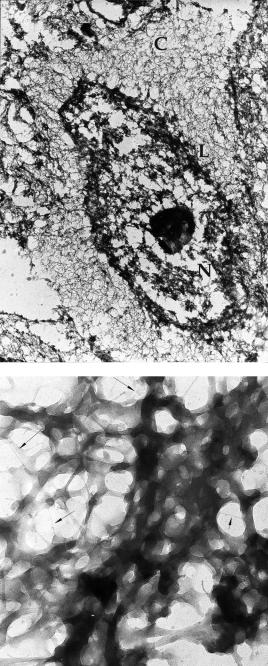
Figure 6.31 EFEM of extracted human keratinocyte showing cytomatrix and nuclear matrix.
(a) Low magnifications with a meshwork of filaments in the cytoplasmic field (C), nuclear lamina
(L) and the coarse nuclear matrix (N). (b) High magnification showing filaments of different diameter in the cytomatrix. Arrows: ultrathin 1 nm filaments
324 IN VITRO TECHNIQUES
(a)
(b)
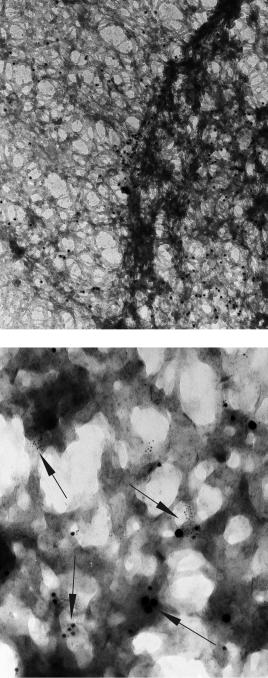
Figure 6.32 Post-embedding immunogold cytochemistry on extracted COLO 20 cells. (a) Anti-Bax staining during apoptosis showing concentration of Bax at the nuclear lamin and in the nucleus.
(b) Triple immunogold labelling (anti-Bax: 4 nm gold particles, anti-Bid: 12 nm gold, anti-VDAC-1: 20 nm gold) of the nuclear matrix of COLO 25 cell during apoptosis. Note clusters of gold particles of different sizes (arrows)
(40–200 nm) very thin (1–3 nm) fibrils [6]. A similar structure of the cytomatrix was seen in proliferating human keratinocytes, but during cell differentiation the 5 and 1 nm filaments disappeared and were replaced by a tight meshwork of 15 nm fibrils [7]. The nuclear matrix consists of a meshwork of 10–30 nm filaments attached to a compact nuclear lamina. Ultrathin 1 nm filaments are also present in the nuclear matrix. The globular portion of the nuclear matrix corresponds to ribonucleoprotein.
Examples of post-embedding immunogold labelling of extracted matrices are shown in Figure 6.32. Details of antibody concentration and incubation tomes may be found in our recent publications [5, 8]. Labelling with up to three antibodies is feasible.
References
1.Capco, D. G., Krochmalnic, G. and Penman, S. (1984) A new method of preparing embed- ment-free sections for transmission electron microscopy: applications to the cytoskeletal framework and other three-dimensional networks. J. Cell Biol., 98, 1878–1885.
2.Penman, S. (1995) Rethinking cell structure.
Proc. Nat. Acad. Sci. USA, 92, 5251–5257.
PROTOCOL 6.32 |
325 |
3.Fey, E. G., Krochmalnic, G. and Penman S. (1986) The nonchromatin substructures of the nucleus: the ribonucleoprotein (RNP)- containing and RNP-depleted matrices analyzed by sequential fractionation and resinless section electron microscopy. J. Cell Biol., 102, 1654–1665.
4.Nickerson, J. A., Krochmalnic, G. and Penman, S. (1998) Isolation and visualization of the nuclear matrix, the nonchromatin structure of the nucleus. In: Cell Biology: A Laboratory Handbook (J. E. Celis, ed.), 2nd edn, vol. 2, pp. 194–192. Academic Press.
5.Gajkowska, B., Motyl, T., Olszewska-Badar¸ - czuk, H., Gniadecki, R. and Koronkiewicz, M. (2000a) Structural association of Bax with nuclear matrix and cytomatrix revealed by embedment-free immunogold electron microscopy. Cell Biol. Int., 24, 649–656.
6.Gajkowska, B., Cholewinski, M. and Gniadecki, R. (2000b) Structure of cytomatrix and nuclear matrix revealed by embedment-free electron microscopy. Acta Neurobiol. Exp., 60, 147–158.
7.Gniadecki, R., Olszewska, H. and Gajkowska, B. (2001) Changes in the ultrastructure of cytoskeleton and nuclear matrix during HaCaT keratinocyte differentiation. Exp. Dermatol., 10, 71–79.
8.Gajkowska, B. and Wojewodzka,´ U. (2002) A novel immunoelectron embedment free electron microscopy reveals association of apoptosis-regulating proteins with subcellular structures. Histochem. J., 34, 441–446.

PROTOCOL 6.33
Tubulin assembly induced by taxol and other microtubule assembly promoters
Susan L. Bane
Introduction
Substances that affect microtubule assembly and dynamics have important therapeutic applications, particularly in cancer chemotherapy. Taxol was the first example of an effector molecule of microtubule dynamics that promotes rather than inhibits in vitro microtubule polymerization. The success of Taxol as an anticancer agent has sparked a tremendous interest in the discovery of other molecules that promote microtubule assembly [1].
Microtubule assembly promoters (MTAPs) generally are screened by assessing the ability of the molecule to promote microtubule assembly in vitro. Activity is most commonly assessed as an I50 value, which is the concentration of MTAP required to promote tubulin to assemble to 50% of its maximum. This is a useful and easily obtainable value; however, some care should be taken in its interpretation. 1
Three procedures follow:
Procedure 1 . Tubulin assembly induced by Taxol. This is the basic procedure for measuring tubulin polymerization by assembly-promoting molecules such as Taxol. It can also be used to prepare Taxolmicrotubules for other studies.
Procedure 2. Potency measurements of MTAPs using absorption spectroscopy.
The basic procedure for Taxol assembly is applied to potency measurements of new substances. Absorption spectroscopy is convenient when a small number of molecules are to be screened.
Procedure 3. Potency measurements of MTAPs using fluorescence spectroscopy.
Procedures for measuring potency are performed in a 96-well plate [2]. This procedure is well suited to screening a larger number of molecules.
Reagents
Purified tubulin, free of microtubule-asso- ciated proteins 2 3
PMEG buffer: 0.1 M PIPES, 1 mM MgSO4, 2 mM EGTA, 0.1 mM GTP, pH 6.9. The buffer must be kept cold (4 ◦C) to prevent GTP hydrolysis. GTP-containing buffers are discarded after 2 weeks 4
Taxol, which is available from several commercial sources
Sephadex G-50 in PMEG buffer
Dimethylsulfoxide (DMSO), reagent grade or better
MTAPs to be tested (for Procedures 2 and 3)
4 , 6-diamidino-2-phenylindole (DAPI) (for Procedure 3)
Equipment
Gel filtration column and fraction collector
Procedures 1 and 2: Absorption spectrophotometer with thermostatted cell holder (Multicell transporter desirable)
Quartz cells for spectrophotometer. A 0.4 × 1.0 cm cell requires about 0.5 ml solution for each polymerization in a typical instrument
Procedure 3: Plate reader capable of monitoring emission at 450 nm (excitation at 360 nm).
96-well plates
Procedures
Procedure 1 Taxol-induced tubulin assembly
1.Prepare a stock solution of Taxol of approximately 1 mM in DMSO.
2.Equilibrate tubulin in cold PMEG buffer using Sephadex G-50. 5
3.Set up absorption spectrophotometer to
measure absorption at 350 nm for 15 min at a cuvette temperature of 37 ◦C.
4.Add buffer followed by tubulin to the cuvette to yield a tubulin concentration
of 10 µM in a total volume of 0.5 ml. Equilibrate solution to 37 ◦C and begin measuring absorption at 350 nm.
5.Add an aliquot of the Taxol solution to yield a final Taxol concentration of
10 µM (and a DMSO concentration of ≤3% vol/vol 6 ), mix rapidly and gently, taking care not to introduce bubbles into the cuvette.
6. Collect data until a plateau is reached.
Procedure 2 Potency of MTAPs using an absorption spectrometer
1.Prepare 1 mM stock solution of Taxol
in DMSO and stock solution(s) of the MTAP(s). 7
PROTOCOL 6.33 |
327 |
2.Prepare tubulin and absorption spectrometer as above. The rest of this protocol assumes that the absorption instrument is capable of measuring six cuvettes simultaneously.
3.Add PMEG buffer followed by tubulin to absorption cell to yield a tubulin concentration of 10 µM in a total volume
of 0.5 ml. Equilibrate the solutions to 37 ◦C and begin measuring absorption at 350 nm.
4.To the first cuvette add an aliquot of the Taxol solution to yield a final Taxol concentration of 10 µM. To the other five cuvettes, add aliquots of the MTAP
to yield the chosen final concentration of MTAP. 6 Mix each cuvette rapidly and gently, taking care not to introduce bubbles into the solution.
5.Continue measuring the absorption of the solution with time until a steady state is reached in the slowest sample.
6.Calculate the relative extent of assembly by subtracting the absorption value before addition of Taxol or MTAP from the absorption value of the plateau for each sample.
7.Determine the fraction assembled in each sample by dividing the change in absorption for the Taxol sample into the change of absorption of the other samples.
8.Plot the fraction assembled versus MTAP concentration and determine the I50.
Procedure 3 Potency of MTAPs using a multi-well plate and a fluorescence plate reader
1.Prepare 1 mM stock solution of Taxol
in DMSO and stock solution(s) of the MTAP(s) in DMSO. 7
2.Prepare a 1 mM stock solution of DAPI in water. 8
328 IN VITRO TECHNIQUES
3.Equilibrate tubulin in cold PMEG buffer using Sephadex G-50. 5
4.Prepare the tubulin-DAPI solution for pipetting into the plate. The final concentration of DAPI and tubulin in each
well will be 10 and 5 µM, respectively. 9 Mix DAPI and buffer first, then add tubulin and mix gently. Add 194 µl of this solution to each well.
5.Add the MTAP in DMSO (6 µl) to a produce a final volume of 200 µl. Prepare duplicates of each MTAP concentration. Quickly mix the solutions in the wells using a multi-channel pipettor, taking care to avoid introduction of bubbles into the wells.
6.Also prepare duplicates of two types of controls: a ‘no assembly’ control, which contains 5 µM tubulin, 10 µM DAPI, 6 µl of DMSO but no MTAP, and a ‘complete assembly’ control, which contains 5 µM tubulin, 10 µM DAPI and 10 µM Taxol.
7.Initiate the plate reader (excitation = 360 nm, emission = 450 nm 10 ) and
collect data until a plateau is reached in the wells. 11
8.Subtract the average fluorescence value for the ‘no assembly’ wells from the average of the two fluorescence values of each plateau.
9.Divide the average fluorescence value for the ‘complete assembly’ control into the average fluorescence value for each of the MTAP concentrations to determine the fraction assembled.
10.Plot fraction assembled versus concentration of MTAP and determine the I50 value.
Examples of data
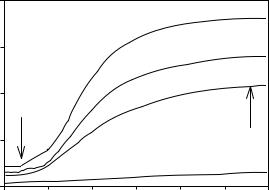
Figure 6.33 shows an example of Procedure 2 in which tubulin assembly is induced by increasing concentrations of baccatin III, an MTAP. The arrow indicates the point at which the baseline
A350
0.4
0.3
0.2
0.1
0.0
0 |
200 |
400 |
600 |
800 |
1000 |
1200 |
Time (s)
Figure 6.33 Tubulin assembly monitored on an absorption spectrometer according to Procedure 2. Assembly was initiated after a baseline was collected for about 75 s (arrow). The absorption value for the baseline is subtracted from the absorption value of the plateau (arrow) to evaluate the extent of assembly. In this illustration, assembly of 10 µM tubulin was induced by baccatin III at concentrations of 6 µM (solid curve), 3 µM (dashed curve) and 1.5 µM (dotted curve). A control containing no baccatin III is shown in the dot–dash curve. The extent of assembly of the Taxol control is not shown in this illustration
Fluorescence
A
D
PROTOCOL 6.33 |
329 |
B |
C |
|
|
E
Time (s)
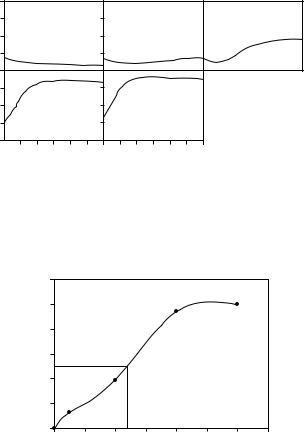
Figure 6.34 Tubulin assembly in a 96-well plate monitored by fluorescence according to Procedure 3. Fluorescence was collected over a period of 100 min at a temperature of 32 ◦C. The x and y scales of each panel are equal. Panel A is the ‘no assembly’ control, containing 5 µM tubulin without MTAP. The concentration of MTAP in panels B–E was 0.5, 2.0, 4.0 and 5.0 µM, respectively. The ‘complete assembly’ control and duplicates of each well were also run (data not shown)
Fraction polymerized
1.2
1.0
0.8
0.6
0.4
0.2
0.0
0 |
1 |
2 |
3 |
4 |
5 |
6 |
7 |
|
|
|
[MTAP] ( M) |
|
|
|
|
Figure 6.35 The I50 for the MTAP tested in Figure 6.36 is determined graphically to be 2.3 µM
was taken, and the second arrow indicates where the absorption reading for the plateau was taken.
Figure 6.34 shows an example of Procedure 3 in which tubulin assembly is induced by increasing concentrations of a Taxol analogue.
Figure 6.35 shows a plot of the fraction of tubulin assembled as a function of MTAP concentration and the I50 value.
Notes
1 Assembly promotion |
is |
a |
function |
of both the affinity |
of |
the |
MTAP |
for the receptor site (Ka) and the |
|||
critical concentration |
of |
tubulin in |
|
the presence of saturating concentrations of the MTAP (Ccrit). A structural alteration of Taxol can affect its Ka, Ccrit or both parameters. For more detailed discussions, see refs 3 and 4.
2 If only a few measurements are anticipated, the protein can be purchased from Cytoskeleton, Inc. If many measurements are to be done, it is more cost effective to purify the protein from mammalian brain, described in ref. 5.
3 These assays can also be performed using microtubule protein, which is tubulin plus microtubule-associated
330 IN VITRO TECHNIQUES
proteins (MAPs). MAPs lower the critical concentration of tubulin. Therefore, if microtubule protein is used, a lower protein concentration may be necessary to prevent polymerization of the ‘no assembly’ controls.
4 It is convenient to prepare stock solutions of the individual components: 0.4 M PIPES, pH 6.9, prepared from the free acid and 5 M NaOH; 100 mM EGTA, pH 6.9, prepared from the free acid and 1 M NaOH; 50 mM MgSO4, and 50 mM GTP. PIPES stock is stored at 4 ◦C, GTP stock is stored at −20 ◦C or below, MgSO4 and EGTA stocks are stored at 25 ◦C.
5 If a low-speed centrifuge is available, tubulin can be quickly equilibrated into PMEG buffer by the method of Penefsky [6], in which 1 ml syringes are used instead of a single column.
6 It is known that DMSO induces tubulin to assemble at concentrations ≥8% vol/vol [7]. We have found that DMSO at a concentration of ≤3% does not affect tubulin polymerization under these assay conditions.
7 We find it convenient to make serial dilutions of the stock solutions so that an equal volume of DMSO is added to each well.
8 This solution may be frozen in small aliquots for storage at −20 ◦C. The
DAPI solutions are not subjected to a second freeze–thaw cycle.
9 We use a lower tubulin concentration in the 96-well plates than in the absorption spectrometer to decrease the mass of tubulin consumed in each experiment.
10 Appropriate cutoff filters can be used if the plate reader lacks monochrometers.
11 A plate reader equipped with a tempe- rature-controlling unit is ideal. In the absence of such an accessory it is important to maintain a constant temperature in the 96-well plate. Lower temperatures will decrease the rates of the assembly reactions.
References
1.Altman, K.-H. (2001) Curr. Opin. Cell Biol., 5, 424–431.
2.Barron, D. M., Chatterjee, S. K., Ravindra, R., Roof, R., Baloglu, E., Kingston, D. G. I. and Bane, S. (2003) Anal. Biochem., 315, 49–56.
3.Chatterjee, S. K., Barron, D. M., Vos, S. and Bane, S. (2001) Biochemistry, 40, 6964–6970.
4.Andreu, J. M. and Barasoain, I. (2001) Biochemistry, 40, 11 975–11 984.
5.Williams, R. C. Jr and Lee, J. C. (1982) Methods Enzymol., 85, 376–385.
6.Penefsky, H. S. (1979) Methods Enzymol., 56, 527–530.
7.Robinson, J. and Engelborghs, Y. (1982) J. Biol. Chem., 257, 5367–5371.