Добавил:
Upload Опубликованный материал нарушает ваши авторские права? Сообщите нам.
Вуз: Предмет: Файл:

C# ПІДРУЧНИКИ / c# / Premier Press - C# Professional Projects

.pdf
Скачиваний:
475
Добавлен:
12.02.2016
Размер:
14.7 Mб
Скачать

538 Project 4 CREATING AN AIRLINE RESERVATION PORTAL

You have developed the SkyShark Airlines application. Suppose you compile the application and run it. The application does run; however, it generates error messages or displays dialog boxes that might not be interpretable by end

users. By debugging your application, you can track and eliminate these errors.

Visual Studio .NET provides several options to help you in such situations. In this

chapter, I will discuss the various debugging tools provided by Visual Studio


Y

.NET to debug these errors. This chapter also discusses the points to be consid-

ered while testing the application.

L


F

M


Locating Errors in Programs

A


One of the most difficult tasks in developing an application is finding errors.

E


With Visual StudioT.NET it is very simple to trace syntax errors. Visual Studio

.NET warns you about syntax errors at the time of writing the code itself. In addition, these errors are listed when you compile the program in the Output window.

Visual Studio .NET provides you with a number of debugging tools and options to enable you to write error-free programs. You can see these tools and options while debugging a Visual Studio .NET program in the break mode. A program is in break mode when any error halts the execution of your program temporarily. You can also introduce a breakpoint in your application. When your application encounters a breakpoint, it enters the break mode. This mode enables you to examine the status of your application by using other debugging tools provided by Visual Studio .NET.

A program can be forced to enter the break mode by setting a breakpoint. You can set a breakpoint simply by placing the cursor on a line and pressing the F9 key. You can also set a breakpoint as follows: On the Debug menu, click the New Breakpoint option. The New Breakpoint dialog box appears as shown in Figure 23-1.

Team-Fly®

DEBUGGING AND TESTING THE APPLICATION

Chapter 23


539


FIGURE 23-1 The New Breakpoint dialog box

You can also enter the break mode from within your code by using the Stop statement.

Visual Studio .NET has four types of breakpoints, as follows:

Function breakpoint. Temporarily puts the program execution on hold when the program execution reaches a specific position within a function.

File breakpoint. Causes the program execution to halt when it reaches a specified position within the specified file.

Address breakpoint. Causes the program to break when execution reaches a specific memory location.

Data breakpoint. Causes the program execution to halt when the value of a variable changes.

The advantage of the break mode is that it enables you to modify the values of variables and properties. Now I will discuss other debugging tools available with Visual Studio .NET.

540 Project 4 CREATING AN AIRLINE RESERVATION PORTAL

Watch Window

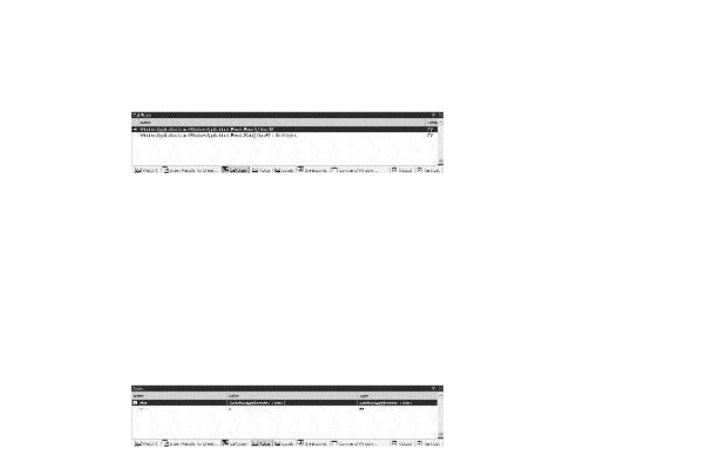
The Watch window is useful to monitor values of variables and expressions. You can add variables to the Watch window by entering the variable name in the Name column of the window or by selecting QuickWatch option from the Debug window. The Watch window can be invoked only from the break mode. Figure 23-2 displays the Watch window.

FIGURE 23-2 The Watch window

Locals Window

The Locals window displays variables that are local to the current execution context, such as the current function or module. In order to open the Locals window, you must be in debugging mode. To open the Locals window, on the Debug menu, point to Windows, and then click Locals. Figure 23-3 shows the Locals window.

FIGURE 23-3 The Locals window

Call Stack Window

The Call Stack window lists the functions and procedure calls that are currently loaded in memory in the order in which they were called. You can view this window only in the break mode.The Call Stack window displays the sequence of program execution. The Call Stack window is shown in Figure 23-4.

DEBUGGING AND TESTING THE APPLICATION

Chapter 23

541


FIGURE 23-4 The Call Stack window

Autos Window

The Autos window displays the name of all variables in the current and previous statement. You need not specify the name of the variable. The Visual Studio

.NET debugger automatically identifies the variables in the current execution location statement and displays them in the window. Figure 23-5 displays the Autos window.

FIGURE 23-5 The Autos window

Command Window

The Command window is used to evaluate expressions or issue commands when in the debug mode. To open the Command window, perform the following steps:

On the View menu, point to Other Windows.

In the displayed list, click on the Command Window option.

The Command window has two modes, Command and Immediate. Command mode is used to issue Visual Studio .NET commands, while the Immediate mode is used for debugging purposes, evaluating expressions, and printing variable values. For example, ? num, where num represents a variable, will return the value stored in the variable. Figure 23-6 displays the Command window.

542 Project 4 CREATING AN AIRLINE RESERVATION PORTAL

FIGURE 23-6 The Command window

Having learned about the basics of debugging an application, you can test the SkyShark Airlines application. The following section discusses how to test the Web site developed for SkyShark Airlines.

Testing the Application

After creating the application, you need to test the application. Testing enables you to verify that your application is secure and running smoothly. In addition, testing the Web site ensures that there are no dead links in your Web site. You can now test the Web site for SkyShark Airlines.

While testing the application, you will log in as three different users and test the functionality associated with each of the users. To start with, you will log in as the network administrator. To do this, perform the following steps:

1.Execute the application. The default.aspx page appears as shown in Figure 23-7.

FIGURE 23-7 The default.aspx page

DEBUGGING AND TESTING THE APPLICATION

Chapter 23

543


2.In the User Name box, enter the user name as admin. The admin account is created by default when you create the application.

3.In the Password box, enter the password as password.

4.Click on the Submit button. The ManageUsers.aspx page appears, as shown in Figure 23-8. This page helps the network administrators to add or delete users.

FIGURE 23-8 The ManageUsers.aspx page

5.Next, you will add a new user to the application.This user will be added as a business manager. To do this, enter the following details on the form to add new users:

User Name: RobertB

Password: Password

Confirm Password: Password

Role: BM

6.Click on the Submit button. A message appears, as shown in Figure 23-9, indicating that the user was successfully added. Now you will log on using the credentials of this new user and test the functionality provided to a business manager.

544 Project 4 CREATING AN AIRLINE RESERVATION PORTAL

FIGURE 23-9 Adding a new use r

7.Click on the Logoff link. The Logoff.aspx page appears as shown in Figure 23-10.

FIGURE 23-10 Logging off the application

DEBUGGING AND TESTING THE APPLICATION

Chapter 23

545


8.Click on the Click here to logon link to enter the application as a business manager.

9.Enter the username and password that you entered in Step 5, and click on the Submit button. The Addfl.aspx page appears as shown in Figure 23-11. This page helps a business manager to add new flights. In addition, a business manager can generate various reports.

FIGURE 23-11 The page to add new flights

10.Click on the Reports link. The Reports.aspx page appears, as shown in Figure 23-12. A business manager can use this page to view different reports.

546 Project 4 CREATING AN AIRLINE RESERVATION PORTAL

FIGURE 23-12 The page to view reports

11.Click on the second Generate button to generate the report for the top 100 customers. The report appears as shown in Figure 23-13. You will now log in as a line-of-business executive.

FIGURE 23-13 The report generated by the Web site

DEBUGGING AND TESTING THE APPLICATION

Chapter 23


547


12.Click on the Logoff link. The Logoff.aspx page appears.

13.Click on the Click here to logon link to log in to the Web site. The default.aspx page appears.

14.In the User Name box, type the username as meetag.

15.In the Password box, type the password as password.

Click on the Submit button. The CreateRes.aspx page appears as shown in Figure 23-14.

FIGURE 23-14 The CreateRes.aspx page

16.In the Flight Number box, enter 0735.

17.Click on the Next button.The details of the flight appear, as shown in Figure 23-15. You may need to scroll down.