

International_Economics_Tenth_Edition (1)
.pdfChapter 12 |
379 |
|
|
Inflation Differentials and the Dollar'sExchange Value
|
7 |
|
|
|
|
|
|
|
|
6 |
|
|
|
|
|
|
|
Q) |
|
|
|
|
|
|
|
|
15 |
|
|
|
|
|
|
|
|
'" |
4 |
|
|
|
|
|
|
|
Q) |
|
|
|
|
|
|
||
e» |
|
|
|
|
|
|
|
|
c: |
|
|
|
|
|
|
|
|
-5 |
3 |
|
|
|
|
|
Depredation |
|
x |
|
|
|
|
|
|
|
Relative to |
UJ |
|
|
|
|
|
|
|
|
c |
|
|
|
|
|
|
|
U.S Dollar |
|
|
|
|
|
|
|
|
|
|
|
|
|
|
|
|
|
|
|
0 |
|
|
|
|
|
|
|
|
- I |
|
|
|
|
|
|
|
|
-2 |
|
|
|
|
|
Appreciation |
|
|
-3 |
|
|
|
|
|
Relative to |
|
|
|
|
|
|
|
U.S. Dollar |
||
|
-4 |
|
|
|
|
|
|
|
|
-5 |
|
|
|
|
|
|
|
|
-2 |
-1 |
0 |
2 |
4 |
5 |
||
|
|
|
|
Inflation |
Differential |
|
|
|
(Average Inflation Rate of Foreign Country Minus Average
Inflation Rate of the United Slates)
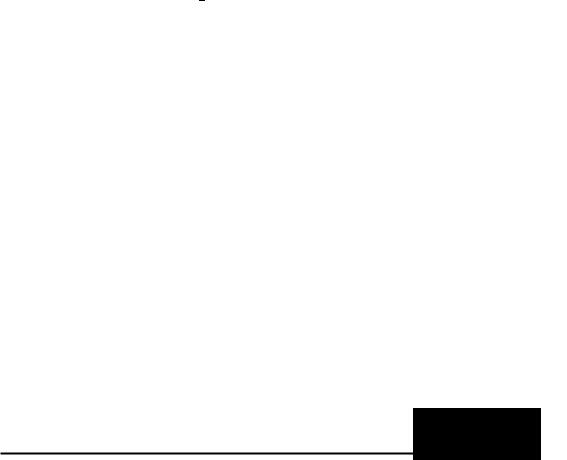
The purchasing-power-parity theory helps explain the behavior of a currency's exchange value. According to this theory, changes in relative national price levels determine changes in exchange rates over the long run. A currency would be expected to depreciate by an amount equal to the excess of domestic inflation over foreign inflation; it would appreciate by an amount equal to the excess of foreign inflation over domestic inflation.
The figure shows the relationship between inflation and the exchange rate for selected countries. The horizontal axis shows the country's
average inflation minus the U.S. average inflation during the196(}"'1997period. The vertical axis shows the average percentage change in a country's exchange rate(foreign currency per dollar) over that period. Consistent with the predictions of the purchasing-power-parity theory, the figure shows that countries with relatively low inflation rates tend to have appreciating currencies, and countries with relatively high inflation tend to have depreciating currencies.
Source: International Monetary Fund, IMF Financial Statistia, various
issues.
Relative Purchasing
Power Parity
Rather than focusing on a particular good when applying the purchasing-power-parity concept, most analysts look at market baskets consisting of many
goods. They consider a nation's overall inflation (deflation) rate as measured by, say, the producer price index or consumer price index.
According to the theory of relative purchasing power parity, changes in relative national price levels determine changes in exchange rates over the
380 |
Exchange-Rate Determination |
|
|
|
||||||||
|
long run. The theory predicts that the foreign- |
|||||||||||
|
exchange value of a currency tends to appreciate or |
|||||||||||
|
depreciate at a rate equal to the difference between |
|||||||||||
|
foreign and domestic inflation. As an example, if |
|||||||||||
|
U.S. inflation exceeds Switzerland's inflation |
by 4 |
||||||||||
|
percentage points per year, the purchasing power of |
|||||||||||
|
the dollar falls 4 points relative to the franc. The |
|||||||||||
|
foreign-exchange value of the dollar should there- |
|||||||||||
|
fore depreciate 4 percent per year. Conversely, the |
|||||||||||
|
U.S. dollar should appreciate against the franc if |
|||||||||||
|
U.S. inflation is less than Switzerland's inflation. |
|||||||||||
|
The purchasing-power-parity theory can be |
|||||||||||
|
used to predict long-run exchange rates. We'll con- |
|||||||||||
|
sider an example using the price indexes (P) of the |
|||||||||||
|
United States and Switzerland. Letting 0 be the base |
|||||||||||
|
period and 1 represent period 1, the purchasing- |
|||||||||||
|
power-parity t |
ory is |
ive |
. symbols as) |
|
|||||||
|
|
---: |
|
S - S PU.S1 |
/ Puso |
|
|
|
||||
|
|
~ |
|
|
||||||||
|
|
|
|
|
1 - |
0 |
P, |
|
7Ps |
|
|
|
|
|
|
|
|
|
|
1 |
0 |
|
|
|
|
|
where So equals the equilibrium exchange rate |
|||||||||||
|
existing in the base period and 51 equals the esti- |
|||||||||||
|
mated target at which the actual rate should be in |
|||||||||||
|
the future. |
|
|
|
|
|
|
|
|
|
||
|
For example, let the price indexes of the |
|||||||||||
|
United States and Switzerland and the equilibri- |
|||||||||||
|
um exchange. rate be as follows: |
|
|
|
||||||||
|
'0= |
P(\~l<v{.\ |
I os~ ~( |
50 |
|
|
||||||
|
100 |
|
|
0 |
= |
100 |
= $0.50 |
|||||
|
Pus |
|
|
|
P, |
|
|
|||||
|
Pus |
= 200 |
<»: |
P, |
= 100 |
U,.lY ( tY'd- |
||||||
|
1 |
|
|
1 |
|
|
|
|
e..-,r. |
|
||
|
|
|
f'''' Le:, l 'neG x |
|
|
|
|
|
||||
|
|
|
|
|
vtnV" |
|
|
. , |
f h |
hasi |
||
|
'This chapter presents fhe so-called relative version ate pure |
asmg- |
||||||||||
|
power-parity theory, which addresses changes in prices and |
|||||||||||
|
exchange rates over a period of time. Another variant is the absolute |
|||||||||||
|
version, which states that |
the equilibrium exchange rate will equal |
||||||||||
|
the ratio of domestic to foreign prices of an appropriate market bas- |
|||||||||||
|
ket of goods and services at a given point in time. |
|
|
|||||||||
Putting these figures into the previous equation, we can determine the new equilibrium exchange rate for period 1:
5 =$050 (200/100) =$0.50(2) =$1.00 1 • 100/100
Between one period and the next, the U.S. inflation rate rose 100 percent, whereas Switzerland's inflation rate remained unchanged. Maintaining purchasing power parity between the dollar and the franc requires the dollar to depreciate against the franc by an amount equal to the difference in the percentage rates of inflation in the United States and Switzerland. The dollar must depreciate by 100 percent, from $0.50 per franc to $1 per franc, to maintain its purchasing power parity. If the example assumed instead that Switzerland'sinflation rate doubled while the U.S. inflation rate remained unchanged, the dollar would appreciate to a level of $0.25 per franc, according to the purchasing-power- parity theory.
An application of the purchasing-power-parity concept is provided in Table 12.4, which gives the dollar/peso exchange rate over the period 1985-1989, during which time Mexico experienced rampant inflation. From 1985 to 1989, U.S. prices rose by about 15 percent, whereas Mexico's prices skyrocketed more than 1,100 percent. Applying the purchasing-power-parity formula to these figures, we would forecast the dollar to appreciate against the peso, from $0.0039 per peso to $0.0004 per peso, owing to the relative decline in the peso's domestic purchasing power. In fact, the dollar did appreciate to $0.0004 per peso.
"t=-pur:~aSing |
Power Parity in Action, 1985-1989 ,s, z: |
,003'1 (I, ,;,,'0/ ,;;) ('~0004 |
|
||
Year |
u.s, Consumer |
Mexican Consumer |
Actual Exchange Rate: |
Forecasted Exchange |
\ |
Price Index |
Price Index |
Dollars/Peso |
Rate: Dollars/Peso |
_) |
|
1985 |
100.0 |
100,0 |
0.0039 |
|
(j |
1987 |
105.7 |
431.7 |
0,0007 |
|
|
1989 |
115.2 |
1,109.6 |
0.0004 |
|
|
Source: International Monetary Fund, [MFFinancial Statistics, Washington, DC, May 1990.

|
|
|
Chapter 12 |
381 |
Although the purchasing-power-parity theory |
is less than the 99 percent increase forecasted by |
|
||
can be helpful in forecasting appropriate levels to |
the theory. Moreover, the figure shows that the |
|
||
which currency values should be adjusted, it is not |
purchasing-power-parity theory has negligible |
|
||
an infallible guide to exchange-rate determination. |
predictive power in the short run. From 1985 to |
|
||
For instance, the theory overlooks the fact that |
1988, for example, the British price level |
|
||
exchange-rate movements may be influenced by |
increased relative to the u.S. price level. Rather |
|
||
investmentflows. The theory also facesthe problems |
than depreciating, as the purchasing-power-parity |
|
||
of choosing the appropriate price index to be used in |
theory would predict, the pound actually appreci- |
|
||
price calculations (for example, consumer prices or |
ated against the dollar. Simply put, the purchasing- |
|
||
producer prices) and of determining the equilibrium |
power-parity theory is most appropriate for |
|
||
period to use as a base. Moreover, government poli- |
forecasting exchange rates in the long run; in the |
|
||
cy may interfere with the operation of the theory by |
short run, it is a poor forecaster. |
|
||
implementing trade restrictions that disrupt the flow |
|
|
|
|
of exports and imports among nations. |
|
Determining Short-Run |
|
|
|
|
|||
The predictive power of the purchasing- |
|
|
||
|
Exchange Rates: The Asset- |
|
||
power-parity theory is most evident in the long |
|
|
||
run. From 1973 to 2003, the British price level |
|
Market Approach |
|
|
increased about 99 percent relative to the u.s. |
|
|
|
|
|
We have seen that exchange-rate fluctuations in the |
|
||
price level, as seen in Figure 12.3. As the purchas- |
|
|||
ing-power-parity theory would forecast, the |
long run stem from volatility in market fundamen- |
|
||
pound depreciated against the dollar by about 73 |
tals including relative price levels (purchasing power |
|
||
percent during this period, although this amount |
parity), relative productivity levels, preferences for |
|
||
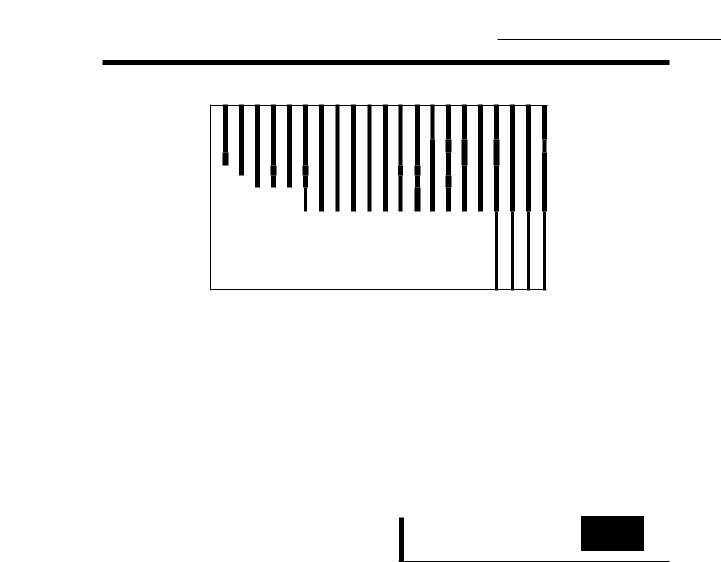
FIGURE 12.3
Purchasing Power Parity: United States-United Kingdom, 1973-2003
:,'j 250
|
|
<J |
|
|
|
|
|
|
c |
|
Relative Price Levels |
|
|
|
|
|
|
|
|
|
|
|
|
|
|
(U.K. Inflation Rate/U.S. |
|
Pound |
|
|
|
Inflation Rate) |
|
|
200 |
|
|
( |
|
||
Depreciation |
|
|
|
|||
|
|
|
|
|
||
|
|
150 |
|
|
|
|
|
|
|
|
|
|
|
Pound |
|
|
|
( |
|
|
Appreciation |
|
|
|
|
||
|
|
|
|
|
||
|
|
100 |
|
|
Exchange Rate |
|
|
|
|
|
|
(Pound/Dollar) |
|
|
|
|
|
|
|
|
|
|
1973 |
1983 |
1993 |
2003 |
|
The figure suggeststhat the predictive power of the purchasing-power-parity theory is most evident in the long run. In the short run, the theory has negligible predictive power.
Source: Economic Reportof the President and National Statistics Online at http://www.statistics.gov.uk.

382 Exchange-Rate Determination
domestic or foreign goods, and trade barriers. Fluctuations in exchange rates, however, are sometimes too large and too sudden to be explained solely by such factors. For example, exchange rates can change by 2 percentage points or more in a single day. But variations in the determinants usually do not occur frequently or significantlyenough to fully account for such exchange-rate irascibility, Therefore, to understand why exchange rates can fluctuate sharply in a particular day or week, we must consider other factors besides relative pricelevel behavior, productivity trends, preferences, and trade barriers. We need to develop a framework that can demonstrate why exchange rates fluctuate in the short run.
To understand short-run exchange-rate behavior, it is important to recognize that foreignexchange market activity is dominated by investors in assets such as Treasury securities, corporate bonds, bank accounts, stocks, and real property. Today, only about 2 percent of all foreign-exchange transactions are related to the financing of exports and imports. This suggests that most foreignexchange transactions are attributable to assets being traded in global markets. Because these markets are connected by sophisticated telecommunication systems and trading occurs on a 24-hour basis, investors in financial assets can trade rapidly
TABLE 12.1
and modify their outlooks of currency values almost instantaneously. Simply put, over short periods such as a month, decisions to hold domestic or foreign assets playa much greater role in exchangerate determination than the demand for imports and exports does.
According to the asset-market approach, investors consider two key factors when deciding between domestic and foreign investments: relative levels of interest rates and expected changes in the exchange rate itself over the term of the investment. These factors, in turn, account for fluctuations in exchange rates that we observe in the short run. Table 12.5 summarizes the effects of these factors.
Relative Levels of
Interest Rates
The level of nominal (money) interest rate is a first approximation of the rate of return on assets that can be earned in a particular country. Thus, differences in the level of nominal interest rates between economies are likely to affect international investment flows, as investors seek the highest rate of return.
When interest rates in the United States are significantly higher than interest rates abroad, the foreign demand for U.S. securities and bank accounts will increase, which increases the
Determinants of the Dollar'sExchange Rate Against the Pound in the Short Run
|
|
Repositioning of International |
|
|
Effect on Dollar's |
|
Change in Determinant' |
Financial Investment |
|
|
Exchange Rate |
|
U.S. Interest Rate |
|
|
|
|
|
Increase |
Toward dollar-denominated assets |
|
Appreciates |
|
|
Decrease |
Toward pound-denominated assets |
|
Depreciates |
|
|
British Interest Rate |
|
|
|
|
|
Increase |
Toward pound-denominated assets |
|
Depreciates |
|
|
Decrease |
Toward dollar-denominated assets |
|
Appreciates |
|
|
Expected Future Change in |
|
|
|
|
the Dollar'sExchange Rate |
|
|
|
|
|
|
Appreciate |
Toward dollar-denominated assets |
Appreciates |
||
|
Depreciate |
Toward pound-denominated assets |
|
Depreciates |
|
1111111111 |
211111111 I 1'111 I II1I |
I IU 1II1 I I |
1111 |
21111 I111 I Ii 111111' |
|
*The analysis for a change in one determinant assumes that the other determinants are unchanged.

demand for the dollars needed to buy those assets, thus causing the dollar to appreciate relative to foreign currencies. In contrast, if interest rates in the United States are on average lower than interest rates abroad, the demand for foreign securities and bank accounts strengthens and the demand for U.S. securities and bank accounts weakens. This will cause the demand for foreign currencies needed to buy foreign assets to increase and the demand for the dollar to decrease, resulting in a depreciation of the dollar relative to foreign currencies.
To illustrate the effects of relative interest rates as a determinant of exchange rates, refer to Figure 12.4. It shows the demand and supply schedules of pounds. Initially, the equilibrium exchange rate is $1.50 per pound. Referring to Figure 12.4(a), assume that an expansionary monetary policy of the U.S. Federal Reserve results in a fall in interest rates to 3 percent, while interest rates in the United Kingdom are at 6 percent. U.S. investors will be attracted to the relatively high interest rates in the United Kingdom and will demand more pounds to buy British treasury bills. The demand for pounds
Chapter 12 |
383 |
thus rises to D 1 in the figure. Concurrently, the British will find investing in the United States less attractive than before, so fewer pounds will be offered to buy dollars for purchases of U.S. securities. The supply of pounds thus decreases to 51 in the figure. The combined effect of these two shifts is to cause the dollar to depreciate to $1.60 per pound. Alternatively, if interest rates were lower in the United Kingdom than in the United States, the dollar would appreciate against the pound as Americans made fewer investments in the United Kingdom and the British made more investments in the United States.
Things may not always be so simple, though, concerning the relationship between interest rates, investment flows, and exchange rates. It is important to distinguish between the nominal interest rate and the real interest rate (the nominal interest rate minus the inflation rate).
Real interest rate = Nominal interest rate -
Inflation rate
For international investors, it is relative changes in the real interest rate that matter.
FIGURE 12.4
Factors Affecting the Dollar'sExchange Rate in the Short Run
(a) |
Relative Interest Rates |
(b) |
Expected Change in |
|
-u |
5, |
-u |
the Exchange Rate |
|
c |
|
c |
|
|
:> |
|
:> |
|
|
o |
|
o |
|
|
ca, |
|
c, |
|
|
~ 1,60 |
|
Q; |
|
|
|
Q. |
|
|
|
|
|
|
|
5, |
1.50 |
|
1.50 |
|
|
|
|
t |
|
|
|
D, |
1.45 |
|
|
|
|
|
|
|
oL ----- ' ------- _ |
|
6 |
7 |
|
|
6 |
|
||
|
Millions of Pounds |
|
Millions of Pounds |
|
In the short run, the exchange rate between the doUqr and the pound reflects interest rates and expected changes in the exchange rate.

384 |
Exchange-Rate Determination |
|
|
|
|
|
|
------------~------------ |
|
|
|
||
|
_____________IIIIIlIII |
__ |
|
|||
|
EIEEE II _ II |
HI Elllllilll |
I |
|
||
|
Interest-Rate Differentials and Exchange Rates |
|
|
|
|
|
|
Trade-Weighted Value |
|
U~S~ Real Interest Rate Minus |
|||
|
of the U.S. Dollar |
|
Foreign Real Interest Rate |
|||
|
160 |
|
|
|
16 |
|
|
|
|
|
|||
|
|
|
|
|
12 |
|
|
140 |
|
|
|
|
|
|
|
|
|
|
8 |
-0 |
|
|
|
|
|
|
ro |
|
x |
|
|
|
|
n |
|
~ 120 |
|
|
|
|
ro |
|
|
|
|
|
::> |
|
|
.E |
|
|
|
4 |
o |
|
|
|
|
|
co |
|
|
|
|
|
|
|
ro |
|
100 |
Exchange Rate |
|
|
o |
|
|
|
(left Scale) |
|
|
|
|
|
|
|
|
|
|
|
|
|
|
|
|||
|
__l--_--'------_----L-_---'----_-----"-_-------.JL--_I4_ |
|||||
1980 |
1981 |
1982 |
1983 |
III1!lEElIlilEE
The theory of flexible exchange rates helps explain the behavior of the dollar in the 1980s. When real interest rates in the United States are increasing relative to real interest rates overseas, the U.s. dollar should appreciate as investors seek to locate their funds in the United States.
The figure shows the real-interest-rate differential between the United States and other industrial nations in the 1980s. Over the period 1980-1984, the real interest rate rose in the
1984 |
1985 |
1986 |
United States relative to the other nations. This attracted investment funds into the United States and promoted a steady appreciation in the dollar's valueuntil early 1985. Subsequently, the dollar's exchange value decreased sharply as the real-interest-rate differential moved lower.
Source: Craig Hakkio, 'Interest Rates and Exchange Rates: What Is the Relationship?" Economic Review. Federal Reserve Bank of Kansas City, November 1986.
If a rise in the nominal interest rate in the United States is accompanied by an equal rise in the U.S. inflation rate, the real interest rate remains constant. In this case, higher nominal interest rates do not make dollar-denominated securities more attractive to British investors. This is because rising U.S. inflation will encourage U.S. buyers to seek out low-priced British goods, which will increase the demand for pounds and cause the dollar to depreciate. British investors will expect the
exchange rate of the dollar, in terms of the pound, to depreciate along with the declining purchasing power of the dollar. The higher nominal return on U.S. securities will thus be offset by the expectation of a lower future exchange rate, leaving the motivation for increased British investment in the United States unaffected. Only if higher nominal interest rates in the United States signal an increase in the real interest rate will the dollar appreciate; if they signal rising inflationary expectations and a

falling real interest rate, the dollar will depreciate. Table 12.6 provides examples of short-term real interest rates for various nations.
In summary, we expect to see appreciating currencies in countries whose real interest rates are higher than abroad because these countries will attract investment funds from all over the world. Countries that experience relatively low real interest rates tend to find their currencies depreciating.
Expected Change in
the Exchange Rate
Yet differences in interest rates may not be all an investor needs to know to guide her decision. One must also consider that the return actually realized from an investment is paid out over some future period. This means that the realized value of that future payment can be altered by changes in the exchange rate itself over the term of the investment. Simply put, investors must think about possible gains or losses on foreign currency transactions in addition to interest rates on assets.
Expectations about the future path of the exchange rate itself will figure prominently in the investor's calculation of what she will actually earn from an investment denominated in another
Short-Term Nominal and Real Interest Rates, 2002
Chapter 12 |
385 |
currency. Even a high interest rate would not be attractive if one expects the denominating currency to depreciate at a similar or greater rate and erase all economic gain. Conversely, if the denominating currency is expected to appreciate, the realized gain would be greater than what the interest rate alone would suggest, and the asset appears more lucrative.
Figure 12.4(b) illustrates the effects of investor expectations of changes in exchange rates over the term of an investment. Assume that the equilibrium exchange rate is initially $1.50 per pound. Suppose that British investors expect that in 3 months the exchange value of the dollar will appreciate against the pound. Thus, by investing in 3-month U.S. Treasury bills, British investors can anticipate a foreign currency gain: initially selling pounds for dollars when dollars are relatively cheap, and, in 3 months, purchasing pounds with dollars when pounds are relatively cheap. The expectation of foreign currency gain will make U.S. Treasury bills seem more attractive, and the British will purchase more of them. In the figure, the supply of pounds in the foreignexchange market will shift rightward from So to S1 and the dollar appreciates to $1.45 per pound,
Country |
Nominal Interest Rate' |
Inflation Rate" |
Real Interest Rate |
Canada |
2.6 |
2.0 |
0.6 |
France |
3.0 |
1.9 |
1.1 |
Germany |
3.3 |
1.0 |
2.3 |
Japan |
0.1 |
1.0 |
-0.9 |
Netherlands |
2.8 |
3.5 |
-0.7 |
New Zealand |
5.5 |
2.6 |
2.9 |
South Korea |
4.2 |
2.7 |
1.5 |
Mexico |
7.1 |
5.1 |
2.0 |
United States |
1.6 |
1.0 |
0.6 |
United Kingdom |
3.9 |
1.6 |
2.3 |
! '11 !
*Rates are for 3-momh treasury bills.
**Measured by the consumer price index.
Source: International Financial Statistics, January 2004.

386 Exchange-Rate Determination
In this way, future expectations of an appreciation of the dollar can be self-fulfilling.
Given the importance of expectations in decision making and the speed with which many investment transactions can occur, exchange rates can be volatile. Predicting the magnitude and duration of short-run exchange-rate movements with precision is a very elusive goal.
Diversification, Safe Havens,
and Investment Flows
Although relative levels of interest rates between countries and expected changes in exchange rates tend to be strong forces directing investment flows among economies, other factors can also affect these flows. For example, the size of the stock of assets denominated in a particular currency in investor portfolios can induce a change in investor preferences. Why? Investors know that it is prudent to have an appropriate degree of diversification across asset types, including the currencies in which they are denominated. Thus, even though dollardenominated Treasury securities may provide a high relative return, if the accumulation has been large, at some point foreign investors, considering both risk and reward, will decide that their portfolio's share of u.s. securities is large enough. To improve the diversity of their portfolios, investors will slow or halt their purchases of u.s. securities.
There is also likelyto be a significantsafe-haven effect behind some investment flows. Some investors may be willing to sacrifice a significant amount of return if an economy offers them an especially low-risk repository for their funds. In recent decades, the United States, with a long history of stable government, steady economic growth, and large and efficient financial markets, can be expected to draw foreign investment for this reason.
The Ups and Downs of the
Dollar: 1980 to 2004
Let us now apply the determinants of exchange rates to the path of the U.S. dollar since the 1980s. During this period, the dollar has experienced sustained appreciations and depreciations several
times, but for different reasons. Let us examine the forces causing the ups and downs of the dollar.
The 1980s
During the 1980s, the dollar's exchange value followed a path of appreciation followed by depreciation. The dollar actually began its ascent in 1979 in response to a sharp tightening of monetary policy, which pushed up domestic interest rates. The Federal Reserve's objective at this time was not dollar appreciation, but to reign in doubledigit inflation, which plagued the economy. Nevertheless, as investors became convinced of the Federal Reserve's determination in fighting inflation and the likely dual prospect of steadily increasing interest rates and decelerating inflation, the United States became an attractive destination for foreign investment. Also, the Reagan Administration enacted sizable tax cuts along with increased government spending, which resulted in large federal budget deficits. That federal borrowing increased the demand for a shrinking pool of domestic saving and added to the upward pressure on interest rates. Investment flowed into the United States and the dollar climbed higher. The dollar peaked in 1985, about 50 percent above its level in 1979.
The latter half of the 1980s witnessed a depreciation of the dollar of similar magnitude. What caused the change? One factor was a turn in the speculative belief that the dollar would continue to appreciate. At this point, a large number of investors apparently felt that the dollar was far above a sustainable level and now was more likely to depreciate than appreciate. These investor expectations were reinforced by sizable currency interventions by the United States and other major economies aimed at weakening an overvalued dollar. Investors thus developed expectations that the government wanted the dollar to depreciate and that changes in macroeconomic policy would support that desire. The Federal Reserve enacted an expansionary monetary policy that forced interest rates down. Fiscal policy began to reduce the size of budget deficits, which also fostered lower interest rates. Both factors contributed to investment outflows and a weakening dollar.
On balance, the 1980s illustrated that fluctuations in the dollar's exchange value were not haphazard, but were broadly predictable responses to changes in economic fundamentals that influence the expected rate of return on dollar-denominated assets. Also, those fluctuations were significantly caused by changes in macroeconomic policy, including monetary policy and fiscal policy.
The 1990s
The 1990s began in economic weakness for the United States. The pace of economic growth slowed sharply and the economy fell into recession in 1991. In response to the weakening economy, monetary policy turned to a more expansionary stance, and the federal budget deficit grew as fiscal policy increased government spending and dampened tax receipts. Interest rates in the United States fell. In contrast, economic activity abroad was moving relatively briskly. In this environment, the demand for dollar-denominated assets declined, and the dollar depreciated about 15 percent on average against the currencies of its major trading partners.
By the mid-1990s, however, the U.S. economy was growing rapidly. What underlaid the acceleration of growth was a sharp increase in the pace of investment spending by business and a market acceleration in productivity growth. The combination of strong consumer demand, deregulation, trade liberalization, and a rush to include computers in the production process propelled investment spending up at a record pace. But even with the federal budget's move toward surplus, the flow of domestic saving could not keep pace with investment, and interest rates edged up. Also, the United States witnessed a declining rate of inflation, while the economies of other nations such as Japan and Europe were sluggish. These factors resulted in the United States becoming an attractive destination for foreign investors. An increase in the foreign demand for dollar-denominated assets pushed the dollar steadily higher, rising over 30 percent on average against the currencies of its trading partners from 1995 through 2001.
This time, the dollar's sharp appreciation was propelled by the private sector. Economic policy moved in conflicting directions, probably making
Chapter 12 |
387 |
its net impact on the dollar a minor one. The government's move toward budget surpluses certainly added to national saving and less-
ened the dollar's appreciation. However, the Federal Reserve implemented a steadily more contractionary monetary policy that
increased interest rates; this may have added to the dollar's upward momentum. But the Federal Reserve was not the main force behind the appreciation of the dollar.
The 2000s
A rising dollar and the large flow of investment into the United States that pushes the currency higher could not be sustained. Borrowers and lenders alike tend to find sound reasons to reduce the size of the investment inflow. For lenders, rising risk and the imperative of adequate portfolio diversification can prompt a diminished willingness to acquire dollar-denominated assets. For the borrower, a rising burden of debt service may reduce the desire to borrow.
The depreciation of the dollar in 2002 and 2003 reflected a weakening of the demand for dol- lar-denominated assets on the part of foreign investors. Recession in the United States in 2001, a declining stock market, uncertainty about corporate accounting practices, and a steady decline in interest rates to levels not seen in over 30 years (and decreasing significantly more than foreign interest rates) all pointed to a likely deterioration of the attractiveness of the investment climate in the United States. Add to this the inevitable elevation of uncertainty due to the ongoing war on terrorism and the war with Iraq, and a depreciation of the dollar was not surprising.
Although the dollar continued to weaken into 2004, analysts generally felt that a crash of the dollar was not likely. This conclusion was reinforced by the fact that there seemed to be a shortage of better investment alternatives around the world. Most other major economies had lower growth rates than the United States. Also, the prospect of a series of large U.S. budget deficits in a growing economy suggested that interest rates in the United States would likely rise. Finally,
388 Exchange-Rate Determination
U.S. Current Account Balance and Exchange Rate
140 |
|
|
|
|
|
|
o |
135 |
|
|
|
/ |
1\ |
|
-1 |
|
|
|
|
r-. .... |
|
|
|
130 |
|
|
r-- |
/ |
~ |
|
-2 |
|
|
|
|
||||
|
|
|
|
|
|
|
|
|
|
|
/ |
|
|
~ |
|
125 |
|
|
|
|
\ |
-3 |
|
|
|
|
|
|
|||
|
|
|
|
|
|
|
|
120 |
|
|
V |
|
|
|
-4 |
115 |
|
|
|
|
|
|
-5 |
110 |
|
2000 |
|
2002 |
|
2003 |
-6 |
1998 |
1999 |
2001 |
|
|
IIIIIIIIiIIIIII |
Current account balance os 0 percent of GDP (right scale) |
-- |
Real effective exchange rate (index, 1995 = 100) |
|
|
|
|
The United States has run current account deficits since the early 19805. But only in the last couple of years have these deficits assumed extraordinary proportions. By 2003, the U.S. current account deficit was about 5 percent of GOP.
Recall from Chapter 10 that a country with a current account deficit has more imports of goods and services than exports and net receipts of transfers from abroad. Any current account deficit must be matched by a financial and capital
---------~----------- |
~------------------- |
about three-fourths of foreign investment in the United states is long-term investment, including direct investment in plant and equipment, bonds, and stocks. These investments tend to be more stable than short-term investment flows because they are based on long-run return and are thus less sensitive to adverse short-term changes in economic conditions. However, predicting the path of the dollar is very difficult. Speculative forces can exert strong short-term effects that may not be tied to more predictable underlying fundamentals. It remains to be seen where the dollar will go in the years ahead.
Exchange-Rate
Overshooting
Changes in expected future values of market fundamentals contribute to exchange-rate volatility in the short run. For example, announcements by the Federal Reserve of changes in monetarygrowth targets or by the president and Congress of changes in tax or spending programs cause changes in expectations of future exchange rates that can lead to immediate changes in equilibrium exchange rates. In this manner, frequent changes in policy contribute to volatile exchange rates in a system of market-determined exchange rates.