1 семестр_1 / МА / МП-12_Николаев_Олег_БДЗ1
.docxОтчет к заданию 1
-
Вычислить

 .
Сделать графическую иллюстрацию.
.
Сделать графическую иллюстрацию.
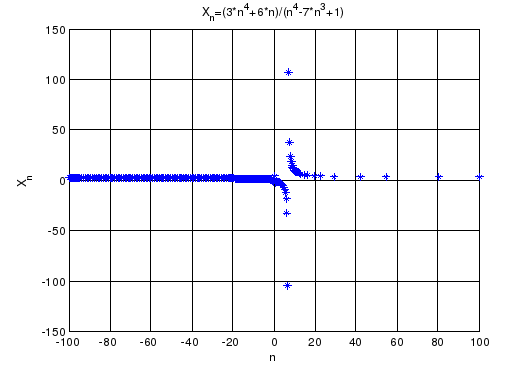
syms n;
limit('(3*n^4+6*n)/(n^4-7*n^3+1)',n,Inf)
ans =
3
maple('solve','{abs((3*n^4+6*n)/(n^4-7*n^3+1)-3)<0.01,n>=1}',n)
ans =
{2107.0001351197110114085069714503 < n}
maple('solve','{abs((3*n^4+6*n)/(n^4-7*n^3+1)-3)<0.001,n>=1}',n)
ans =
{21007.000013596052674371858903692 < n}
grid on;hold on;
xlabel('n'),ylabel('X_{n}');
fplot('(3*n^4+6*n)/(n^4-7*n^3+1)',[-100 100],'*');
title('X_{n}=(3*n^4+6*n)/(n^4-7*n^3+1)');
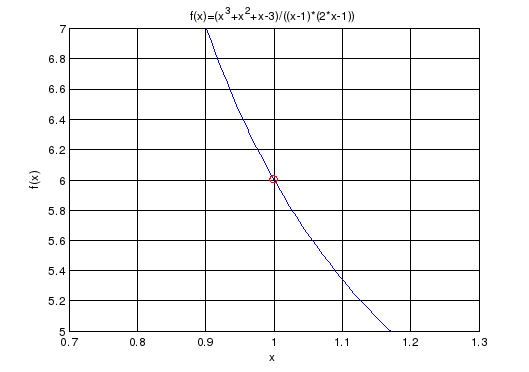
Отчет к заданию 2
2-5, 8,9. Построить
график функций в окрестности точки
 отметить значение предела.
syms x;
limit('(x^3+x^2+x-3)/((x-1)*(2*x-1))',x,1)
ans =
6
grid on;hold on;
xlabel('x'),ylabel('f(x)');
title('f(x)=(x^3+x^2+x-3)/((x-1)*(2*x-1))');
fplot('(x^3+x^2+x-3)/((x-1)*(2*x-1))',[0.7 1.3 5 7]);
plot(1,6,'or');
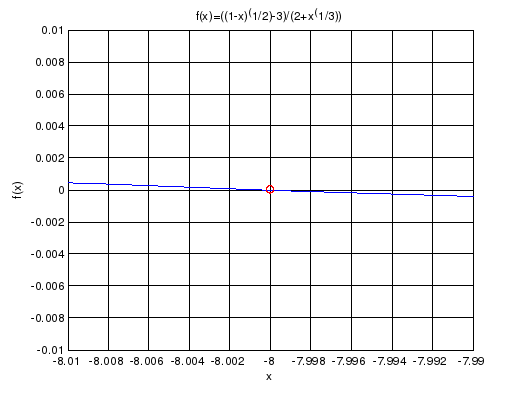
Отчет к заданию 3
syms x;
limit('((1-x)^(1/2)-3)/(2+x^(1/3))',x,-8)
ans =
0
grid on;hold on;
xlabel('x'),ylabel('f(x)');
title('f(x)=((1-x)^(1/2)-3)/(2+x^(1/3))');
fplot('((1-x)^(1/2)-3)/(2+x^(1/3))',[-8.01 -7.99 -0.01 0.01]);
plot(-8,0,'or');
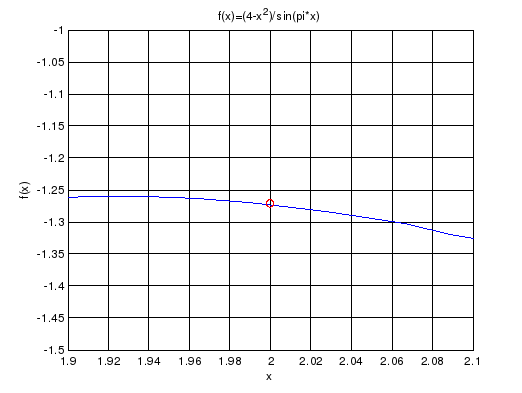
Отчет к заданию 4
syms x;
limit('(4-x^2)/sin(pi*x)',x,2)
ans =
-4/pi
grid on;hold on;
fplot('(4-x^2)/sin(pi*x)',[1.9 2.1 -1 -1.5]);
plot(2,-4/pi,'or');
title('f(x)=(4-x^2)/sin(pi*x)');
xlabel('x'),ylabel('f(x)');
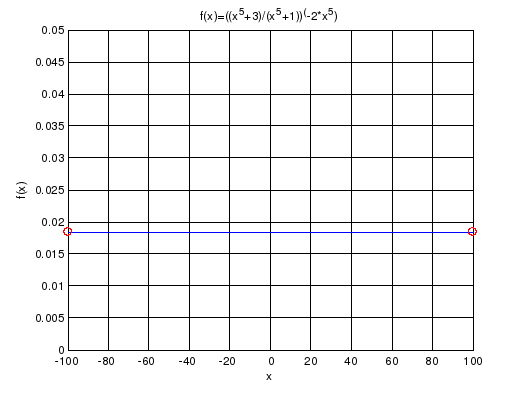
Отчет к заданию 5
syms x;
limit('((x^5+3)/(x^5+1))^(-2*x^5)',x,Inf)
ans =
exp(-4)
grid on;hold on;
fplot('((x^5+3)/(x^5+1))^(-2*x^5)',[-100 100 0 0.05]);
plot(-100,exp(-4),'or');
plot(100,exp(-4),'or');
title('f(x)=((x^5+3)/(x^5+1))^(-2*x^5)');
xlabel('x'),ylabel('f(x)');
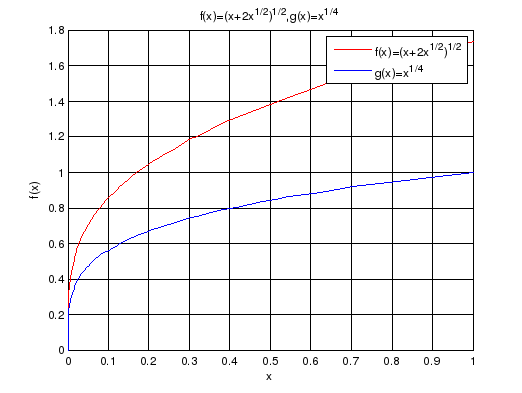
Отчет к заданию 6
6-7. В одной системе
координат построить в окрестности точки
 графики исходной функции и
 где
где
 - порядок малости.
syms x;
grid on;hold on;
fplot('sqrt(x+2*sqrt(x))',[0 1],’r’);
fplot('x^(1/4)',[0 1]);
legend('f(x)=(x+2x^{1/2})^{1/2}','g(x)=x^{1/4}');
title('f(x)=(x+2x^{1/2})^{1/2},g(x)=x^{1/4}');
xlabel('x'),ylabel('f(x)');
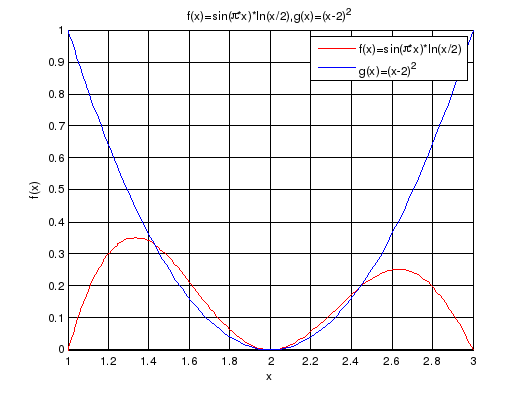
Отчет к заданию 7
syms x;
grid on;hold on;
fplot('sin(pi*x)*log(x/2)',[1 3],'r');
fplot('(x-2)^(2)',[1 3]);
legend('f(x)=sin(\pi*x)*ln(x/2)','g(x)=(x-2)^2');
title('f(x)=sin(\pi*x)*ln(x/2),g(x)=(x-2)^2');
xlabel('x'),ylabel('f(x)');
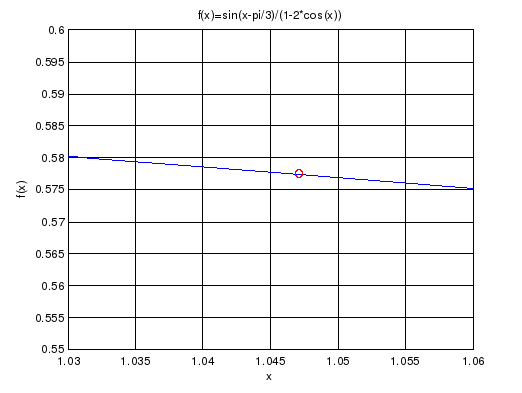
Отчет к заданию 8
syms x;
limit('sin(x-pi/3)/(1-2*cos(x))',x,pi/3)
ans =
1/3*3^(1/2)
grid on;hold on;
fplot('sin(x-pi/3)/(1-2*cos(x))',[1.03 1.06 0.55 0.6]);
plot(pi/3,1/sqrt(3),'or');
title('f(x)=sin(x-pi/3)/(1-2*cos(x))');
xlabel('x'),ylabel('f(x)');
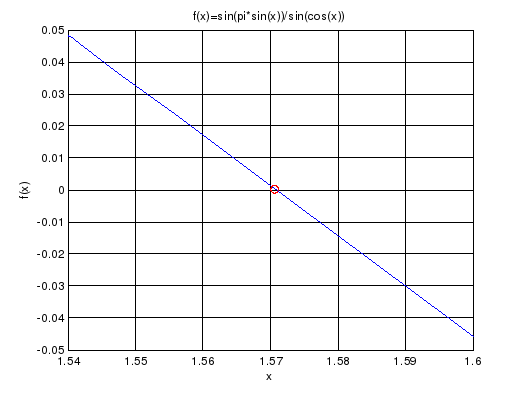
Отчет к заданию 9
syms x;
limit('sin(pi*sin(x))/sin(cos(x))',x,pi/2)
ans =
0
grid on;hold on;
fplot('sin(pi*sin(x))/sin(cos(x))',[1.54 1.6]);
plot(pi/2,0,'or');
title('f(x)=sin(pi*sin(x))/sin(cos(x))');
xlabel('x'),ylabel('f(x)');
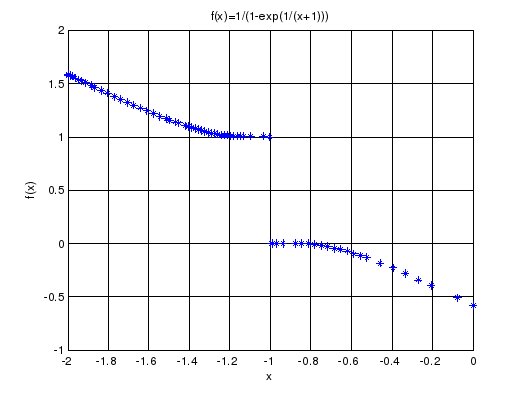
Отчет к заданию 10
10. Построить график функции в окрестности точки разрыва
syms x;
grid on;hold on;
fplot('1/(1-exp(1/(x+1)))',[-2 0],'*');
title('f(x)=1/(1-exp(1/(x+1)))');
xlabel('x'),ylabel('f(x)');