1 семестр / Математический Анализ / Кучеренко 3_0
.docx
>> z1=2+3i
z1 =
2.0000 + 3.0000i
Упражнение 1
>> format rational
1)
>> z1=2+3i;
>> z2=3-I;
>> z3=z1*z2;
2)
>> z1=1-I;
>> z2=1+I;
>> z3=z1^3-z2^3
z3 =
0 - 4i
3)
>> k=1:1:8;
>> i.^k
ans =
Columns 1 through 3
0 + 1i -1 0 - 1i
Columns 4 through 6
1 0 + 1i -1
Columns 7 through 8
0 - 1i 1
4)
>> z1=2-3i;
>> z2=1+4i;
>> z3=4-I;
>> z4=z1/z2+1/z3
z4 =
-6/17 - 10/17i
Упражнение 2
>> z1=1-i*sqrt(3);
>> z2=sqrt(3)+I;
>> z3=z1*conj(z2)
z3 =
0 - 4i
>> z4=(conj(z2)/z1)^2
z4 =
1/2 + 1170/1351i
Упражнение 3
1)
>> z1=4-5i;
>> z2=5+6i;
>> z3=z1*z2
z3 =
50 - 1i
>> conj(z3)
ans =
50 + 1i
>> real(z3)
ans =
50
>> imag(z3)
ans =
-1
>> abs(z3)
ans =
5001/100
>> angle(z3)
ans =
-150/7501
2)
>> z1=1+i;
>> z2=z1^15
z2 =
128 - 128i
>> conj(z2)
ans =
128 + 128i
>> real(z2)
ans =
128
>> imag(z2)
ans =
-128
>> abs(z2)
ans =
9413/52
>> angle(z2)
ans =
-355/452
ПРИМЕР
>> z=2+3i;
>> plot(real(z),imag(z),'go')
>> axis([-4 4 -4 4])
>> line([-4 4],[0 0],'Color','black')
>> line([0 0],[-4 4],'Color','black')
>> grid on
>> xlabel('Re(z)'),ylabel('Im(z)')
>> hold on
>> z=3-2i;
>> line([0 real(z)],[0 imag(z)],'Color','r')
>> plot(real(z),imag(z),'r*')
>> title('Изображение чисел на комплексной плоскости')
Упражнение 4

>> z1=1+3i;
>> z2=3+4i;
>> z3=z1+z2;
>> z4=z1-z2;
>> axis([-5 5 -5 5]);
>> line([-4 4],[0 0],'Color','black')
>> line([-5 5],[0 0],'Color','black')
>> line([0 0],[-5 5],'Color','black')
>> grid on
>> xlabel('Re(z)'),ylabel('Im(z)')
>> hold on
>> plot(real(z1),imag(z1),'g+')
>> plot(real(z2),imag(z2),'b+')
>> plot([0 1],[0 3],'g')
>> plot([0 3],[0 4],'b')
>> plot(real(z3),imag(z3),'r+')
>> z3=z1+z2;
>> plot(real(z3),imag(z3),'r+')
>> axis equal
>> z3=z1+z2;
>> axis( [-5 6 -10 10])
>> plot([0 4],[0 7],'r')
>> plot(real(z4),imag(z4),'b*')
>> plot([0-2],[0 -1],'b')
>> plot([0 -2],[0 -1],'b')
Упражнение 5

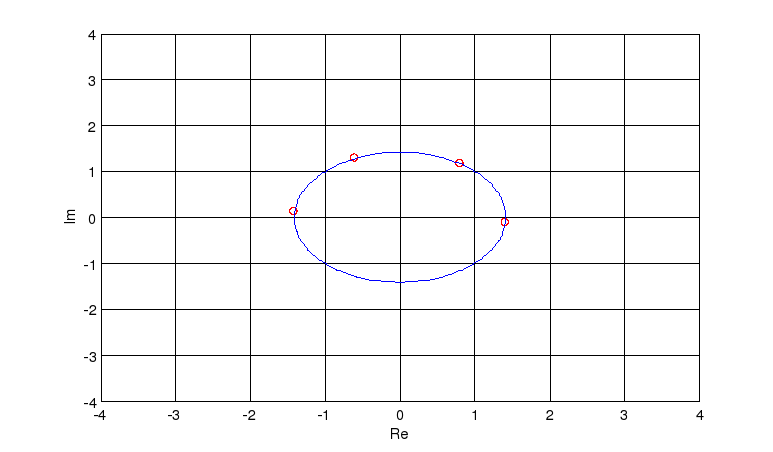
>> z=2*sqrt(3)-2i;
>> r=abs(z);phi=angle(z);
>> k=0:1:3;
>> zroot=r^(1/4)*(cos((phi+2*pi*k)/6)+i*sin((phi+2*pi*k)/6))
zroot =
1.4088 - 0.1233i 0.8112 + 1.1585i -0.5977 + 1.2817i -1.4088 + 0.1233i
>> grid on
>>line([0 0],[-4 4],'Color','black')
>> line([-4 4],[0 0],'Color','black')
>> xlabel('Re'),ylabel('Im')
>> hold on
>> plot(real(zroot),imag(zroot),'or')
>> hold on
>> t=0:pi/1000:2*pi;
>> x=r^(1/4)*cos(t);y=r^(1/4)*sin(t);
>> plot(x,y,':b')
Упражнение 6

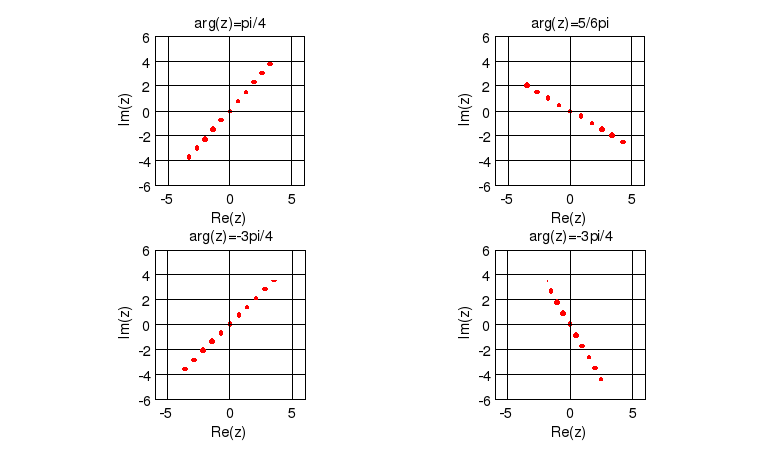
>> phi=pi/4;
>> missle
phi =
4
r =
-5 -4 -3 -2 -1 0 1 2 3 4 5
z =
Columns 1 through 4
3.2682 + 3.7840i 2.6146 + 3.0272i 1.9609 + 2.2704i 1.3073 + 1.5136i
Columns 5 through 8
0.6536 + 0.7568i 0 -0.6536 - 0.7568i -1.3073 - 1.5136i
Columns 9 through 11
-1.9609 - 2.2704i -2.6146 - 3.0272i -3.2682 - 3.7840i
>> subplot(2;2;1)
>> subplot(2,2,1)
>> phi=pi/4;
>> missle
phi =
4
r =
-5 -4 -3 -2 -1 0 1 2 3 4 5
z =
Columns 1 through 4
3.2682 + 3.7840i 2.6146 + 3.0272i 1.9609 + 2.2704i 1.3073 + 1.5136i
Columns 5 through 8
0.6536 + 0.7568i 0 -0.6536 - 0.7568i -1.3073 - 1.5136i
Columns 9 through 11
-1.9609 - 2.2704i -2.6146 - 3.0272i -3.2682 - 3.7840i
>> subplot(2,2,2)
>> subplot(2,2,1)
>> phi=pi/4
phi =
0.7854
>> pi4
phi =
4
r =
-5 -4 -3 -2 -1 0 1 2 3 4 5
z =
Columns 1 through 4
3.2682 + 3.7840i 2.6146 + 3.0272i 1.9609 + 2.2704i 1.3073 + 1.5136i
Columns 5 through 8
0.6536 + 0.7568i 0 -0.6536 - 0.7568i -1.3073 - 1.5136i
Columns 9 through 11
-1.9609 - 2.2704i -2.6146 - 3.0272i -3.2682 - 3.7840i
>> subplot(2,2,2)
>> phi=5*pi/6
phi =
2.6180
>> pi56
phi =
4
r =
-5 -4 -3 -2 -1 0 1 2 3 4 5
z =
Columns 1 through 4
3.2682 + 3.7840i 2.6146 + 3.0272i 1.9609 + 2.2704i 1.3073 + 1.5136i
Columns 5 through 8
0.6536 + 0.7568i 0 -0.6536 - 0.7568i -1.3073 - 1.5136i
Columns 9 through 11
-1.9609 - 2.2704i -2.6146 - 3.0272i -3.2682 - 3.7840i
>> const=5*pi/6
const =
2.6180
>> pi56
phi =
2.6180
r =
-5 -4 -3 -2 -1 0 1 2 3 4 5
z =
Columns 1 through 4
4.3301 - 2.5000i 3.4641 - 2.0000i 2.5981 - 1.5000i 1.7321 - 1.0000i
Columns 5 through 8
0.8660 - 0.5000i 0 -0.8660 + 0.5000i -1.7321 + 1.0000i
Columns 9 through 11
-2.5981 + 1.5000i -3.4641 + 2.0000i -4.3301 + 2.5000i
>> subplot(2,2,3)
>> const=-3*pi/4
const =
-2.3562
>> pi34
phi =
-2.3562
r =
-5 -4 -3 -2 -1 0 1 2 3 4 5
z =
Columns 1 through 4
3.5355 + 3.5355i 2.8284 + 2.8284i 2.1213 + 2.1213i 1.4142 + 1.4142i
Columns 5 through 8
0.7071 + 0.7071i 0 -0.7071 - 0.7071i -1.4142 - 1.4142i
Columns 9 through 11
-2.1213 - 2.1213i -2.8284 - 2.8284i -3.5355 - 3.5355i
>> const=-pi/3
const =
-1.0472
>> subplot(2,2,4)
>> pi3
phi =
-1.0472
r =
-5 -4 -3 -2 -1 0 1 2 3 4 5
z =
Columns 1 through 4
-2.5000 + 4.3301i -2.0000 + 3.4641i -1.5000 + 2.5981i -1.0000 + 1.7321i
Columns 5 through 8
-0.5000 + 0.8660i 0 0.5000 - 0.8660i 1.0000 - 1.7321i
Columns 9 through 11
1.5000 - 2.5981i 2.0000 - 3.4641i 2.5000 - 4.3301i
>>
phi=const
r=-5:1:5
z=r*(cos(phi)+i*sin(phi))
x=real(z);
y=imag(z);
plot(x,y,'.r')
grid on
axis equal
axis([-6 6 -6 6])
line ([-6 6],[0 0],'Color','black'),line ([0 0],[-6 6],'Color','black')
xlabel('Re(z)'),ylabel('Im(z)')
title('arg(z)=pi/4')
