1 семестр / Математический Анализ / Kr1_Кучеренко
.docxКучеренко Антон МП-18
Вариант 1
№1

>> subplot(2,2,1)
>> hold on, grid on
>> xlabel('X'),ylabel('Y')
>> title('y=x^2')
>> x=[-6:1:6];
>> y=x.^2;
>> plot(x,y,'b-')
>> subplot(2,2,2)
>> hold on, grid on
>> x1=x-2;
>> y=x1.^2;
>> plot(x,y,'b-')
>> subplot(2,2,3)
>> hold on, grid on
>> x1=abs(x)-2;
>> y=x1.^2;
>> plot(x,y,'b-')
>> subplot(2,2,4)
>> hold on, grid on
>> x1=(abs(x)-2)-3;
>> y=x1.^2;
>> plot(x,y,'b-')
>> xlabel('X'),ylabel('Y')
>> title('y=((|x|-2)-3)^2')
>> subplot(2,2,3)
>> xlabel('X'),ylabel('Y')
>> title('y=(|x|-2)^2')
>> subplot(2,2,2)
>> xlabel('X'),ylabel('Y')
>> title('y=(x-2)^2')
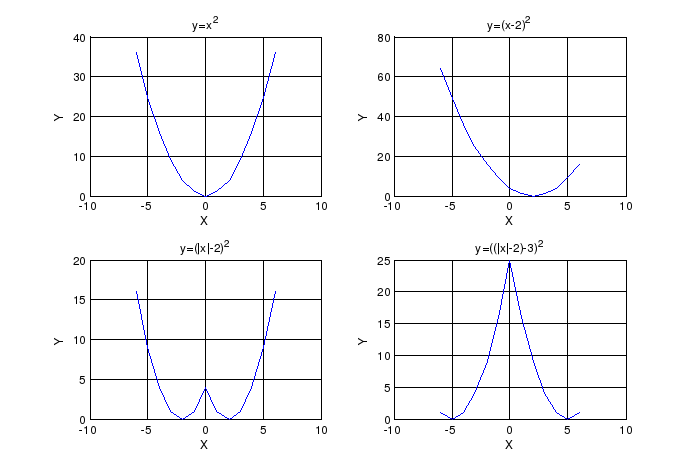
график y=x2
график y=(x-2)2 получен сдвигом графика y=x2 на 2 ед вправо
график y=(|x|-2)2 симметричен относительно оси Оу
график y=((|x|-2)-3)2 из предыдущего сдвигом на 3 ед. вправо
№2
>> k=0:1:5;
>> z=64;
>> r=abs(z);
>> phi=angle(z);
>> zroot=(r^(1/6))*(cos((phi+2*pi*k)/6)+i*sin((phi+2*pi*k)/6));
zroot =
Columns 1 through 4
2.0000 1.0000 + 1.7321i -1.0000 + 1.7321i -2.0000 + 0.0000i
Columns 5 through 6
-1.0000 - 1.7321i 1.0000 - 1.7321i
>> pi=sym('pi');
>> zroot=(r^(1/6))*(cos((phi+2*pi*k)/6)+i*sin((phi+2*pi*k)/6))
zroot =
Columns 1 through 4
2.0000 1.0000 + 1.7321i -1.0000 + 1.7321i -2.0000 + 0.0000i
Columns 5 through 6
-1.0000 - 1.7321i 1.0000 - 1.7321i
>> syms pi
>> zroot1=(r^(1/6))*(cos((phi+2*pi*k)/6)+i*sin((phi+2*pi*k)/6))
zroot1 =
[ 2, 1+i*3^(1/2), -1+i*3^(1/2), -2, -1-i*3^(1/2), 1-i*3^(1/2)]
>> imag(zroot)
ans =
0 1.7321 1.7321 0.0000 -1.7321 -1.7321
>> imag(zroot)==0
ans =
1 0 0 0 0 0
>> imag(zroot1)==0
ans =
1 0 0 1 0 0
>> clear pi
>> angle(zroot)>pi/6
ans =
0 1 1 1 0 0
>> angle(zroot1)>pi/6
??? Undefined function or method 'atan2' for input arguments of type 'sym'.
Error in ==> angle at 18
p = atan2(imag(h), real(h));
>>
№3
>> syms x
>> maple('solve','(x^3+3*x^2+3>0)',x)
ans =
RealRange(Open(-1/2*(20+4*21^(1/2))^(1/3)-2/(20+4*21^(1/2))^(1/3)-1),Inf)
>> vpa(ans,5)
ans =
RealRange(Open(-3.2790),Inf)
>> maple('solve','(x^3+3*x^2-3>0)',x)
ans =
{x < -1/4*(4+4*i*3^(1/2))^(1/3)-1/(4+4*i*3^(1/2))^(1/3)-1-1/2*i*3^(1/2)*(1/2*(4+4*i*3^(1/2))^(1/3)-2/(4+4*i*3^(1/2))^(1/3)), -1/4*(4+4*i*3^(1/2))^(1/3)-1/(4+4*i*3^(1/2))^(1/3)-1+1/2*i*3^(1/2)*(1/2*(4+4*i*3^(1/2))^(1/3)-2/(4+4*i*3^(1/2))^(1/3)) < x}, {1/2*(4+4*i*3^(1/2))^(1/3)+2/(4+4*i*3^(1/2))^(1/3)-1 < x}
>> vpa(ans,5)
??? Error using ==> sym.maple at 87
Error, invalid input: evalf expects 1 or 2 arguments, but received 3
Error in ==> sym.vpa at 32
r = maple('evalf',s,d);
1) RealRange(Open(-3.2790),Inf)
2)ошибка
3)
№4

>> syms n
>> maple('solve','(2*n^3+2*n+1)/(n^3-2*n)',n)
ans =
[ -1/6*(54+6*129^(1/2))^(1/3)+2/(54+6*129^(1/2))^(1/3), 1/12*(54+6*129^(1/2))^(1/3)-1/(54+6*129^(1/2))^(1/3)+1/2*i*3^(1/2)*(-1/6*(54+6*129^(1/2))^(1/3)-2/(54+6*129^(1/2))^(1/3)), 1/12*(54+6*129^(1/2))^(1/3)-1/(54+6*129^(1/2))^(1/3)-1/2*i*3^(1/2)*(-1/6*(54+6*129^(1/2))^(1/3)-2/(54+6*129^(1/2))^(1/3))]
>> maple('solve','{abs((2*n^3+2*n+1)/(n^3-2*n)-2)<0.01,n>0}',n)
ans =
{24.618326801033228664499427176437 < n}
>> n01=24;
>> maple('solve','{abs((2*n^3+2*n+1)/(n^3-2*n)-2)<0.001,n>0}',n)
ans =
{77.555747375144131694722493039896 < n}
>> n02=77;
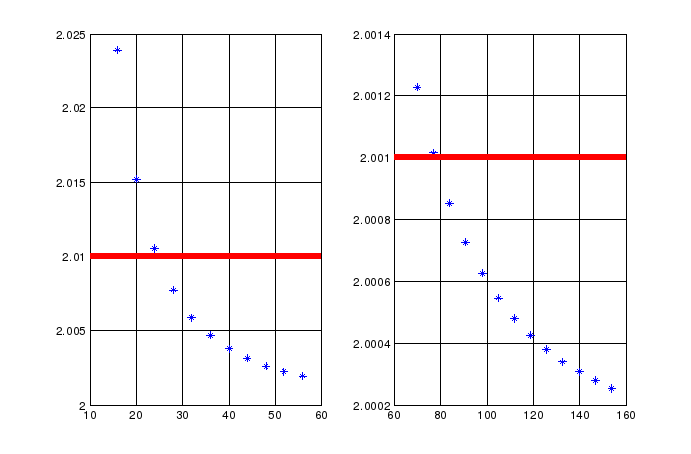
>> subplot(1,2,1)
>> hold on, grid on
>> n=16:4:56;
>> x=(2*n.^3+2*n+1)./(n.^3-2*n);
>> plot(n,x,'b*')
>> hold on, grid on
>> subplot(1,2,1)
>> hold on, grid on
>> plot(n,x,'b*')
>> a=2;
>> line([10 60],[a+0.01 a+0.01],'linewidth',4,'color','red')
>> subplot(1,2,2)
>> hold on, grid on
>> n=70:7:154;
>> x=(2*n.^3+2*n+1)./(n.^3-2*n);
>> plot(n,x,'b*')
>> line([60 160],[a+0.001 a+0.001],'linewidth',4,'color','red')
a=2
n0(0,01)=24;
n0(0,001)=77
