1 семестр / Математический Анализ / Lab2
.docxMatlab
Lab 2

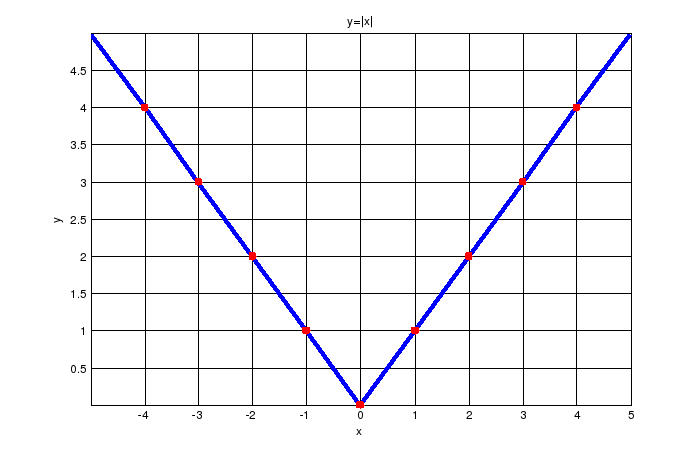
x=-5:1:5
x =
-5 -4 -3 -2 -1 0 1 2 3 4 5
>> y=abs(x)
y =
5 4 3 2 1 0 1 2 3 4 5
>> title('y=|x|')
>> xlabel('x'),ylabel('y')
>>plot(x,y,b,'linewidth',3)
>> hold on, grid on
>>plot(x,y,'r+','linewidth',4)

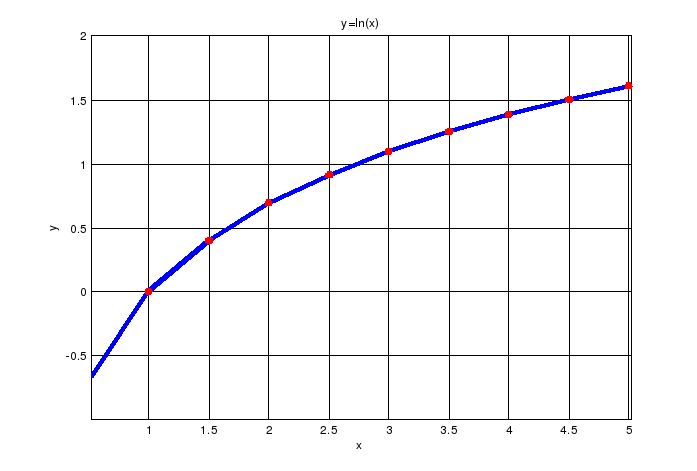
>> x=0.5:0.5:5
x =
Columns 1 through 8
0.5000 1.0000 1.5000 2.0000 2.5000 3.0000 3.5000 4.0000
Columns 9 through 10
4.5000 5.0000
>> y=log(x)
y =
Columns 1 through 8
-0.6931 0 0.4055 0.6931 0.9163 1.0986 1.2528 1.3863
Columns 9 through 10
1.5041 1.6094
>> plot(x,y,'b','linewidth',3)
>> hold on, grid on
>> plot(x,y,'r+','linewidth',3)
>> title('y=ln(x)')
>> xlabel('x'),ylabel('y')

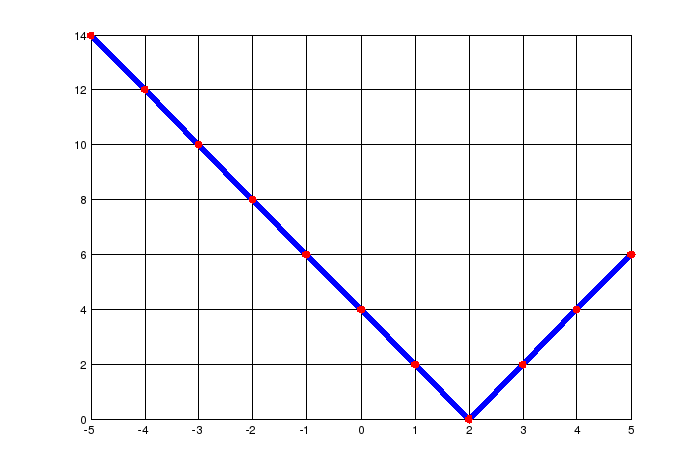
>> x=-5:1:5
x =
-5 -4 -3 -2 -1 0 1 2 3 4 5
>> y=2*abs(x-2)
y =
14 12 10 8 6 4 2 0 2 4 6
>> xlabel('x'),ylabel('y')
>> title('y=|x-2|+|x-2|')
>> plot(x,y,'b','linewidth',3)
>> hold on, grid on
>> plot(x,y,'r+','linewidth',3)

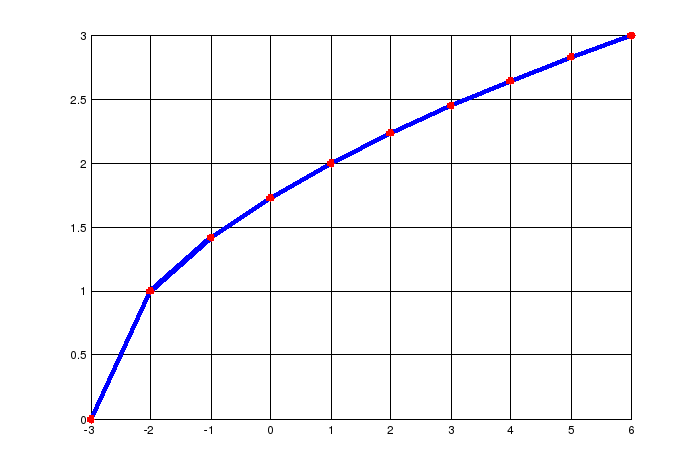
>> x=-3:1:6
x =
-3 -2 -1 0 1 2 3 4 5 6
>> y=sqrt(x+3)
y =
Columns 1 through 8
0 1.0000 1.4142 1.7321 2.0000 2.2361 2.4495 2.6458
Columns 9 through 10
2.8284 3.0000
>> title('y=sqrt(x+3)')
>> xlabel('x'),ylabel('y')
>> plot(x,y,'b','linewidth',3)
>> grid on, hold on
>> plot(x,y,'r+','linewidth',3)

>> x=-5:1:5
x =
-5 -4 -3 -2 -1 0 1 2 3 4 5
>> y=sign(x)
y =
-1 -1 -1 -1 -1 0 1 1 1 1 1
>> title('y=sign(x)')
>> xlabel('x'),ylabel('y')
>> plot(x,y,'b','linewidth',3)
>> grid on, hold on
>> plot(x,y,'r+','linewidth',3)
This is a Classroom License for instructional use only.
Research and commercial use is prohibited.
>> x=-2:0.1:2;
>> y=exp(x);
>> plot(x,y)
>> grid on
>> figure 2
??? Error using ==> figure
Single input must be an existing figure handle or a scalar integer from 1 to 2147483646
>> title('y=|x|')
>> xlabel('x'),ylabel('y')
>>
>> title('y=|x|')
>> xlabel('x'),ylabel('y')
>> grid on
>> x=-5:1:5
x =
-5 -4 -3 -2 -1 0 1 2 3 4 5
>> y=abs(x)
y =
5 4 3 2 1 0 1 2 3 4 5
>> plot(x,y)
>> title('y=|x|')
>> grid on
>> xlabel('x'),ylabel('y')
>> plot(x,y,'r'
??? plot(x,y,'r'
|
Error: Expression or statement is incorrect--possibly unbalanced (, {, or [.
>> plot(x,y,'r')
>> title('y=|x|')
>> plot(x,y,'b','linewidth',3)
>> xlabel('x'),ylabel('y')
>> plot(5,0,'^b','linewidth'4)
??? plot(5,0,'^b','linewidth'4)
|
Error: Unexpected MATLAB expression.
>> plot(5,0,'^b','linewidth',4)
>> plot
??? Error using ==> plot
Not enough input arguments.
>> title('y=|x|')
>> xlabel(x),ylabel(y)
>> title('y=|x|')
>> grid on
>> xlabel('x'),ylabel('y')
>> plot(-5,5,'^b','linewidth',4)
>> plot(5,5,'^b','linewidth',4
??? plot(5,5,'^b','linewidth',4
|
Error: Expression or statement is incorrect--possibly unbalanced (, {, or [.
>> plot(5,5,'^b','linewidth',4)
>> title('y=|x|')
>> grid on
>> xlabel('x'),ylabel('y')
>> plot(x,y,b,'linewidth',3)
??? Undefined function or variable 'b'.
>> plot(x,y,'b','linewidth',3)
>> grid on, hold on
>> plot(-5,5,'^b','linewidth',4)
>> plot(5,5,'^b','linewidth',4)
>> title('y=ln(x)')
>> xlabel('x'),ylabel('y')
>> plot(-5,5,'^b','linewidth',4)
>> hold on
>> plot(x,y,'r+','linewidth',4)
>> hold on
>> title('y=|x|')
>> xlabel('x'),ylabel('y')
>> x=0,5:0,5:5
x =
0
ans =
Empty matrix: 1-by-0
ans =
5
>> x=0.5:0.5:5
x =
Columns 1 through 8
0.5000 1.0000 1.5000 2.0000 2.5000 3.0000 3.5000 4.0000
Columns 9 through 10
4.5000 5.0000
>> y=log(x)
y =
Columns 1 through 8
-0.6931 0 0.4055 0.6931 0.9163 1.0986 1.2528 1.3863
Columns 9 through 10
1.5041 1.6094
>> plot(x,y,'b','linewidth',3)
>> hold on, grid on
>> plot(x,y,'r+','linewidth',3)
>> title('y=ln(x)')
>> xlabel('x'),ylabel('y')
>> x=-5:1:5
x =
-5 -4 -3 -2 -1 0 1 2 3 4 5
>> y=2*abs(x-2)
y =
14 12 10 8 6 4 2 0 2 4 6
>> title('y=|x-2|+|x-2)')
>> xlabel(x),ylabel(y)
>> title('y=|x-2|+|x-2)')
>> xlabel(x),ylabel(y)
>> xlabel('x'),ylabel('y')
>> title('y=|x-2|+|x-2|')
>> plot(x,y,'b','linewidth',3)
>> hold on, grid on
>> plot(x,y,'r+','linewidth',3)
>> x=-3:1:6
x =
-3 -2 -1 0 1 2 3 4 5 6
>> y=sqrt(x+3)
y =
Columns 1 through 8
0 1.0000 1.4142 1.7321 2.0000 2.2361 2.4495 2.6458
Columns 9 through 10
2.8284 3.0000
>> title('y=sqrt(x+3)')
>> xlabel('x'),ylabel('y')
>> plot(x,y,'b','linewidth',3)
>> grid on, hold on
>> plot(x,y,'r+','linewidth',3)
>>
>> help sign
SIGN Signum function.
For each element of X, SIGN(X) returns 1 if the element
is greater than zero, 0 if it equals zero and -1 if it is
less than zero. For the nonzero elements of complex X,
SIGN(X) = X ./ ABS(X).
See also abs.
Reference page in Help browser
doc sign
>> x=-5:1:5
x =
-5 -4 -3 -2 -1 0 1 2 3 4 5
>> y=sign(x)
y =
-1 -1 -1 -1 -1 0 1 1 1 1 1
>> title('y=sign(x)')
>> xlabel('x'),ylabel('y')
>> plot(x,y,'b','linewidth',3)
>> grid on, hold on
>> plot(x,y,'r+','linewidth',3)
>> x1=pi:pi/6:pi
x1 =
3.1416
>> x1=-pi:pi/6:pi
x1 =
Columns 1 through 8
-3.1416 -2.6180 -2.0944 -1.5708 -1.0472 -0.5236 0 0.5236
Columns 9 through 13
1.0472 1.5708 2.0944 2.6180 3.1416
>> y1=sin(x)
y1 =
Columns 1 through 8
0.9589 0.7568 -0.1411 -0.9093 -0.8415 0 0.8415 0.9093
Columns 9 through 11
0.1411 -0.7568 -0.9589
>> y2=sin(x-2)
y2 =
Columns 1 through 8
-0.6570 0.2794 0.9589 0.7568 -0.1411 -0.9093 -0.8415 0
Columns 9 through 11
0.8415 0.9093 0.1411
>> y2=sin(x)-2
y2 =
Columns 1 through 8
-1.0411 -1.2432 -2.1411 -2.9093 -2.8415 -2.0000 -1.1585 -1.0907
Columns 9 through 11
-1.8589 -2.7568 -2.9589
>> y3=sin(x)+1
y3 =
Columns 1 through 8
1.9589 1.7568 0.8589 0.0907 0.1585 1.0000 1.8415 1.9093
Columns 9 through 11
1.1411 0.2432 0.0411
>> plot(x1,y1,'b+',x1,y2,'y*',x1,y3,'r.')
??? Error using ==> plot
Vectors must be the same lengths.
>> title('группа графиков')
>> x1 = -pi:pi/3:pi
x1 =
-3.1416 -2.0944 -1.0472 0 1.0472 2.0944 3.1416
>> y1=sin(x)
y1 =
Columns 1 through 8
0.9589 0.7568 -0.1411 -0.9093 -0.8415 0 0.8415 0.9093
Columns 9 through 11
0.1411 -0.7568 -0.9589
>> y1=sin(x1)
y1 =
-0.0000 -0.8660 -0.8660 0 0.8660 0.8660 0.0000
>>
