

ECHO 2013 / Transcatheter Aortic and Mitral Valve Replacement The Future is Now 2
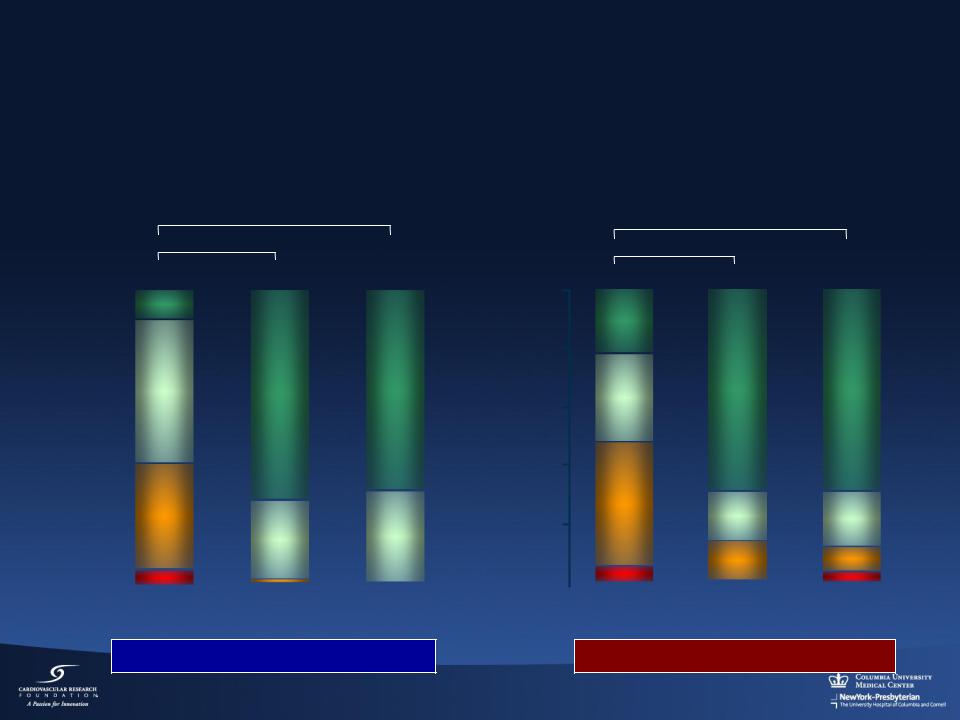
.pdfMitral Regurgitation Grade
Baseline, 1 and 2 Years (matched)
Intention to Treat
* Within group difference (p<0.05)
|
|
|
|
* |
|
|
|
|
|
|
* |
|
|
|
100 |
|
2+ |
0+ |
|
|
|
|
|
||||
|
|
|
|
|||
(%) |
80 |
|
|
1+ |
1+ |
|
|
|
|
|
|
||
|
|
|
|
|
||
|
|
|
|
|
|
|
Patients |
60 |
|
3+ |
|
|
|
|
|
|
|
|
||
|
|
|
|
|
|
|
Percent |
40 |
|
|
2+ |
2+ |
|
|
|
|||||
20 |
|
|
|
|
|
|
|
|
|
|
|
||
|
|
|
|
|
|
|
|
|
|
4+ |
3+ |
3+ |
|
|
|
|
|
|||
|
0 |
|
|
4+ |
4+ |
|
|
|
|
|
|
|
|
|
|
|
Baseline |
|
1 Year |
2 Years |
(N=122) (N=122) (N=122)
Percutaneous
Percent Patients (%)
100
80
60
40
20
0
*
*
2+ |
0+ |
|
0+ |
||
|
3+ |
1+ |
1+ |
|
|
4+ |
2+ |
2+ |
|
|
|
|
|
|
3+ |
|
|
|
|
|
|
Baseline |
1 Year |
2 Years |
|
(N=56) |
(N=56) |
(N=56) |
|
|
Surgery |
111 |
|

LV Volumes
Baseline, 1 and 2 Years (matched)
Intention to Treat
* Within group difference (p<0.05)
LV End Diastolic Volume
|
180 |
|
* |
|
* |
|
|
* |
* |
* |
|
* |
|
|
160 |
|
||||
|
|
|
|
|
|
|
|
140 |
157 |
|
158 |
|
|
|
|
|
|
|
|
|
(mL) |
120 |
|
133 |
124 |
|
|
100 |
|
|
119 |
110 |
||
|
|
|
||||
LVEDV |
|
|
|
|
|
|
80 |
|
|
|
|
|
|
|
|
|
|
|
|
|
|
60 |
|
|
|
|
|
40
20
0
BL 1 Yr 2 Yrs |
BL 1 Yr 2 Yrs |
|
|
Percutaneous |
Surgery |
N=117 |
N=55 |
|
|
LVESV (mL)
180
160
140
120
100
80
60
40
20
0
LV End Systolic Volume
|
* |
|
|
* |
|
|
* |
|
* |
|
* |
62 |
57 |
55 |
60 |
55 |
50 |
|
|
||||
|
|
|
|
|
BL 1 Yr 2 Yrs BL |
1 Yr 2 Yrs |
|
|
|
|
Percutaneous |
|
Surgery |
N=117 |
|
N=55 |
|
|
|
112
NYHA Functional Class
At Baseline, 1 and 2 Years (matched)
Intention to Treat
* Within group difference (p<0.05)
|
|
|
|
* |
|
|
|
|
|
|
* |
|
|
|
100 |
|
I |
|
I |
I |
|
|
|
||||
|
|
|
|
|||
|
|
|
|
|
||
(%) |
80 |
|
II |
|
|
|
|
|
|
|
|||
60 |
|
|
|
|
|
|
Percent |
|
|
|
|
|
|
40 |
|
III |
|
|
|
|
|
20 |
|
|
|
II |
II |
|
|
|
|
|
||
|
|
IV |
|
|
|
|
|
0 |
|
|
|
|
|
|
|
|
|
|
|
|
|
|
|
Baseline |
|
1 Year |
2 Years |
(N=127) (N=127) (N=127)
Percutaneous
100
80
60
40
20
0
*
*
I I I
II
III |
|
|
|
II |
II |
IV |
III |
III |
|
||
|
|
|
|
|
|
Baseline |
1 Year |
2 Years |
(N=56) |
(N=56) |
(N=56) |
|
Surgery |
|
113

EVEREST II Pivotal Clinical Trial
Program
EVEREST II
Surgical |
High Surgical Risk |
Population |
Population |
|
RCT |
|
|
RCT Surgery |
|
|
MitraClip |
RCT MitraClip |
|
High Risk |
|
Control |
|
||
|
|
Study |
|
|
|
|
|
|
REALISM |
Continued |
REALISM |
|
Access |
||
|
Surgical |
High Surgical |
|
|
|
||
|
Population |
|
Risk Population |
114

EVEREST II High Risk and Concurrent Control Baseline Demographics and Co-morbidities
Demographics and |
High Risk |
Concurre |
Cohort |
nt Control |
|
Co-Morbidities |
N=211 |
N=36 |
|
|
|
Age (years) |
76 ±10 |
77 ±13 |
|
|
|
≥ 75 years, (%) |
57% |
64% |
|
|
|
Predicted Mortality*, (%) |
15.0% |
16.4% |
|
|
|
Prior Cardiac Surgery, (%) |
58% |
50% |
|
|
|
History Myocardial Infarction, (%) |
49% |
36% |
|
|
|
Prior Stroke, (%) |
14% |
14% |
|
|
|
COPD / Chronic Lung Disease, (%) |
30% |
31% |
|
|
|
Moderate to Severe Renal Failure, (%) |
31% |
31% |
|
|
|
History Atrial Fibrillation, (%) |
64% |
53% |
|
|
|
Diabetes Mellitus, (%) |
40% |
42% |
|
|
|
Ejection Fraction < 30%, (%) |
9% |
9% |
|
|
|
LV ESD (mm) |
4.2 |
3.8 |
|
|
|
NYHA Class III or IV, (%) |
86% |
84% |
|
|
|
Etiology – Functional MR, (%) |
71% |
64% |
|
|
|
* Based on STS ≥ 12% or an assigned mortality 12% for pre-specified comorbidities
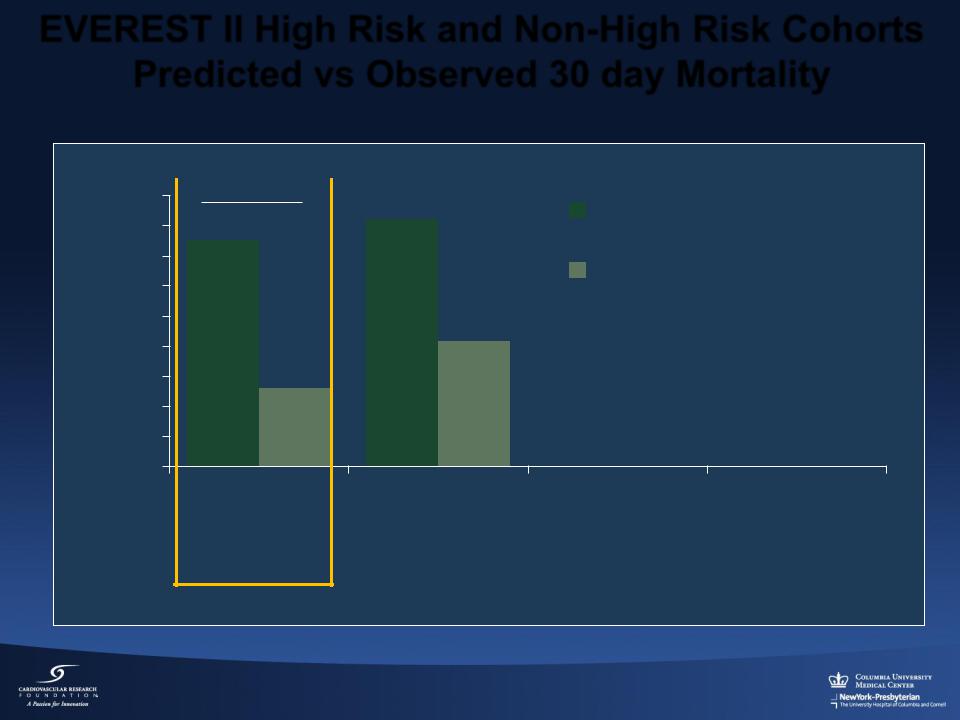
EVEREST II High Risk and Non-High Risk Cohorts Predicted vs Observed 30 day Mortality
% Mortality
18
16
14
12
10
8
6
4
2
0
p < 0.001 |
|
Predicted |
|
|
|
|
16.4% |
Observed |
15.0% |
|
8.3%
5.2%
EVEREST II |
Concurrent |
Cohort* |
Control* |
N = 211 |
N = 36 |
High Risk Cohorts
* Predicted mortality based on STS ≥ 12% or an assigned mortality 12% for pre-specified comorbidities

EVEREST II High Surgical Risk and
Concurrent Control
Kaplan-Meier Freedom From All-Cause Mortality
Freedom from All-Cause Mortality
1.0
0.8
0.6
0.4
0.2
0.0
0
At 2 Years
High Risk Cohort
At 1 Year = 66%
High Risk Cohort= 75.9%
Concurrent Control = 55.3%
p=0.048
EVEREST II High Risk Cohort (n=211)
High Risk Concurrent Control (n=36)
120 |
240 |
360 |
480 |
600 |
720 |
Days from Index Procedure
At Risk: |
0 Days |
6m |
1yr |
1.5yrs |
2yrs |
High Risk N |
211 |
179 |
155 |
102 |
53 |
High Risk CC N |
36 |
26 |
18 |
n/a |
n/a |

EVEREST II High Surgical Risk Cohort
NYHA Functional Class
All Patient Data
|
100 |
|
|
|
|
II |
|
|
|
|
80 |
I |
I |
|
Patients |
|
|
||
60 |
|
|
||
|
|
|
||
Percent |
III |
|
|
|
40 |
II |
II |
||
|
||||
|
20 |
|
|
|
|
IV |
III |
III |
|
|
0 |
|
|
|
|
Baseline |
1 Year |
2 Year |
1 Year Matched Data
p<0.0001
|
100 |
|
|
|
|
II |
|
|
80 |
|
I |
Patients |
|
|
|
60 |
III |
|
|
|
|
||
Percent |
|
|
|
40 |
|
II |
|
|
|
||
|
20 |
|
|
|
|
IV |
III |
|
0 |
|
|
|
|
Baseline |
1 Year |
2 Year Matched Data
p<0.0001 p<0.0001 p=NS
II
I I
III
II II
IV III III
Baseline 1 Year 2 Year
N=211 |
N=143 |
N=44 |
N=143 |
N=143 |
N=43 |
N=43 |
N=43 |

EVEREST II High Surgical Risk Cohort
Hospitalization for CHF
Annual Number
200
160
120
80
40
0
12 Months Prior to MitraClip, N=211
12 Months Following MitraClip, N=203
|
|
|
1 |
|
166 |
|
Rate |
0.8 |
|
|
p<0.0001 |
0.6 |
||
|
|
Annual |
0.4 |
|
90 |
||||
|
||||
71 |
|
|
|
|
0.2
36
0
p<0.0001
0.79 47%
47%
Reduction
0.42
CHF Hospitalizations |
Patients |
CHF Hospitalization Rate |

Summary
Mitraclip
•The Everest RCT showed:
Percutaneous repair provides increased safety
Surgery provides more complete MR reduction
•78% of Mitraclip patients were free from surgery at 2 yrs
•Both percutaneous and surgical treatment reduced MR and demonstrated meaningful clinical benefits through 2 years
Significantly improved LV volumes and NYHA Functional Class
•In high risk patients, Mitraclip provided meaningful benefits:
66% survival at 2 years
Reduced LV volumes and improved NYHA functional class at 2 years
120