

5. Which of the following best describes the main idea of the text?
Choose the correct letter A, B, C or D.
A definition of the market.
Different economic functions of the market.
The essential features of the market.
‘Other things’ influence.
Listening (Unit 7 page 68 – 69)
Listen to the lecture and complete the sentences below.
Write NO MORE THAN THREE WORDS for each answer.
Section 1
Because we were _____1_____ , we only discussed demand and supply.
Section 2
We now want to _____2_____ of buyers and sellers described in this table.
At low prices _____3_____ chocolate bars exceeds, is greater than, the quantity supplied.
Section 3
_____4____ of 30 pence, demand is for 80 million bars.
Section 4
When we say there is excess demand we really mean the _____5_____ the quantity supplied at this price.
Section 5
Economists use the term excess supply to mean excess in the quantity supplied _____6_____.
Section 6
They cut, reduce their prices, naturally, to _____7_____.
This _____8_____ will continue until the equilibrium price of 30 pence is reached.
Section 7
This means, of course, that the sellers will quickly _____9_____ stock.
Unit 7 supply and demand (1)
Texts 3-3 (pages 70 - 72)
Answer the questions below, using NO MORE THAN THREE WORDS for each answer.
In what way is it more suitable to learn the equilibrium price and quantity?
At what prices are quantities demanded larger according to figure 3 – 1?
What demand/supply can be analyzed examining figure 3 – 3?
What’s the reason of not being forced to participate in a market?
How do sellers response to unsold stocks?
Complete each sentence (1 – 5) with the correct ending, A-H, below reading Figure 3 - 4
Figure 3 - 4
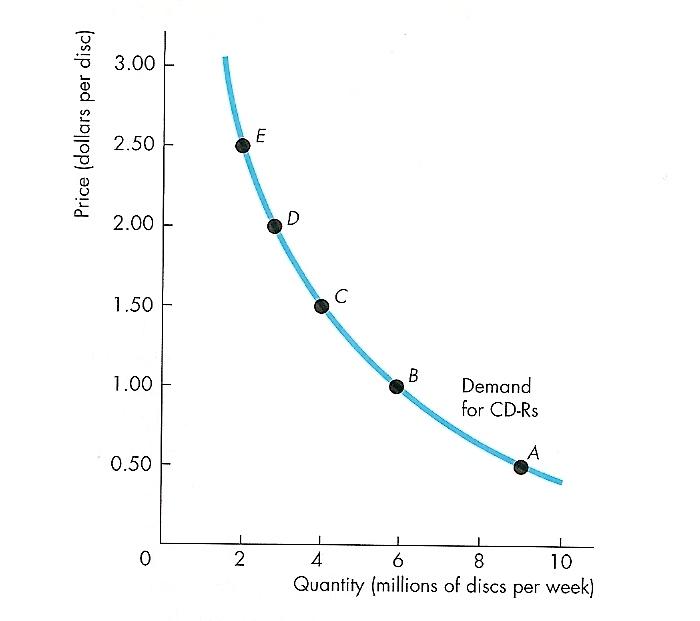
We graph the demand schedule as a demand curve with the quantity demanded of CD-Rs on
The points on the demand curve labeled A through E represent
Point B on the graph represents a quantity demanded of 6 million CD- Rs a week
If a small quantity is available, the highest price
As the quantity available increases, the marginal benefit of each additional unit falls and
the rows of the supply schedule.
the y-axis and the price of a CD-R on the x-axis.
at a price of 1.50 $ a disc.
the highest price that someone is willing and able to pay also falls along the demand curve.
that someone is willing and able to pay for one more unit is high.
at a price of 1$ a disc.
the rows of the demand schedule.
the x-axis and the price of a CD-R on the y-axis.
Complete the description of Figure 3 – 4 using the list of words from the box below
|
|
|
The demand curve shows the relationship between quantity demanded and price, everything else _____1_____ the same. The demand curve _____2_____ downward: As the price decreases, the quantity demanded _____3_____. The demand curve can be read in two ways. For a given price, the demand curve _____4_____ us the quantity that people _____5_____ to buy. For example, at a price of _____6_____ a disc, the quantity demanded is 4 million discs a week. For a given quantity, the demand curve tells us the maximum price that consumers are _____7_____ and able to _____8_____ for the last discs _____9_____. For example, the _____10_____ price that consumers will pay for the 6 _____11_____ disc is $ 1.00.
Do the following statements agree with the information given in the text 3-3?
Use TRUE if the statement agrees with the information
FALSE if the statement contradicts the information
NOT GIVEN if there is no information on this
Table 3 – 1 enables us to define the equilibrium price.
The demand curve slopes downward.
The intersection of the curves DD and SS show market equilibrium.
The equilibrium position is shown by the point A.
DC shows the excess supply at the price £0.40.
Which of the following best describes the main idea of the text 3 - 3?
Choose the correct letter A, B, C or D.
The table is more convenient to read than the diagram.
What do the demand/supply curves show.
The price of the good and the quantity relationship in a diagram form.
When market equilibrium occurs.
Speaking
Complete the description of the diagram in Figure 1 using the terms from the box below.

The first step to understanding and analyzing the effect of promotion is to consider how promotion affects sales and revenue. The goal of promotion is to attract consumers and convince them to buy your wine over another's. Since promotion affects the demand for your wine, it is important to have a firm understanding of what the demand for your wine represents. To illustrate how promotion affects sales and revenue, we estimated the demand function for California Cabernet Sauvignon. A simplified representation of the demand for this wine is shown in Figure 1. …
|
demonstrates sold the greater |
between and the quantity |
the demand curve the higher the lower |
the relationship price units |
Describe Figure 2 and Figure 3.
Figure 2

Figure 3
