

Nafziger Economic Development (4th ed)
.pdf626Part Four. The Macroeconomics and International Economics of Development
countries receive preferences, LDCs with three-quarters of the world’s poor living on no more than $PPP1 per day do not benefit. Also some LDCs may not enter eligible markets because of rules of origin (to prevent transshipment or reexport of goods produced in noneligible countries) and administrative and paperwork requirements. Moreover, the top nine beneficiaries of U.S. GSPs – Thailand, Indonesia, India, Philippines, Venezuela, South Africa, Russia, Turkey, and Chile – are mostly middle-income countries. Furthermore, DCs rarely grant substantial preferences in sectors in which LDCs have the largest comparative advantage. All in all, GSPs’ benefits are modest (World Bank 2004b:xv, 209–216).
Cline (2004:xiv, 21–22) calls for DCs to provide “immediate free entry for imports from ‘high risk’ low-income countries” (highly indebted poor countries, leastdeveloped countries, and sub-Saharan Africa). The poverty intensity of DC imports from these countries is high, with 60–70 percent of imports from the $2/day poor (33 percent from LDCs generally), implying that eliminating DC trade barriers could do more than anything else to reduce poverty.
Expanding Primary Export Earnings
The Organization of Petroleum Exporting Countries (OPEC) was fairly successful in the 1970s in maintaining prices and limiting output (Chapter 13). Here we do not concentrate on oil but on other primary products, the major focus of those economists concerned about LDC export expansion.
STAPLE THEORY OF GROWTH
The export of staples, such as primary or primary-product-intensive commodities, is sometimes a major engine of growth. The staple theory of growth was first used to explain the association between expanding primary production (wheat) and economic growth in late-19th-century Canada (Innis 1933; Watkins 1963:141–158). Other examples of staple exports stimulating growth include English textiles (the late 18th century); U.S. cotton (the early 19th century) and grain (after the Civil War); Colombian coffee (the last half of the 19th century); Danish dairy products (the last half of the 19th century); Malaysian rubber and Ghanaian cocoa (first half of the 20th century); and Korean, Taiwanese, and Hong Kong textiles (after 1960). The recent examples of Bangladesh jute, Sri Lankan tea, Zambian copper, and Cuban sugar, however, suggest that staple export expansion does not necessarily trigger rapid economic growth.
INTEGRATED PROGRAM FOR COMMODITIES
Exporters of primary products other than minerals and petroleum frequently face short-run demand and supply inelasticities and thus greater price (Chapter 4) and income (price multiplied by quantity) fluctuations than manufactures exporters. In 1976, in the face of OPEC success, low foreign aid, and the perception that commodity markets were biased against LDCs, UNCTAD proposed an integrated program for commodities – consisting of output restrictions or export quotas, international
17. International Trade |
627 |
buffer stocks, a common fund, and compensatory financing – to stabilize and increase primary commodity prices and earnings. Emphasis was on 10 core commodities – cocoa, coffee, tea, sugar, cotton, jute sisal, rubber, copper, and tin – chosen on the basis of wide price fluctuations, large shares in LDC primary exports, or high export concentration in LDCs. Primary-product commodity prices are more volatile than prices of manufactures (World Bank 1993e:58; World Bank 1994i:62; World Bank 2002c:18).
Cartels. The Organization of Petroleum Exporting Countries (OPEC) is a cartel whose members have agreed to limit output and fix prices. During most of the 1980s and 1990s, OPEC was not effective as a cartel.
The number of primary commodities for which collusion would be effective or feasible is small. The prime candidates for a successful price-raising cartel appear to be the tropical beverages, coffee, cocoa, and tea, if action were taken to avoid substitution among them. Even though there are competitive threats from coffee grain mixtures and cocoa substitutes, these three beverages have long-run import demand inelasticities. When demand is inelastic, supply reductions increase the price and total revenues. The long gestation between new planting and production contributes to high prices spurring increased investment and subsequent oversupply followed by prolonged periods of low prices (World Bank 1994i:52). The major difficulties for a beverage cartel controlling supply would be disagreements between traditional and new producers about market shares, and the evidence that the major beneficiaries of such a cartel would be middle-income countries.
The Danish economist Karsten Laursen (1978:423–435) argues that sugar, rubber, fiber, and metal cartels are not likely to increase prices because the long-run demand elasticity for the imports of these goods is high, because potential substitutes are many.
Buffer stocks. Some international agreements among commodity producer governments provide for funds and storage facilities to operate a buffer stock to stabilize prices. The buffer stock management buys and accumulates goods when prices are low and sells when prices are high to maintain prices within a certain range.
A 1975 U.N. General Assembly resolution asks for buffer stocks to secure more “stable, remunerative, and equitable” prices for LDC exports (Survey of International Development 1975). There are, however, several major problems with such a program.
First, because of overoptimism or pressure from producer interests, buffer stock management often sets prices above long-run equilibrium, and stocks overaccumulate.
Second, the costs of storage, interest, and (for some commodities) spoilage are high. Laursen estimates that the annual costs for buffer stocks for the ten core commodities, $900 million, would exceed the gains to producers ($250 million) and consumers ($75 million) by more than $500 million.
628 Part Four. The Macroeconomics and International Economics of Development
Third, the objective of commodity stabilization is not clear. Stability may refer to international commodity prices, producers’ money income or real income, export earnings, or export purchasing power. Stabilizing one of these variables may sometimes mean destabilizing another. For example, price stability destabilizes earnings if demand is price elastic.
Fourth, by reducing risk, price stability may intensify competition and increase investment, decreasing the long-run equilibrium price. By contrast, price stability, especially in jute, sisal, cotton, and rubber, may prevent consumers from seeking synthetic substitutes (Laursen 1978:423–435; Meier 1980:312).
Chapter 15 mentioned the abandoned E.U. and limited IMF compensatory funds for primary exports.
Agricultural Protection
The model of Mary Burfisher (2003:xi–xiii) and her colleagues indicates that eliminating global agricultural policy distortions, mainly tariffs and subsidies, would result in an annual world static welfare gain of $56 billion or about 0.2 percent of global GDP. European Union policies account for 38 percent of distortion, the United States 16 percent, and Japanese and Korean 12 percent.
As Figure 17-7 indicates, agricultural tariffs in DCs are higher in DCs than industrial tariffs. But in addition to these border barriers (tariffs and quantitative restrictions), protection also includes production-related subsidies. Taken together, in 1999– 2001, protection for farm goods in the OECD was 48.5 percent, with 29.6 percent for the United States, 56.0 percent for the European Union, and 152.9 percent for Japan (Table 17-4). In 2001, export prices for U.S. wheat, corn, and rice were 58, 67, and 77 percent of their costs of production (World Bank 2004b:126, citing Watkins 2003).
To illustrate, if OECD wheat is subsidized at 50 percent, then for every $30 a ton for wheat (about $4 a bushel), the OECD farmer gets a cost cushion that allows her a cost of production of $50 compared to $30 cost a ton (transport excluded) in, say, Morocco. Figure 17-8b shows how subsidies and high domestic prices of wheat encourage production and reduced net imports in 1974 to net exports in the 1990s.
World trade in cotton is so severely distorted that in 2004, the WTO issued a preliminary ruling stating that the U.S. subsidy to producers violates international trade rules. In 2001–02, the United States supported producer prices at 91 percent higher than the world market price. Oxfam (Watkins and Sul 2004), a U.K. development, relief, and advocacy agency, estimates that Mali lost $43 million in cotton export revenue in 2001, 16 percent more than U.S. aid the country received in that year! In 2001–02, 25,000 U.S. cotton farmers (10 percent of those raising cotton) received $3 billion in subsidies, equivalent to the entire economic output of Burkina Faso, where two million people depend on cotton for their livelihood (World Bank Development News, July 11, 2003). Simulations indicate that full liberalization (the European Union also subsidizes cotton) would increase world prices 13 percent and world trade by 6 percent in 10 years. Cotton exports by West Africa (Mali, Burkina


630 Part Four. The Macroeconomics and International Economics of Development
FIGURE 17-8. High Protection of Sugar and Wheat Has Increased Domestic Production and Reduced Net Imports. Source: World Bank 2004f:128.
about U.S. dumping and unfair trade, also abandoned the decoupling of farm support (ibid.; Ray et al. 2003).
The World Bank (2004f:127) recommends that government make a one-time unconditional payment to all farmers or those deemed to need compensation, helping farmers adjust to free markets. Failing that, governments need to clearly define program eligibility and put a time limit on payments. These Bank recommendations have not been palatable to the United States and many other countries, making progress on the agricultural agenda at Doha doubtful.
But we should not only focus on DC agricultural protection. A simulation by World Bank economists (1976i:122–132, 144) indicates that LDCs, whose trade barriers are biased against other LDCs’ agricultural goods, would realize even much larger efficiency gains by free agricultural trade within the developing world than by free farm trade between DCs and LDCs.
Trade in Services
With globalization, more labor services have entered the international marketplace. During the last three decades, the United States has had a persistent comparative advantage and surplus in the trade of services and financial assets (Mann 1999: 6–37)11 (remember Chapter 4’s mention of U.S. trade “decomposing the productive
11 Mann, discussing whether the U.S. merchandise trade deficit is sustainable, argues that the United States can compensate for the deficit by expanding services exports. She points out that the United States has a comparative advantage in services and financial assets and should be assertive in urging the liberalization of business, finance, professional, insurance, electronic, and other services.
17. International Trade |
631 |
process into separable functions . . . allocated around the world”). As a result, during WTO/GATT’s Uruguay (1986–94) and Doha (2002–) Rounds of negotiation under the General Agreements on Trade in Services (GATS), the United States took leadership in efforts to liberalize trade among services.
Trade in services amounts to 25 percent ($1.2 trillion) of 1999 total world trade, which represented growth faster than trade in goods. Moreover, the World Bank estimates that liberalization of services could provide as much as $6 trillion in additional income in the developing world by 2015, four times the gains that would come from liberalization of trade in goods (World Bank 2002a:69–94). Yet negotiators made little progress in opening markets to management consulting, legal, accounting, engineering, advertising, insurance, financial, health, educational, transport, trade, and tourism services, and software. Many LDCs fear the dismantling of public services, even though WTO members have the right to determine which activities to open to foreign providers, including coverage and content, and what regulations to enact to protect the public interest. LDCs opposed liberalizing services not only because of the opposition of strong vested interests but because of the fear of losses from technological learning gains. Still, sometimes joint ventures and contracts with foreign consultants can provide an impetus for development of LDC services. However, for expansion in the trade in services to reach its potential, countries need clarity, and predictability in entry and exit, adopting systems that facilitate visas for up to one year for foreigners performing important services within the country (World Bank 2004f:144–145).
Despite the United States’ recent surpluses in services, the increased trade in services may eventually benefit LDCs such as China, India, and the Philippines even more. These countries have a comparative advantage in inexpensive skilled labor services (see Chapters 1 and 2 on India’s costs of labor services relative to those in the United States). With rapidly falling prices for international telephone calls, faxes, and e-mails, U.S. multinational companies and federal and state government agencies are increasingly outsourcing (contracting to a foreign company or unit) or offshoring (running directly) skilled services, such as “research and development, prepar[ing] tax returns, evaluat[ing] health insurance claims, transcrib[ing] doctors’ medical notes, analyz[ing] financial data, [asking payment for] overdue bills, read[ing] CAT scans [computed axial tomography or X-ray imaging for medicine], creat[ing] presentations for Manhattan investment banks and much more” (Waldman 2003). English speakers abroad, in India, Ghana, or other LDCs, staff many telephone service desk jobs such as customer service help, technical support, and routine calls to clients or service recipients for U.S. companies or units. India, for example, with more than two million college graduates annually, has a large pool of educated English speakers available for no more than one-tenth of U.S. salaries. If telecommunications costs are negligible, trainers merely need to teach foreign English speakers to be empathetic, acquire minimal information about the United States, and (most important) speak with U.S. accents (ibid., 2003; Zachary 2003) to undercut services costs of U.S. college graduates.
632 Part Four. The Macroeconomics and International Economics of Development
The Mankiw Debate
Economists know Harvard’s Gregory Mankiw, who became chair of the U.S. Council of Economic Advisors (CEA) in 2003, as the coauthor of the augmented neoclassical growth model (Chapter 5) and author of principles’ and intermediate macroeconomics’ textbooks. As CEA chair, he wrote, with his colleagues in the 2004 Economic Report of the President:
One facet of increased services trade is the increased use of offshore outsourcing in which a company relocates labor-intensive service industry functions to another country. . . . Whereas imported goods might arrive by ship, outsourced services are often delivered using telephone lines of the Internet. The basic economic forces behind the transactions are the same, however. When a good or service is produced more cheaply abroad, it makes more sense to import it than to provide it domestically. (U.S. CEA 2004:229)
Among economists, this is not controversial, an application of the theory of comparative advantage. And indeed, as the quotes from Catherine Mann state, this type of specialization increases employment and economic growth. However, with election issues in which Democratic Party challengers focused on job insecurity and inadequacy of health care insurance, a comment by President George W. Bush’s CEA chair supporting outsourcing overseas immediately sparked a public debate. At about the same time, Democratic presidential candidate Senator John Kerry was blasting chief executives of U.S. companies that outsourced computer and managerial jobs to India as “Benedict Arnold CEOs,” an allusion to an army officer Americans regarded as a traitor during the Revolutionary War of 1776 against Britain.
Most politicians of the two major parties, Democratic and Republican, were united in condemning Mankiw’s statement. Professor Mankiw was compelled to apologize for leaving “the wrong impression that I praised the loss of U.S. jobs.” In the end, the debate became one between most prominent U.S. economists who supported Mankiw versus most politicians, including the president who distanced himself from the statement in his economic report. But like most such matters during an election cycle, the controversy blew over in a few days.
Intellectual Property Rights
The United States, as the world’s leader in patents, trademarks, and copyrights, forms of intellectual property rights (IPR), has been vulnerable to losses of economic returns from unprotected rights and piracy. Thus, during WTO’s negotiations, the United States also has taken leadership to establish international rules to enforce protection of intellectual property rights enforcement worldwide.
WTO provides 10 to 20 years of protection of patents, trademarks, copyrights, biotechnological products, and other innovative products. The agreement guarantees creators of intellectual products and creative works a limited exclusive economic right. These provisions will increase LDC costs of royalty payments to foreigners, payments for products manufactured under license or imported, and enforcement
634 Part Four. The Macroeconomics and International Economics of Development
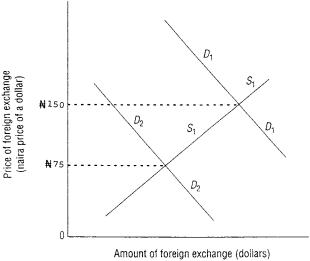
FIGURE 17-9. Determining the Price of Foreign Exchange under the Market and Exchange Controls. If allowed to float freely, the exchange rate will be -–N150 = $1, at the intersection of D1 and S1. Controls on currency transactions by domestic citizens can repress demand to D2, which intersects S1 at a price of foreign exchange -–N75 = $1. This rate, however, is likely to discourage exports and encourage attempts to obtain import licenses.
for official transactions (with the IMF and other central banks) (Fischer 2001:3–24; IMF Surveys). An extreme case of the hard peg, (4), the currency board, established by Argentina in 1991 after the hyperinflation at the end of the 1980s, contributed to a severe economic depression in the early years of the 21st century.
Domestic Currency Overvaluation
The domestic currency (Nigerian naira) price of foreign (U.S. dollar) currency, for example, —N 150 = $1, is the price of foreign exchange. In a free market, this exchange rate is determined by the intersection of D1, the demand for foreign currency (depending on the demand for foreign goods, services, and capital), and S1, the supply of foreign currency (depending on foreign demand for domestic goods, services, and capital). (See Figure 17-9.)
Nigeria’s increased demand for U.S. computers or insurance, or a reduced U.S demand for Nigerian oil or cocoa, increases the foreign exchange rate, for example, from —N 150 = $1 to —N 175 = $1.
The Central Bank of Nigeria may keep down the price of foreign exchange by using exchange controls to limit its citizens’ purchase of foreign currency for foreign equipment, materials, consumer goods, and travel. Assume that the market-clearing price of foreign exchange (with no exchange controls) is —N 150 = $1, determined
17. International Trade |
635 |
by D1 and S1. To avert a balance of payments crisis and domestic currency devaluation, however, Nigeria may repress demand to D2 through exchange controls and trade restrictions, so that the actual price of foreign exchange is —N 75 = $1, at the intersection of D2 and S2.
Overvaluing the domestic currency relative to foreign currency, however, may discourage import substitution and exports. At the rate of —N 75 = $1, the exporter selling cocoa for $10 a kilogram earns only —N 750, rather than —N 1,500 at the market exchange rate. Additionally, the domestic steel firm imports a computer whose world price is $1,000 at only —N 75,000 rather than —N 150,000.
Avoiding Bias against Exports
Most LDCs’ prices of foreign exchange are lower than market rates (for example,
—N 75 = $1 is lower than —N 150 = $1), meaning they are biased against exports. These submarket exchange rates mean that the price ratio of nontraded to traded goods increases, so that imports and competitors to exports are cheaper in domestic currency. Some notable exceptions to low exchange rates argue in favor of adjusting exchange rates so they do not discriminate against exports. The yen in rapidly growing, early modern (Meiji) Japan (1868–1912) chronically depreciated vis-a`-vis the U.S. dollar, which meant that the real exchange rate (see below) remained virtually unchanged. Fortuitously for Japan, during most of this period, the yen’s standard was silver, which declined relative to gold. Moreover, Japan’s modest trade restrictions (which reduced the demand for dollars and by themselves overvalued the yen) were offset by export promotion schemes (which increased the demand for yen). Doubtlessly, these foreign exchange policies help explain why Japan’s annual real average growth rates in exports during the Meiji period were at least twice those of either the United States or Britain. Additionally, studies on effective rates of protection and effective subsidies indicate that South Korea, virtually the most rapidly growing LDC after World War II, discriminated in favor of exports (Westphal and Kim 1977; Nam 1981:46–73; Fransman 1986:76–85; Nafziger 1986b:1–26; Nafziger 1995:129–152).
Domestic Currency Devaluation
The country with an overvalued currency could impose compensating duties and surcharges on imported inputs and capital instead of relying on exchange controls, licenses, or quotas that implicitly subsidize the successful applicant. But these duties and surcharges, tax incentives, subsidies, loans, and technical assistance may stimulate import replacements and exports less than an overvalued domestic currency inhibits these activities. Devaluing the domestic currency to its equilibrium rate in order to ration imports through the market, encourage import substitution, and promote exports may be preferable to inducements under an overvalued currency regime. Additionally, domestic currency depreciation would increase labor-intensive