

Nafziger Economic Development (4th ed)
.pdf616 Part Four. The Macroeconomics and International Economics of Development
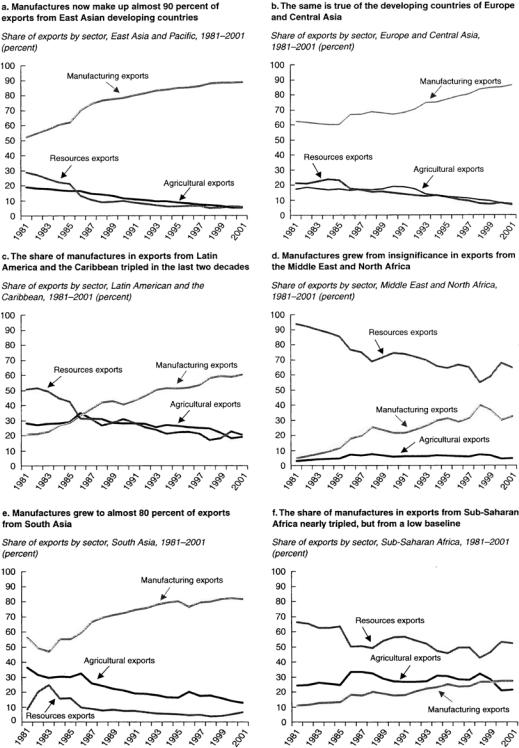
FIGURE 17-2. Developing Countries Have Become Important Exporters of Manufactured Products. Source: World Bank 2004f:65.
advanced components (engines, transaxles, and electronics) from Japan, styling and design engineering from Germany, small components from Taiwan, Singapore, and Japan, advertising and marketing services from Britain, and data processing from Ireland and Barbados (Reich 1991:113).
Two indications of the increase in GPNs are the increase in the percentage share of world trade accounted for by imported inputs embodied in exports and the ratio of imported to total intermediate inputs in manufacturing. Figure 17-5 shows the increases in these ratios in France, the United Kingdom, and the United States from 1974 to 1993. In addition, the share of U.S. MNCs affiliates’ import of intermediate imports in total sales increased significantly in manufacturing, industrial machinery and equipment, electronics, and transportation equipment from 1982 to 1998 (World Bank 2003h:56).
17. International Trade |
617 |
FIGURE 17-3. Manufactures Account for a Growing Share of Exports in All LDC Regions.
Source: World Bank 2004f:67.

618 Part Four. The Macroeconomics and International Economics of Development
FIGURE 17-4. U.S. Cars Are Produced in Many
Countries (percent share in value added).
Source: World Bank 2003f:55.
Might the increased LDC exports of manufactures only reflect the increasing number of steps in the value-added ladder? No. Table 4-1 shows that each of low-income countries and middle-income countries has a higher percentage of GDP value added in industry than high-income countries do.
Rapid technological progress in transport, communications, electronics, and data processing has increased flows of FDI and cross-border production network. Cheaper and faster telephone, fax, Internet, and cargo connections, and improved ability to process and analyze data, using electronic interchange, have facilitated global networks. Lower tariffs are also an important contributor to the size of intermediate inputs relative to total sales of U.S. affiliates, a measure of GPN activity. During the decade before the accession of eight East and Central European countries into the original E.U. 15 in 2004, the exports of processed goods from East to West increased rapidly. In addition, after the formation of NAFTA in 1994, Mexico’s maquiladora industry grew spectacularly (World Bank 2003h:57–58).
Among emerging nations, Mexico, Thailand, Malaysia, China, and high-income Korea comprise 78 percent of the sales of parts and components to DCs. The
FIGURE 17-5. Cross-Border Networks Capture Increasing Shares of Production and Trade.
Source: World Bank 2003f:56.
17. International Trade |
619 |
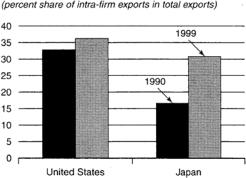
FIGURE 17-6. Increase of Intrafirm
Exports in Total Exports. Source: World
Bank 2003f:59.
emerging–DC link can involve ownership, arm’s length transactions (where sales are in organized markets), and supplier–purchaser relationships (World Bank 2003f:61– 62). To maintain control over technology, FDI in a subsidiary is the preferred choice, reflected in the share of intra-firm exports in the MNCs’ parents’ exports, especially in Japan (Figure 17-6).
GPNs enable production to be broken into discrete stages, each performed in countries best suited for the stages. Frequently, LDCs undertake production activities requiring low-skilled labor, a low-tech component of a high-tech good. However, the LDC can improve productivity through learning by doing and expanding productive firms. Both China and India have doubled global production sharing from 1980 to 1998, as indicated by the doubling of imported inputs into a unit of export. The expansion of duty-free access of imported intermediates in the production of exports has facilitated participation in GPNs for both countries.
China has favored imported inputs in the labor-intensive production of manufactures. Indeed, processing of imported intermediates comprise about half of total exports. Both China and India have expanded the range of products exported. With export growth, both countries experienced only a moderate decline, if any, in terms of trade in the 1990s and early part of the 21st century. Moreover, both countries, particularly China have negotiated favorable joint ventures and technology transfer agreements, enabling learning gains to be captured in domestic enterprises independent of the foreign MNC (World Bank Group 2004:69–77).
In her discussion of the U.S.’s trade deficit, Catherine L. Mann (1999:41), an analyst at the Institute for International Economics, contends that
The United States has the comparative advantage in producing and exporting certain parts of the production process (the high-value-added processor chips, the innovative and complex software, and the fully assembled product), but has relinquished parts of the production process to other countries where that stage of processing can be completed more cheaply (memory chips, “canned” software, and most peripherals). The United States cannot have comparative advantage in the export of the final product if it cannot combine its own comparative advantage in the initial ingredients with the comparative advantage of other countries applied to the production process at critical stages. Comparative advantage thus can be a function of trade itself.
620 Part Four. The Macroeconomics and International Economics of Development
Indeed, Mann estimated that “U.S. companies were able to reduce the cost of computers and communications equipment by about 10% to 30% by making the equipment in factories around the world. That lifted U.S. economic growth by about 0.3 percentage point a year between 1995 and 2002, as more companies made use of information technology. She expects similar economic gains if computer software is produced in an internationally efficient fashion” (Davis 2004:A1).
The McKinsey Global Institute contends that outsourcing by the United States of jobs to India benefits both economies. For each $1 of U.S. spending sent offshore, the United States receives $1.12–1.14 net benefit: from savings to U.S. investors and customers, imports of U.S. goods and services by providers in India, transfer of profits by U.S.-based providers back to the United States, and the value from U.S. labor reemployed (Economist 2003i:67–69).
Since the depreciation of the U.S. dollar relative to the yen beginning in late 1985, and the relative increase of domestic costs because of cartels and informal protection, Japan’s efficient export sector has sought export platforms abroad, first in Asia, then the United States, the European Union, and Latin America. Japanese companies have tried to retain their international price competitiveness in manufacturing products by organizing a borderless Asian economy. This borderless system encompasses a new international division of knowledge and function that selects the more sophisticated activities, including R&D-intensive and technology-intensive industries for the newly industrializing countries (NICs), South Korea, Taiwan, Hong Kong, and Singapore, while assigning the less sophisticated, labor-intensive, low valueadded production and assembly, which use more standardized and obsolescent technologies, to China and the ASEAN four, Indonesia, Malaysia, the Philippines, and Thailand.
According to Japanese official definitions used in the early 1990s, Japanese foreign direct investment does not necessarily depend on majority ownership, but can involve only 10 percent ownership if the Japanese corporation either has at least one part-time director, furnishes the technology, provides financial assistance, executes an exclusive agency agreement, or purchases products, raw materials, or parts from the production facility abroad. Moreover, the Japanese company does not even need any equity holding to be involved in foreign direct investment if the firm provides loans exceeding one year to a firm abroad whose management is influenced by the Japanese corporation through long-term contract (Shojiro 1992a:5–48). Steven Schlossstein (1991:32, 152) uses the metaphor of a flying geese formation of the East and Southeast Asian economies, with Japan at the lead, the NICs toward the front, and the ASEAN four close behind.
Sony, an example of this global seamless network, has factories for audio, television, and video products and parts in Taiwan, Korea, Thailand, Malaysia, and Singapore, the major distribution warehouse in Singapore, and linkage of these units on-line with Japanese, U.S., European, and Southeast Asian companies as well as important cooperating firms (Shojiro 1992b:37–38).
Despite the advantages to the ASEAN four, the borderless economy contributes to a widening gap between modern branches of industry, such as electronics, and
17. International Trade |
621 |
traditional branches within the country. To be sure, ASEAN labor learns how to produce inputs and parts to precise specifications for Japanese high-tech industry. However, the ASEAN four have left technical details to their foreign business partners, so that these countries lack the ability to adapt and innovate, which is concentrated in Japan and the NICs.
Another factor limiting ASEAN’s gains from the borderless system is the fact that Japanese (and other DC) MNCs raise the lion’s share of their funds from the local capital market. The most successful of the South and Southeast Asian countries are Thailand and Malaysia. Both countries have attracted high-technology industries such as computers, electronics, and semiconductors as a part of the Japanesedirected borderless economy. Indeed, in 1993, Malaysia was third to the United States and Japan in producing semiconductors (primarily for Japanese companies, such as Hitachi, Toshiba, and NEC) and the world’s leading exporter of computer chips. But both Thailand and Malaysia pay relatively little attention to bottom-up development of indigenous manufacturing techniques. The development of indigenous technological capability requires, similar to Meiji Japan, a conscious and aggressive strategy of technical innovation (Schlossstein 1991:232; Morris-Suzuki 1992:145–148; Shojiro 1992a:158–163; Takeshi 1992:97; World Bank 1993a:238–239).
Malaysia and Thailand’s positions in an international division of labor (as a part of Japan’s borderless economy since the mid-1980s) seem to be based, as in late-19th- century Japan, on near-market exchange rates that expedite labor-intensive exports. Malaysia and Thailand have enjoyed limited prosperity while, however, sacrificing their economic autonomy to less-sophisticated, labor-intensive, low value-added production in a Japanese-organized division of knowledge. However, Takeshi Aoki (1992:73–110) and Tessa Morris-Suzuki (1992:135–152) contend that the shortrun prosperity from integration within the Japanese-led trading system came at the expense of the technological learning and skill acquisition essential for rapid growth in the late 1990s and early 21st century. Aoki mentions the inadequate spending on R&D, the lack of indigenous mastery of industrial technology, the few Malay entrepreneurs, the sparse linkages within the industrial economy, and the substantial shortage of skilled workers, technicians, and engineers as major obstacles to Malaysia’s future growth. For Morris-Suzuki, some major barriers to Thailand’s prospective development are the concentration of technological transfer within multinational enterprises rather than local firms, the lack of innovation and adaptation by indigenous personnel, the falling R&D capability, the poor communications facilities, and the low secondary-school enrollment rates. Indeed, Malaysia and Thailand have emphasized peripheral intermediation in technologically complex industrial production rather than indigenous innovation and technology generation in less complex industry that provides more scope for gains from learning. Ironically, for Malaysia and Thailand to follow the early Japanese model means less dependence on technology, capital, and imports from Japanese multinational corporations and more indigenous technological innovation.
Still, participation in the DC-dominated global production networks has contributed to independent technological innovation in Asian LDCs, such as China,

622Part Four. The Macroeconomics and International Economics of Development
India, Malaysia, and Thailand. In some instances, China, having begun with the lower value-added steps, has decided to produce the highest stage in China or outsource higher stages to DCs or LDCs. Also, in India, software companies have, with technological learning, expanded exporting independent of MNCs, and have acquired firms or established subsidiaries in the United States, often with Indians and Indo-Americans with substantial software and electronic experience.
DC Import Policies
The World Trade Organization (WTO)/General Agreements on Tariffs and Trade (GATT) system administers rules of conduct in international trade. GATT, founded in 1947, continues as the umbrella treaty on trade in goods, with WTO, established in 1995, until WTO becomes all encompassing.
WTO/GATT applies only to economies where market prices are the rule, thus denying membership to countries where the state is the predominant international trader. China’s post-1979 economic reforms enabled it to become a WTO member in 2001. Russia’s accession to the WTO is expected in the middle of the first decade of the 21st century.
Under WTO/GATT, LDCs have called for DCs to remove or reduce trade barriers against third-world exports, especially manufactured and processed goods. The World Bank (1988i:16) estimated the cost of DC protection against LDCs ranges from 2.5 percent to 9 percent of their GNP. In 2004, this protection was almost as costly; the World Bank Group (2004:xxviii–xxx, 38–54) sees trade liberalization in the Doha Development Round (2001–) as the major plank to reach Millennium Development Goals to reduce poverty (Chapter 2).
For African industrial export expansion to be successful, DCs must reduce protectionist policies. If DCs had dropped manufacturing tariffs on Africa in 1989 by 5 percentage points, an IMF simulation model (1990) estimates the following effects in the early 1990s:
Because DC progress in reducing tariffs since the 1990s has been limited, the size of gains from trade may still be as substantial as this table.
Average
|
|
1990 |
1991 |
1992–95 |
|
|
|
|
|
|
|
|
current account |
+1.0% |
+0.8% |
0% |
|
|
balance/export |
−9.2% |
−11.3% |
−9.5% |
|
|
debt/export |
|
|||
|
debt service/export |
−1.5% |
−1.7% |
−1.4% |
|
|
real GNP |
+1.2% |
+1.6% |
+1.6% |
|
|
export volume |
+2.6% |
+3.4% |
+3.3% |
|
|
import volume |
+3.0% |
+4.1% |
+4.5% |
|
|
|
|
|
|
|


 Developed


 Developing
624Part Four. The Macroeconomics and International Economics of Development
levels of processing where poor countries concentrate their industrial activities, have encouraged importing raw materials at the expense of processing, especially at lower levels. Fifty-four percent of DC imports from LDCs are at stage 1, 29 percent at stage 2, 9 percent at stage 3, and 8 percent at stage 4. Zambia, which had the largest nonagricultural share (84 percent) of 1992 GDP in the low-income sub-Sahara and a high elasticity of employment growth with respect to nonagricultural output growth, expanded from consumer goods to intermediate and capital goods. But high effective protection rates on processing have diverted Zambia’s industrial growth from exports to import substitution. Indeed, until the late 1980s, MNCs with subsidiaries in Zambia, Zaire, Botswana, and Namibia built most of the fabricating and processing plants in South Africa and in the West. High protection rates on processing have also diverted India, Pakistan, Sri Lanka, and Indonesia, each of which has a nonagricultural sector with a share in 1992 GDP of at least 68 percent, from exports to import substitution. GATT’s Uruguay Round negotiations, 1986–94, which reduced overall DC tariffs to 4 percent, resulted in modest liberalization in the trade of industrial goods; yet high effective rates of tariffs may frequently still remain at stages 2 and 3, and nontariff barriers may continue (World Bank 1994b:166; UNCTAD 1994:x).
Suppose an industrialized country has no tariff on raw cotton imports but a 5-percent tariff on cotton yarn imports. Assume raw cotton sells for $600 per ton and cotton yarn for $700 a ton, with $100 value added by the cotton yarn industry. The 5-percent nominal cotton yarn tariff (or $35), although only a small fraction of total sales value, is a 35-percent effective tariff rate on the $100 value added. It allows the domestic, DC, cotton yarn producer to be much less efficient than the foreign producer and still retain the home market. World Bank (1981i:22–34; 1987i:136) data indicate that although the effective protection rate of post–Tokyo Round tariffs was 2 percent for raw materials, it was 15–20 percent for processed and manufactured products.
Other disturbing developments have been the trade restrictions – the Multifiber Arrangement (MFA), “voluntary” export restraints, trigger price arrangements, antidumping duties, industrial subsidies, and other nontariff barriers (NTBs) – introduced in the 1970s, 1980s, and 1990s. In 1987, DC use of NTBs affected about 25 percent of nonfuel imports from LDCs compared to 21 percent of those from other DCs. Indeed, in the late 1980s, 80 percent of the exports of Bangladesh, one of the poorest countries in the world, were subject to DC nontariff barriers. The MFA, established in 1974 and made increasingly restrictive in 1978, 1982, and 1986, allowed bilateral agreements (often arising from economic pressures brought to bear by rich countries) and unilateral ceilings on any product category to limit “disruptive” textile and clothing imports (World Bank 1987:136–137; Carrington 1993:A10); under Uruguay Round agreements, MFA was phased out in 2005, expanding sales by China, previously under quota, or countries that signed multilateral agreements (for example, the U.S.’s African Growth and Opportunity Act, or AGOA, 2000–08, that provides duty-free access to apparel and other goods for 37 countries).
17. International Trade |
625 |
Since 1989, the U.S. Super 301 provision directed the president to penalize “unfair traders.” Under this authority, the United States threatened trade sanctions against Brazil for import licensing and India for foreign investment and insurance company restrictions. For Columbia University economist Jagdish Bhagwati (1992:A14), the U.S. threat represented “aggressive unilateralism.”
Trigger price mechanisms, such as the one the United States uses to prevent “unfair” price competition from steel imports, require foreign importers to pay antidumping duties on prices determined to be below domestic production cost. Subsidies, used widely by Norway, Belgium, France, and the United Kingdom, have the same protective effect as tariffs.
The WTO/GATT recognizes the sovereign right of members to impose new trade restrictions to counter dumping. The substantial increase in the incidence of antidumping rules from 1995 to 2002 has set back trade liberalization substantially (World Bank 2004b:84).
Since the early 1970s, the DCs have adopted a generalized system of tariff preferences (GSP), by which tariffs on selected imports from LDCs are lower than those offered to other countries. The GSP of the United States, established in 1976, grants dutyand quota-free access to eligible products and countries. The United States graduated the four Asian tigers (Taiwan, South Korea, Hong Kong, and Singapore) from GSP in 1989. Other countries not eligible include China, Malaysia, and countries deemed to have aided international terrorism or that do not comply with environmental, labor, and intellectual property standards (World Bank 2004b:213). Textiles, apparel, footwear, and many farm products are not eligible.
The United States provides more liberal preference for the Caribbean Trade Preference for 24 countries; the Andean Trade Preference for Bolivia, Colombia, Ecuador, and Peru to reduce drug production and trafficking; and the African Growth and Opportunity Act. AGOA provides duty-free and quota-free market access for virtually all products, including apparel made in African from U.S. yarn and fabric (ibid.).
The European Union’s GSP is available to all LDCs, including China. Thirty-six percent of tariff categories receive reduced tariffs and 32 percent are duty free (ibid.).
From 1975 to 2000, the Lome´ conventions implemented the European Union’s GSP toward as many as 70 African, Caribbean, and Pacific (ACP) countries. The conventions allowed freer access to the European Union for many ACP products, mechanisms for stabilizing foreign exchange earnings from certain commodities and minerals, and a channel for E.U. aid. In 2000, 78 ACP countries, including 41 leastdeveloped countries, signed the Cotonou agreement, under which trade benefits to the ACP were more generous than the GSP but more limited than Lome´. Ironically, the Uruguay Round, although beneficial to LDCs because of the lowered trade barriers against their exports, resulted in the displacement of African exports in E.U. markets by usually more affluent Asian competitors (Hertel, Masters, and Elbehri 1998: 208–236).
Preferences for LDCs have not been reliable, frequently have been removed, and have diverted exports from LDCs denied access. For example, when least-developed