

- •1.5.1 The Environment for Economic Decisions
- •2.3 Demand
- •2.4 Supply
- •2.5.1 Changes in Equilibrium
- •2.6.1 Price Ceiling
- •2.6.2 Price Floor
- •2.6.3 Problems of Price Ceilings and Floors
- •2.9.1 Labour Demand
- •2.9.2 Labour Supply: Individual Supply Decision
- •2.9.3 Equilibrium in the Labour Market
- •3.2.1 Consumption Goods
- •3.3.1 The Assumption of Rationality in Economics
- •3.4.1 The Law of Demand – Income and Substitution Effects
- •3.5.1 Consumer Surplus and Consumer Welfare
- •3.6.1 Price Elasticity of Demand
- •3.6.2 Applications of Elasticity Analysis
- •3.6.3 Other Elasticity Examples
- •3.7.1 The Attribute Model: Breakfast Cereals
- •4.3.1 Decisions of Firms and the Role of Time
- •4.3.2 Firm Revenue
- •4.3.3 Firm Output (Product): Marginal and Average Output
- •4.3.4 Firm Costs
- •4.3.5 Marginal and Average Costs
- •4.4.1 Profit Maximization, Normal Profit and Efficiency
- •4.4.2 Maximizing Profits Over the Short Run
- •4.8.1 Using Subsidies – An Example with International Trade
- •4.8.2 Environmental Taxes – Effects on Production
- •4.8.3 Tax Incidence
- •5.3.1 Explanations/Causes of Business Cycles
- •5.3.2 Implications for Business and Government
- •5.4.1 Other Measures of Economic Activity
- •5.4.2 Economic Activity: GNP, GDP and Income
- •5.5.1 The Price Level
- •5.5.2 Aggregate Demand
- •5.5.3 Aggregate Supply
- •5.5.4 Bringing AD and AS Together: The Short Run
- •5.7.1 Explaining Growing International Trade
- •5.7.2 Benefits and Costs of International Trade
- •5.8.1 Another Perspective on Economic Activity: The Economy as a Production Function
- •6.2.1 Competition as a Process
- •6.2.2 Entrepreneurship, Discovery and the Market Process
- •6.3.1 Perfect Competition
- •6.3.2 Monopoly
- •6.3.3 Perfect Competition vs. Monopoly
- •6.3.4 Monopolistic Competition
- •6.3.5 Oligopoly
- •6.5.1 Why Markets May Fail
- •6.5.2 Implications of Market Failure
- •6.6.1 Competition Spectrum
- •6.6.2 Structure, Conduct and Performance
- •6.6.3 Competition Policy
- •7.3.1 The Money Multiplier
- •7.5.1 Which Interest Rate?
- •7.5.2 Nominal and Real Interest Rates
- •7.7.1 Demand in the Foreign Exchange Market
- •7.7.2 Supply in the Foreign Exchange Market
- •7.7.3 Exchange Rate Determination
- •7.7.4 Causes of Changes in Exchange Rates
- •7.8.1 Investment in Bond Markets
- •7.8.2 Bonds, Inflation and Interest Rates
- •7.9.1 Difficulties in Targeting Money Supply
- •7.9.2 Alternative Targets
- •7.9.3 Taylor Rules and Economic Judgement
- •7.10.1 Considering the Euro
- •8.2.1 Labour Market Analysis: Types of Unemployment
- •8.2.2 Analysing Unemployment: Macro and Micro
- •8.2.3 Unemployment and the Recessionary Gap
- •8.2.4 The Costs of Unemployment
- •8.3.1 The Inflationary Gap
- •8.3.2 Trends in International Price Levels
- •8.3.3 Governments’ Contribution to Inflation
- •8.3.4 Anticipated and Unanticipated Inflation – the Costs
- •8.4.1 A Model Explaining the Natural Rate of Unemployment
- •8.4.2 Causes of Differences in Natural Rates of Unemployment
- •8.5.1 Employment Legislation
- •9.2.1 The Dependency Ratio
- •9.4.1 More on Savings
- •9.4.2 The Solow Model and Changes in Labour Input
- •9.4.3 The Solow Model and Changes in Technology
- •9.4.4 Explaining Growth: Labour, Capital and Technology
- •9.4.5 Conclusions from the Solow Model
- •9.4.6 Endogenous Growth

D E V E L O P I N G T H E E C O N O M I C S Y S T E M |
345 |
2.The amount of capital in use.
3.The marginal product of labour.
4.The amount of labour in use
5.Total factor productivity – a measure of the efficiency with which inputs are employed to produce output. TFP is a catch-all term that measures the effect on output not only of any changes in technology, but also in the social and political systems that affect the quantity and quality of output that an economy can produce from its labour and capital resources. TFP is effectively that portion of output change that cannot be accounted for by changes in the quantity and quality of labour and capital.
Any change in output not accounted for by changes in capital accumulation or changes in labour input is called total factor productivity (TFP). It is also known as the Solow residual – growth left unexplained after inputs have been accounted for.
The extent to which differences in the quality and quantity of inputs explain differences in productivity across countries is shown in Table 9.5. The first column indicates each country’s labour productivity expressed as a percentage of that of the United States. The other columns present counterfactual analysis, best interpreted by taking an example. Australia’s output was measured as 83% of that of the USA. If Australia’s labour and TFP were the same as in the USA, with capital being the only different factor, its labour productivity would have been 109% of that in the USA. This implies greater relative capital productivity in Australia but since its output is less than the USA, differences in its other input (labour) and/or TFP reduce its overall relative productivity performance.
9.4.5CONCLUSIONS FROM THE SOLOW MODEL
•The level of output is determined by the amount of capital in an economy, given labour and technology. This supports the general observation that countries with substantial capital investments (per worker) have relatively high levels of output and productivity.
•The long-run equilibrium level of output and capital depends on the savings rate of an economy. In equilibrium the level of capital (and output) is constant. Investment is sufficient to cover depreciation and any growth in the labour force. International evidence indicates high correlations between savings rates and living standards (e.g. Summers and Heston, 1991).
•An increased savings rate leads to a new equilibrium with higher capital investment and higher output level. A higher savings rate leads to economic growth temporarily until the new equilibrium is reached.

346 |
T H E E C O N O M I C S Y S T E M |
T A B L E 9 . 5 S O U R C E S O F I N T E R N A T I O N A L P R O D U C T I V I T Y D I F F E R E N C E S
|
Output per worker |
|
|
|
Country |
as % of US output |
Capital |
Labour |
TFP |
|
|
|
|
|
Australia |
83 |
109 |
90 |
86 |
Austria |
71 |
108 |
67 |
98 |
Belgium |
84 |
102 |
84 |
98 |
Canada |
94 |
100 |
91 |
103 |
China |
6 |
89 |
63 |
11 |
Czechoslovakia |
21 |
115 |
76 |
24 |
Denmark |
69 |
108 |
91 |
71 |
Finland |
73 |
120 |
86 |
73 |
France |
82 |
109 |
67 |
113 |
Germany (west) |
82 |
112 |
80 |
91 |
Greece |
47 |
102 |
68 |
67 |
Hungary |
31 |
112 |
93 |
29 |
India |
9 |
71 |
45 |
27 |
Ireland |
58 |
105 |
77 |
71 |
Italy |
83 |
106 |
65 |
121 |
Japan |
59 |
112 |
80 |
66 |
Korea |
38 |
86 |
76 |
58 |
Netherlands |
81 |
106 |
80 |
95 |
New Zealand |
72 |
112 |
102 |
63 |
Norway |
76 |
120 |
91 |
70 |
Portugal |
37 |
96 |
50 |
76 |
Spain |
68 |
102 |
61 |
111 |
Sweden |
79 |
103 |
85 |
90 |
Switzerland |
87 |
119 |
83 |
88 |
United Kingdom |
73 |
89 |
81 |
101 |
Source: Excerpted from ‘Data Appendix’ for Hall and Jones (1999).

D E V E L O P I N G T H E E C O N O M I C S Y S T E M |
347 |
Hence, high savings rates do not generate persistent economic growth.
•Growth in the population or labour force matters for living standards. With a growing labour force, ceteris paribus, labour productivity falls. Correlations indicate that countries with fast rates of population growth experience relatively lower levels of living standards.
•In the steady state, growth can only occur via TFP changes.
The Solow model does not deal with causes of technology improvement since technology is exogenous or not explained within the growth model itself. We can allow technology to become an endogenous factor and such endogenous growth models are considered in section 9.4.6, which follows.
The conclusions do not help us understand why some countries do not experience convergence of income levels. We need to look elsewhere to understand this phenomenon. Nor do we have an indication of welfare implications of economic growth, which is also examined in section 9.5.
9.4.6ENDOGENOUS GROWTH
Endogenous or new growth models essentially try to explain how and why changes in technology occur. Technology is not assumed to be unchanging and the result of things occurring outside the models. Some endogenous growth models discard the assumption of diminishing marginal product of capital so that a change in capital leads to a constant proportional increase in output irrespective of the initial level of capital stock. This implies a rising but linear production function, as shown in Figure 9.7. This means that every one-unit increase in the capital stock increases output by the same amount, irrespective of an economy’s initial level of capital stock.
Adding our assumption about savings being a constant proportion of output, we draw a corresponding savings function, which is also linear. By further including the depreciation line, we complete the essential elements of the model. By definition the steady state occurs where there is no tendency to change from one level of the capital stock. But in Figure 9.7 no such point exists. Investment lies above depreciation indicating that the level of capital stock can rise indefinitely without any technological change, allowing output to rise also.
Another interesting result from the model occurs with an increase in the savings function. If people’s savings behaviour changes so that savings increase and the savings function moves up, the result is an increase in the economy’s stock of capital and in its rate of output growth – the production function also moves up indicating

348 |
T H E E C O N O M I C S Y S T E M |
Output |
|
PPF |
|
|
|||
|
|
|
Savings |
|
|
|
Depreciation |
|
|
|
Capital: K |
|
|
|
|
F I G U R E 9 . 7 P R O D U C T I O N F U N C T I O N W I T H C O N S T A N T M A R G I N A L P R O D U C T
a positive link between savings and a permanent rise in output growth (a new steeper slope of the new PPF indicates a change in the rate of growth).
A key issue arises as to the credibility of assuming a constant marginal product of capital. This may be possible if we allow investment to have an impact on the quality of labour, and vice versa. The greater the amount of physical capital (buildings, equipment, machines, etc.) in an economy, the greater the output that human capital (skills, education, etc.) can produce and the higher the return on further investment to improving education and skills to maximize the productivity of physical capital. Each separate component of capital may exhibit diminishing marginal product but in combination, they could give rise to a constant marginal product of combined, or total, capital. Poorer countries with not only low levels of physical capital, but also of human capital, face a double disadvantage in trying to catch up. Not only is investment in physical capital required but spending on training and education is also required and by its nature the return on such investments takes years to yield rewards. Many poorer countries with very limited budgets do not have the luxury of spending in the hope of generating future growth as the opportunity cost of such spending is considered too high. What is important for long-term growth is subordinated to urgent expenditures required today.
Growth benefits from investment may go beyond individual firms who undertake the investment indicating that diminishing returns to capital may be relevant for a firm but not for society overall. Consider the effect on economic growth of a utility company investing in providing broadband technology. The provider will decide to invest in the broadband technology taking account of its own costs and potential revenues. The provision of broadband technology, however, can increase output and productivity of those firms that adopt it allowing them to increase their

D E V E L O P I N G T H E E C O N O M I C S Y S T E M |
349 |
output for a set amount of inputs. The social benefit may outweigh the private benefit and create constant or even increasing returns to capital investment for the economy.
The potential for such a scenario creates challenges for government and whether or not it should try to encourage capital investments by private firms that generate economy-wide benefits. Private firms usually do not take social benefits into account in their investment decisions (and consider only their private costs and benefits) so maybe government should subsidize investments that give rise to broader economywide benefits? This sounds somewhat logical. Yet investment by firms is often in new products and innovations that can be quite costly and often very risky. Innovation that underlies many technological improvements is based on research and development, which does not have a certain outcome. Governments will not be able to correctly gauge which investments will yield positive economic results no more than firms themselves can so it will be a guessing game to decide on how much support to provide for investment purposes. Many examples exist of such supports via favourable treatment of savings, investment, or the provision of R&D tax incentives or tax credits.
A generally sound economic system organized around markets and firms where people enjoy property rights that are supported by law, where money fulfils its main functions, where modern infrastructure is provided (publicly and/or privately), and where people are free to buy, sell and invest as they choose usually provides an environment that facilitates growth. The extent to which governments facilitate such an environment may be even more important in the context of growth than the funding they might provide in support of research and development.
9 . 5 I N C O M E D I S T R I B U T I O N
Information on economic growth provides a partial perspective on living standards across countries because it is an average measure. The living standards of some people in an economy lie above the average while that of others lie below it so that real income is not divided up equally across the population.
How real income is divided up both internationally and within countries is an issue of interest from a welfare perspective. Are citizens actually better off if their average national living standards rise? Arguably, you need to examine income distribution as well as living standards in order to get a more comprehensive and

350 |
T H E E C O N O M I C S Y S T E M |
accurate indication of if and how economies develop and to identify the trend in living standards for the majority of the population. For example, in a country of 5 million people, consider what happens if the income of the richest quarter of the population increased by £5m while the income of the least-well-off quarter fell by £2.5m (all in real terms). Although total real income and average income per capita have undoubtedly risen it does not automatically follow that the society overall is ‘better off’ because in this example the gap between rich and poor widens. It’s a matter of being clear on how economic growth is measured and on what it actually means. Rising average living standards do not necessarily mean that the welfare of all, a majority or even the worst-off citizens in an economy improves.
The extent to which income is shared depends on where – and by whom – the factors of production (land, labour, capital, entrepreneurship, etc.) are held in an economy. If the factors are concentrated in the hands of a small number of individuals (or in a particular region), these individuals (or their region) will be disproportionately wealthier than the vast majority of their fellow citizens (or other regions). Within countries, policies (e.g. tax) are often used by governments to redistribute income to increase some people’s consumption possibilities beyond those provided by their income, in an attempt to close the income distribution gap. The extent to which countries consider this as an issue to be addressed is revealed by their actions and related policies. Addressing income inequality between rather than within countries is somewhat more complicated since it requires international cooperation and formal agreement.
Information in Table 9.6 indicates the extent to which income was distributed internationally over the last 40 years relative to world population. It indicates that the developing world (all countries except industrialized countries and Eastern Europe) increased its share of the world population from 71% to 81% since 1960 and also its share of world income from 29% in 1960 to 42% in 2000.
While on the basis of Table 9.6 it appears that income is better shared internationally in 2000, income remains concentrated in the countries that make up less than 20% of the world’s population. Since the table does not deal with withincountry income distribution, we cannot say whether inequality has changed within any country.
Many people and NGOs (non-governmental organizations) disagree with the international income distribution and attempt to change it through supporting programmes for economic development and cancelling debt repayments for the poorest countries. Clearly, much still remains to be done to bring about a more equitable or fairer international income distribution.

D E V E L O P I N G T H E E C O N O M I C S Y S T E M |
351 |
T A B L E 9 . 6 I N T E R N A T I O N A L I N C O M E A N D
P O P U L A T I O N S H A R E S
|
1960 |
|
1980 |
|
2000 |
|
||
Region |
Incomea |
Pop. |
|
Income |
Pop. |
|
Income |
Pop. |
Developing world |
29 |
71 |
33 |
79 |
42 |
81 |
||
of which China and India |
8 |
36 |
7 |
39 |
17 |
38 |
||
Developed world |
71 |
29 |
67 |
21 |
58 |
19 |
||
Total |
100 |
100 |
100 |
100 |
100 |
100 |
||
Source: Adapted from Tables 2.2 and 2.3 in Bhalla (2002).
a Income is estimated as GDP in PPP terms based to 1993, provided by the World Bank.
Equity in terms of income distribution is an example of vertical equity whereby people with intrinsically different characteristics (education, experience, abilities) would be treated differently in order to reduce the disparate income resulting from their differences.
Horizontal equity is a related concept but refers to treating identical people in an identical manner (i.e. not discriminating based on gender or race between individuals who are economically identical and can perform similar tasks).
In developed countries, laws and practice appear generally to attempt to achieve horizontal equity. The extent to which countries attempt to achieve vertical equity is more varied, depending on political ideology, preferences and culture.
9.5.1INTRA-COUNTRY INCOME DISTRIBUTION
Measurements of income of the richest and poorest proportions of a population are used to estimate inequality and allow us to consider the extent to which income has been distributed more or less equitably within countries over time. From Table 9.7 it appears that over the last 40 years income inequality within countries has not substantially changed or improved.
Contrary to the data in Table 9.7, Sala-i-Martin (2002) found that global income inequalities fell over the 1980s and 1990s. But in further research published in 2002, Milanovic estimated that the richest 1% of the world population received as much as the world’s poorest 57% . He also found that the ratio between the average

352 |
T H E E C O N O M I C S Y S T E M |
T A B L E 9 . 7 I N T E R N A T I O N A L I N C O M E D I S T R I B U T I O N W I T H I N C O U N T R I E S
|
Incomea of poorest 20% |
|
Incomea of richest 20% |
||||
Country |
1960 |
1980 |
2000 |
1960 |
1980 |
2000 |
|
|
|
|
|
|
|
|
|
Austria |
6.8 |
6.6 |
10.4 |
36.6 |
38.3 |
33.4 |
|
Belgium |
7.9 |
7.9 |
9.5 |
36.1 |
36.1 |
34.5 |
|
China |
7.9 |
7.9 |
5.9 |
36.7 |
36.7 |
46.6 |
|
Czech Republic |
8.2 |
11.4 |
10.2 |
35.1 |
32.1 |
36.4 |
|
Denmark |
5.0 |
7.0 |
6.4 |
41.2 |
38.0 |
39.5 |
|
Estonia |
10.0 |
10.0 |
7.0 |
32.7 |
32.7 |
45.1 |
|
Finland |
2.4 |
6.6 |
10.6 |
49.3 |
40.0 |
33.6 |
|
France |
1.9 |
8.3 |
7.2 |
53.7 |
38.5 |
40.2 |
|
Germany |
10.5 |
6.6 |
8.2 |
37.7 |
39.0 |
38.4 |
|
Greece |
6.4 |
6.4 |
6.2 |
41.7 |
41.7 |
41.2 |
|
Hungary |
9.2 |
10.8 |
9.9 |
34.8 |
32.4 |
34.5 |
|
India |
8.4 |
8.5 |
8.7 |
41.4 |
40.9 |
41.8 |
|
Ireland |
4.8 |
4.9 |
6.7 |
42.2 |
43.6 |
42.9 |
|
Italy |
7.0 |
7.9 |
8.7 |
42.0 |
39.1 |
36.3 |
|
Japan |
5.3 |
6.3 |
10.6 |
45.1 |
39.6 |
35.6 |
|
Latvia |
10.4 |
10.4 |
7.5 |
32.8 |
32.8 |
40.4 |
|
Lithuania |
10.6 |
10.6 |
6.7 |
32.9 |
32.9 |
41.7 |
|
Luxembourg |
10.2 |
10.2 |
9.4 |
34.0 |
34.0 |
36.5 |
|
Netherlands |
4.0 |
8.4 |
7.3 |
48.4 |
36.7 |
40.0 |
|
Poland |
9.5 |
9.8 |
7.8 |
35.2 |
34.5 |
40.1 |
|
Portugal |
5.8 |
5.5 |
7.3 |
46.3 |
42.5 |
43.4 |
|
Slovakia |
10.4 |
10.4 |
9.3 |
34.2 |
34.2 |
38.6 |
|
Slovenia |
10.1 |
10.1 |
9.1 |
36.1 |
36.1 |
37.7 |
|
Spain |
8.2 |
8.2 |
10.2 |
35.1 |
35.1 |
33.1 |
|
Sweden |
4.4 |
7.0 |
9.6 |
44.0 |
39.5 |
34.6 |
|
(continued overleaf )

D E V E L O P I N G T H E E C O N O M I C S Y S T E M |
353 |
T A B L E 9 . 7 ( c o n t i n u e d )
|
Incomea of poorest 20% |
|
Incomea of richest 20% |
||||
Country |
1960 |
1980 |
2000 |
1960 |
1980 |
2000 |
|
|
|
|
|
|
|
|
|
United Kingdom |
9.4 |
10.2 |
6.6 |
36.9 |
37.6 |
42.9 |
|
United States |
4.8 |
4.3 |
3.6 |
41.3 |
43.6 |
49.4 |
|
Average: Table Total |
7 |
8 |
8 |
39 |
37 |
39 |
|
Average East Europe |
10 |
10 |
8 |
34 |
33 |
39 |
|
Average China/India |
8 |
8 |
7 |
39 |
39 |
44 |
|
Average Others |
6 |
7 |
8 |
42 |
39 |
39 |
|
Source: Excerpted from Appendix Table C.1 in Bhalla (2002).
a Income is income per capita based on survey data measured as GDP in PPP terms based to 1993.
income of the top 5% in the world to the bottom 5% increased from 78 to 1 in 1988 to 114 to 1 in 1993 indicating greater inequality. So what is the correct welfare interpretation of these disparate data? It is a hotly debated issue, as shown by the discussion at www.foreignaffairs.org and an interesting article in The Economist of 11 March 2004 entitled ‘More or less equal?’.
The Milanovic results are based on household survey data (rather than national income data) which are considered to provide more reliable estimates of income that people actually earn and, hence, more reliable estimates of poverty and inequality. The data period is quite short, however, and probably does not allow for a fair comparison with Sala-i-Martin’s research. Milanovic’s finding that inequality increased between 1988 and 1993 due to slower income growth in highly populated Asian countries relative to richer OECD countries also changes if a longer period is examined. Because almost 40% of the world’s population live in China or India, the impact of strong economic growth in both has a considerable impact on measures of inequality that focus on average incomes in these countries (see how these countries fared in Table 9.1). However, again from a welfare perspective, some economists argue that if inequality within China is considered then there are widening urban–rural income disparities emerging there. Further difficulties arise in assessing the equality question depending on whether exchange rates or purchasing power parity data are used.
Disagreement among economists in the equality debate is more than just an academic exercise. Many critics of capitalism argue that widening inequality is
354 |
T H E E C O N O M I C S Y S T E M |
simply a reflection of the problems inherent in the capitalist system of order and organization. The above data are not especially helpful in this debate since world income distribution has improved while individual country inequality remains.
Irrespective of the debate around rising or falling inequality a renowned Indian economist and Nobel laureate for Economics, 1998, Amartya Sen, considers that the sheer scale of world poverty is still too high, with the concentration of over 80% of world income in the hands of the wealthiest 20% of the world’s population. He argues for greater focus on addressing this central issue. Fortunately, there appears to be agreement among several different researchers that the proportion of the world’s population living on less than a dollar a day (a standard poverty measure) has fallen sufficiently over the 1980s and 1990s to offset rising population in developing countries (see Table 9.5). The United Nations goal (announced in its millennium development goals) to reduce the number of people living on less than a dollar a day in 1990 by half by the year 2015 has, they have claimed, been achieved already. Not everyone, however, agrees with these findings and the debate goes on.
Evidence on convergence?
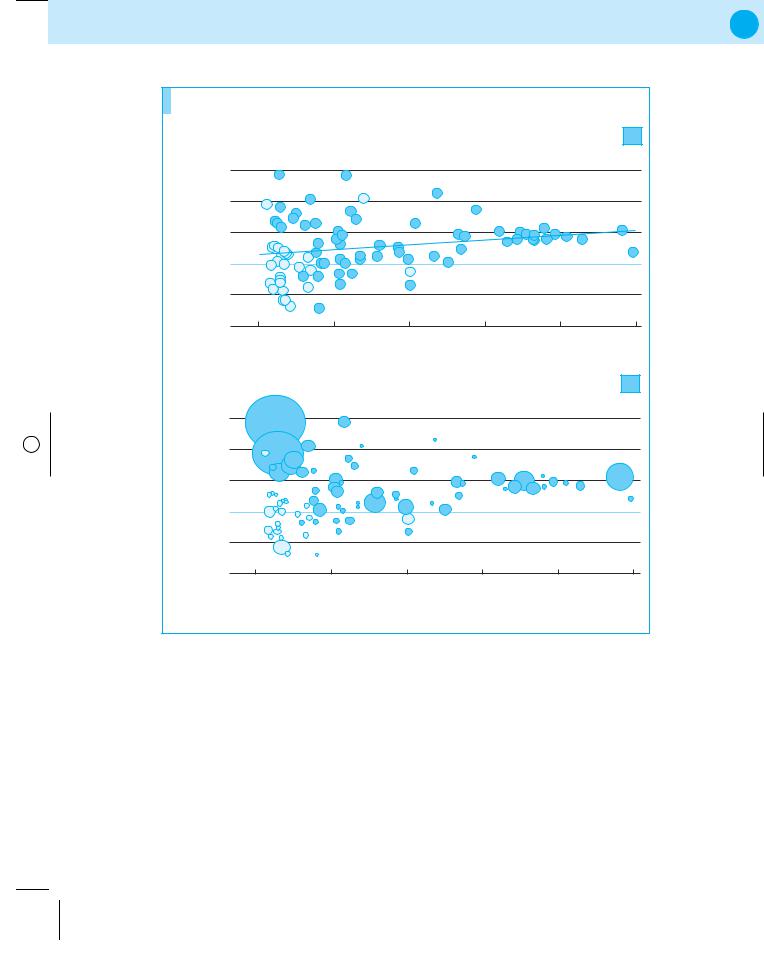
And what of the convergence debate? Have poor countries (those with low living standards) enjoyed higher growth than rich countries? This is another substantial research area in economics yielding disparate results depending on definition and measurement. In considering this question Fischer (2003) illustrated that if you graph countries’ levels of living standards in 1980 and their growth until 2000, there is no evidence of convergence. The upward sloping trendline in panel 1 of Figure 9.8 indicates that countries with lower income (in 1980) grew more slowly than countries with higher income (in 1980). He also showed that if you plot each country taking into accounts its share of the world’s population – thereby allowing consideration of the number of people in the poorest countries rather than simply the poorest countries – you observe convergence since the poorest are catching up in terms of living standards.
Many countries, however, still lack the political, social and economic structures required to allow them to reorganize as required to benefit from the convergence potential.
Trade and development
In the context of the discussion of developing countries, it is also worth noting that both the United States and European Union maintain trade restrictions that harm developing countries by limiting their ability to export goods. Through the WTO (and its predecessor the General Agreement on Tariffs and Trade)
D E V E L O P I N G T H E E C O N O M I C S Y S T E M |
355 |
|
An alternative view |
|
|
|
||
|
Growth in GDP per head |
|
|
|
||
|
|
6 |
|
|
|
|
head |
|
4 |
|
|
|
|
per |
pa |
|
|
|
|
|
realinGrowthGDP |
1980–2000,% |
2 |
|
|
|
|
+ |
|
|
|
|
||
|
|
|
|
|
|
|
|
|
0 |
|
|
|
|
|
|
– |
|
|
|
|
|
|
2 |
|
|
|
|
|
|
4 |
0 |
5 |
10 |
15 |
|
|
|
||||
|
|
|
|
|
GDP per head 1980*, $’000 |
|
|
Growth in GDP per head, proportional to population in 1980 |
|||||
headper |
|
6 |
China |
|
|
|
pa |
4 |
India |
|
|
|
|
|
|
|
|
|
||
|
|
|
|
|
|
|
Growthin real GDP |
1980–2000, % |
2 |
|
|
|
|
+ |
|
|
|
|
||
4 |
|
|
|
|
||
|
|
0 |
|
|
|
|
|
|
– |
|
|
|
|
|
|
2 |
|
|
|
|
|
|
|
0 |
5 |
10 |
15 |
|
|
|
|
|
GDP per head 1980*, $’000 |
|
Sources: Penn World Table: Stanley Fischer.
 Sub-Saharan Africa
1
20 |
25 |
2
USA
20 |
25 |
*1996 prices
F I G U R E 9 . 8 C O N V E R G E N C E F O C U S I N G O N P O P U L A T I O N
Source: The Economist Newspaper Limited, London (11 March 2004).
improvements have been attempted but reform has been promised for many years without substantial results. It is still the case that average tariff levels in agriculture (predominantly exported by developing countries) are about nine times those in manufacturing. Industrial countries subsidize agriculture, effectively cutting world prices because of the supply incentive subsidies create for farmers in industrialized countries.

356 |
T H E E C O N O M I C S Y S T E M |
Not only does the EU spend around £2.7 bn per year to make sugar profitable for European farmers but it also shuts out low-cost imports of tropical sugar through trade barriers.
Minimizing or overlooking the negative microeconomic effects of trade is a problem with many free-trade advocates. It may well make the free-trade argument more palatable and popular if these issues are dealt with explicitly. In this context the link between the arguments for free trade and for greater focus on national income distribution appear quite close. Both relate to normative judgements on the fairness and equity of the economic repercussions on the least well off of economic measures that may well favour an economy overall and maybe even the majority of its citizens. Economic models showing the welfare improvements to an average or representative citizen hold little weight for those interested in costs borne by minority groups who are not adequately compensated for their losses.
9 . 6 S U M M A R Y
•Economies undergo transformations as they change and develop. The pace and extent to which real output expands is one measure used to assess economic growth. A broader measure is the human development index of the United Nations.
•Living standards indicate the average output of an economy per person. Trends in living standards are directly related to and affected by trends in labour productivity but the two do not necessarily move together.
•The Solow growth model provides a useful framework for considering the main causes of economic growth using a production function approach.
•Persistent growth cannot be explained by investment/savings behaviour. Improvements in technology can explain persistent growth.
•Technology improvement is a more important source of growth than increased capital for more industrialized countries, ceteris paribus.
•In the steady state, growth can only occur via total factor productivity changes.
•Endogenous growth models provide explanations as to why and how changes in technology occur.

D E V E L O P I N G T H E E C O N O M I C S Y S T E M |
357 |
•How real income is distributed both internationally and within countries is an issue of interest from welfare and equity perspectives.
•Some improvement in international income distribution has occurred in the last 40 years with little change in national income distribution
•Depending on definition, there is some evidence of international convergence in living standards.
•Internationally trade has been growing faster than production, creating opportunities and generating threats in terms of economic growth, development and restructuring.
•Focusing on the effects on those worst affected by economic developments (be it trade, growth, etc.) and how they might best be addressed would enhance understanding and functioning of the economic system.
R E V I E W P R O B L E M S A N D Q U E S T I O N S
1.For each of four countries, draw a graph showing both its living standards and productivity. Compare the trends across the two measures in terms of their similarities and dissimilarities. Can you explain their similarities or dissimilarities over time?
2.Draw a production function. What assumptions are made when drawing the production function? Explain why at low levels of capital stock a rise of £100m in the capital stock has a larger effect on output than at relatively higher levels of capital stock.
3.Draw a production function.
(a)Add a savings = investment function. Explain why the savings = investment function has a similar shape to the production function you have drawn.
(b)Add a depreciation function. Explain why the depreciation function has a dissimilar shape to the production function you have drawn.
(c)Use your diagram to explain how the equilibrium output and capital stock are determined.
4.You are given the following information about an economy:
number of workers = 8 million
average productivity = £124 000 per annum.
(a)Compute the value of output of the economy for the year in question.
(b)Explain what might happen to:
•total output;
•productivity;

358 |
T H E E C O N O M I C S Y S T E M |
if 50 000 migrant workers found work in the economy with no change to
the capital stock.
(c)If you were told that average productivity in the following year changed to £135 000, how would you explain this outcome?
5.What is total factor productivity and how might it be measured? For four countries in Table 9.5 explain whether labour, capital or TFP explains the country’s productivity differential with the USA.
6.Explain the central difference between the Solow growth model and endogenous growth models. Draw a production function that assumes endogenous growth and explain how and why it differs from the standard production function you have drawn for earlier answers.
7.What questions and issues can be analysed by considering
(a)the international distribution of income?
(b)national distributions of income?
8.What factors, in your opinion, explain recent trends in
•
•
the international distribution of income?
the national distribution of income?
(Refer to any three countries in Table 9.7 to answer this question).
F U R T H E R R E A D I N G A N D R E S E A R C H
•For more on the Japanese model of economic growth and development take a look at Porter et al., 2000.
•For the original articles providing apparently opposing evidence on inequality see Sala-i-Martin, 2002; Milanovic, 2002.
•For comprehensive and topical analysis of growth and inequality see Bhalla, 2002.
•For Sen’s perspective on economic development see Sen, 1999.
R E F E R E N C E S
Bhalla, S. (2002) Imagine There’s No Country. Institute for International Economics,
Washington.
Cato Online Policy Report (1998), 20(2) March/April, at http://www.cato.org/pubs/
policy report/cpr-20n2-6.html

D E V E L O P I N G T H E E C O N O M I C S Y S T E M |
359 |
Fischer, S. (2003) ‘Globalisation and its challenges’, American Economic Association Papers and Proceedings, American Economic Review, 93(2), 1–30, May.
Hall, E. and C. Jones (1999) Why do some countries produce so much more output per worker than others? Quarterly Journal of Economics, 114(1), 83–116. Data Appendix as it appears on the link from Hall’s website at www.stanford.edu/
rehall/CV.htm
Heston, A., R. Summers and B. Aten (2002) Penn World Table Version 6.1. Centre for International Comparisons at the University of Pennsylvania (CICUP), October.
Kennedy, K. (2001), ‘Reflections on the process of Irish economic growth’, Journal of the Statistical and Social Inquiry Society of Ireland, 30, read before the Society on 26 April 2001.
Milanovic, B. (2002) ‘True world income distribution 1988 and 1993: first calculation based on household surveys alone’, Economic Journal, 112, 51–92, January.
OECD (2002) Economic Outlook, Annex Table 24, December (www.oecd.org). Porter, M., M. Sakakibara and H. Takeuchi (2000) Can Japan Compete? Macmillan. Sala-i-Martin, X. (2002) ‘The disturbing ‘‘rise’’ of global inequality’, National Bureau
for Economic Research Working Paper 8904, April.
Sen, A. (1999) Development as Freedom. Oxford University Press, Oxford.
Summers, R and A. Heston (1991) ‘An expanded set of international comparisons 1950–1988’, Quarterly Journal of Economics, 327–368, May, Supplement (Mark 5.6) to the Penn World Table (Mark 5).
United Nations (2002) World Population Ageing, 1950–2050. Population Division of the United Nations, Dept of Economic and Social Affairs.
United Nations (2003) Trends in Europe and North America, The Statistical Yearbook of the Economic Commission for Europe. United Nations Economic Commission for Europe (available online in the Demographic Database of the Population Activities Unit (PAU-DB) at http://w3.unece.org/stat/pau.asp).
Weisbrot, M., R. Naiman and J. Kim (2000), ‘The emperor has no growth: declining economic growth rates in the era of globalization’, Centre for Economic and Policy Research, Briefing Paper.

G L O S S A R Y
Absolute advantage |
When a product is produced more efficiently (using less |
|
resources) in one country, that country has an absolute |
|
advantage in that product. It is measured by comparing |
|
relative output across countries. See also |
|
comparative advantage. |
Aggregate demand |
The demand for output (of all goods and services) at |
(AD) |
different price levels. |
Aggregate |
See national economic activity. |
economic activity |
|
Aggregate |
Indicates total planned expenditure in an economy for |
expenditure |
different levels of income or output (denoted Y ). |
function |
|
Aggregate supply |
The amount of output firms are willing to supply at |
(AS) |
different price levels. |
Anticipated |
Expected inflation that is taken into account in economic |
inflation |
decision-making. See also unanticipated inflation. |
Appreciation |
The increase in value of an asset over time. An |
|
appreciation of sterling occurs when £1 buys more |
|
foreign currency today than it did yesterday (when it costs |
|
more in terms of foreign currency to buy £1). See also |
|
depreciation. |
Arbitrage |
The possibility of buying an asset in one market and |
|
selling it at a higher price in another market. |
Arc price elasticity |
A method for estimating elasticity of demand, based upon |
of demand (arc |
average price and average quantity demanded. It is |
PED) |
calculated as follows: |
Qd |
× |
|
1/2[P 1 |
+ P 2] |
||
|
P |
1 |
/ |
2[Qd1 |
+ Qd2] |
|
|
|
|
||||

362 |
T H E E C O N O M I C S Y S T E M |
|
It is most appropriately used for large price changes. |
|||||||
Arc price elasticity |
A method for estimating elasticity of supply, based upon |
|||||||
of supply (arc PES) |
average price and average quantity supplied. It is |
|||||||
|
calculated as follows: |
|||||||
|
|
QS |
× |
|
1/2[P 1 + P 2] |
|
||
|
|
P |
|
/ |
2[QS1 + QS2] |
|||
|
|
|
1 |
|
||||
Asymmetric shocks |
Economic shocks that affect one economy or a part of |
|||||||
|
one economy more than other economies or other parts |
|||||||
|
of an economy. |
|
|
|||||
Automatic |
Measures that automatically counter the business cycle |
|||||||
stabilizers |
without government action. They result in reducing the |
|||||||
|
response of GDP to changes in autonomous spending. |
|||||||
Autonomous |
Consumption expenditure that is independent of the |
|||||||
consumption |
level of income. It occurs if people borrow to buy |
|||||||
|
consumption goods or if they spend their savings (or |
|||||||
|
borrow) when they have no income to pay for |
|||||||
|
consumption goods. |
|||||||
Average cost (AC) |
Total costs per unit of output. AC is computed as total |
|||||||
|
costs divided by output (TC/Q ). |
|||||||
Average product of |
Total output divided by the number of workers: Q /L. |
|||||||
labour |
|
|
|
|
|
|
|
|
Average total cost |
Average variable cost (AVC) plus average fixed cost |
|||||||
(ATC) |
(AFC): ATC = AVC + AFC. |
|||||||
Balance of |
A country’s national account which includes transactions |
|||||||
payments |
between domestic residents and the rest of the world over |
|||||||
|
a specified period. It consists of a current account and a |
|||||||
|
capital account. |
|
|
|||||
Barriers to entry |
Exist when new firms cannot freely enter and compete in |
|||||||
|
a market. With no barriers, all firms competing in the |
|||||||
|
same market would have access to similar technology |
|||||||
|
allowing them to have similar cost structures. |
|||||||

G L O S S A R Y |
363 |
Bond |
Represents an agreement between two parties in a |
|
transaction where one party lends money to the other for |
|
an agreed rate of interest (usually) over a specified period |
|
and where the lender receives back the total value of their |
|
investment when the bond matures. |
Business cycles |
The tendency for real output to rise and fall over time in |
|
a reasonably regular pattern. |
Capital |
A factor of production that has been produced (e.g. |
|
machines, factories, tools) and is used with labour to |
|
produce and/or market more goods and services. |
Capital account |
A country’s national account which tracks transactions |
|
relating to ownership of financial assets, including inward |
|
and outward direct investment. See also current account, |
|
balance of payments. |
Capital deepening |
Where the capital stock increases faster than the labour |
|
force so that the amount of capital per worker rises. See |
|
also capital widening. |
Capital intensity |
The amount of capital each worker in the economy (on |
|
average) has at their disposal. |
Capital widening |
Where the capital stock increases at the same rate as the |
|
labour force and covers depreciation. See also |
|
capital deepening. |
Cartel |
An agreement between firms to co-operate in restricting |
|
the amount of output they produce, for example, thereby |
|
influencing the price. |
Cash markets |
See spot or cash markets. |
Central bank |
Usually implies that a government has no direct input |
independence |
into the economic decisions taken by the central bank |
|
regarding money supply, interest rates and inflation. |
Ceteris paribus |
From the Latin, meaning all things being equal or |
assumption |
unchanged. An assumption that allows economists to |
|
construct models that highlight the fundamental nature |

364 |
T H E E C O N O M I C S Y S T E M |
|
of a relationship they are trying to describe and |
|
understand. Subsequently they use their models to |
|
incorporate other factors of most relevance to that |
|
relationship. |
Circular flow |
The way in which products, services, resources and money |
|
flow around the economic system. |
Commodity |
An undifferentiated product such as wheat or oil or |
|
computer memory chips. Commodities are usually of |
|
uniform quality, often produced by many different |
|
producers where each producer’s output is considered |
|
equivalent or interchangeable. Futures markets exist for |
|
many commodity products. |
Comparative |
When output is produced at a lower opportunity cost in |
advantage |
one country, that country has a comparative advantage in |
|
production. It is measured by comparing relative |
|
opportunity costs between countries. See also |
|
absolute advantage. |
Competitiveness |
A range of factors from measures of income and |
|
prosperity to economic creativity and innovative ability |
|
that describe the performance of one economy relative |
|
to others. |
Concentration ratio |
Measures the market share of the biggest firms in the |
|
market. For example a CR4 calculates the market share of |
|
the leading four firms. |
Concepts, theories |
Simplified representations of phenomena, which are |
and models |
intended to serve as tools to aid thinking about complex |
|
entities or processes. |
Consumer |
The degree of optimism that consumers express (in |
confidence |
surveys, for example) about the state of their economy |
|
through their saving and spending patterns and plans. |
Consumer surplus |
The benefit to consumers due to the difference between |
|
what consumers actually pay to consume a good and what |
|
they would have been willing to pay. |
G L O S S A R Y |
365 |
Contestable |
Markets where entry costs and exit costs from markets |
markets |
are low. |
Contractionary |
A fiscal policy that results in lower activity and a reduction |
fiscal policy |
in the circular flow of income. See also expansionary |
|
fiscal policy. |
Convergence |
The tendency for poorer countries to grow faster than |
|
richer countries for a given increase in capital stock. |
|
Hence, poorer countries would be expected to catch up |
|
with richer countries if the countries share similar |
|
steady states. |
Cost-push inflation |
Caused by firms reacting to increased costs by reducing |
|
their output. |
Costs of inflation |
These are: loss of purchasing power, shoe-leather costs, |
|
menu costs, effects on income distribution, fiscal drag, |
|
effects on international competitiveness, effects on |
|
balance of payments and business uncertainty and lack |
|
of stability. |
Countercyclical |
Policies which have the opposite effect on economic |
fiscal policy |
activity to that caused by the business cycle, reducing |
|
income flows during booms, increasing income flows |
|
in recessions. |
Cross price |
Indicates the responsiveness of the quantity demanded of |
elasticity |
one good (good A) when the price of another good |
|
(good B) changes. It is computed as % Q dA/% P B . |
Current account |
A country’s national account which includes all trade |
|
transactions where the balance of trade might be in |
|
surplus or deficit. It also includes all income and current |
|
transfers. See also capital account, balance of payments. |
Cyclical |
Unemployment associated with the recessionary phase of |
unemployment |
the business cycle. |
Cyclically adjusted |
Provides information about the discretionary fiscal |
budget |
polices a government has followed to deliberately achieve |

366 |
T H E E C O N O M I C S Y S T E M |
|
specific macroeconomic goals. These might include |
|
trying to achieve a particular level of inflation, or |
|
employment or government deficit, for example. |
Deadweight loss |
The welfare lost to society from relatively |
|
inefficient production. |
Debt financing |
Debt financing results in borrowing money that must |
|
usually be repaid with interest. |
Deflation |
A fall in the average price level. See also inflation. |
Demand |
The quantity of output buyers are willing to buy over a |
|
range of possible prices |
Demand for active |
The transactions and precautionary demands for money |
balances |
are known as the demand for active balances because the |
|
money is actively used to buy goods and services. |
Demand for idle |
The speculative demand for money is also called the |
balances |
demand for idle balances since it relates to the desire to |
|
demand money to avoid potential losses from holding |
|
interest-bearing financial assets. |
Demand-pull |
An increase in the price level of an economy caused by |
inflation |
rising aggregate demand. |
Dependency ratio |
The portion of a country’s population not in employment |
|
(including the unemployed, those who have retired and |
|
children) relative to the total population in employment. |
|
Dependents are also often classified as ‘non-economically |
|
active’ as they are considered to consume but not |
|
produce economic outputs. |
Depreciation |
The decline in value of an asset over time attributable to |
|
deterioration due to use and obsolescence. See also |
|
appreciation. |
Differentiated |
Products for which several different varieties are provided |
products |
(e.g. cars). Differentiation between varieties depends on |
|
producers’ choices of the product attributes for which |
|
consumers are willing to pay. See also standardized |
|
products. |

G L O S S A R Y |
367 |
Direct taxes |
Taxes paid on income. See indirect taxes. |
Discouraged |
Those who have tried to find work in the past and are |
workers |
willing to take on a job but have given up on looking for |
|
work because they feel, or know, that nothing suitable is |
|
available. They are excluded from calculations of the |
|
labour force, together with groups such as retired people |
|
or people who choose to take on home or childcare |
|
duties. |
Diseconomies of |
Inefficiencies that are associated with a firm’s scale of |
scale |
output which varies over the long run; diseconomies of |
|
scale are experienced when average costs of output rise as |
|
output increases. See also economies of scale. |
Dominant strategy |
A strategy that provides one firm with the best outcome, |
|
irrespective of the strategy another firm (or |
|
firms) chooses. |
Dynamic efficiency |
The outward expansion of the PPF. |
(economic growth) |
|
Economic |
Optimum production given the quantity and quality of |
efficiency |
available factors of production and their cost. |
Economic |
A very broad term which includes such economic |
fundamentals |
measures as interest rates, the government’s budget |
|
deficit, the country’s balance of trade account (relating to |
|
exports and imports), the level of domestic business |
|
confidence, the inflation rate, the state of (and |
|
confidence in) the banking and wider financial sector |
|
and consumer confidence. |
Economic growth |
An expansion in the quantity of goods/services produced |
|
and sold. |
Economic profit |
An economic profit is made if a producer earns enough |
|
from supplying their product (or service) to the market |
|
to cover all their costs and pay themselves for the cost of |
|
the time and effort put into the business. |
Economic shock |
An unexpected event that affects the economy. |

368 |
T H E E C O N O M I C S Y S T E M |
Economies of scale |
Efficiencies that are associated with a firm’s scale of |
|
output which varies over the long run; economies of scale |
|
are enjoyed when average costs of output decline as |
|
output increases. See also diseconomies of scale. |
Economies of scope |
These exist when a firm produces many products and can |
|
share resources across them such that the unit costs of |
|
each product is lower than if they were produced by |
|
separate firms. Shared marketing or distribution costs |
|
may be sources of economies of scope. |
Efficiency wage |
An efficiency wage rate lies above the market clearing |
|
wage rate to provide motivation for workers, to keep |
|
worker turnover low (avoiding costs of hiring) and to act |
|
as a signal to attract appropriately skilled workers. |
Efficient |
All available resources are used to produce a maximum |
production |
combination of goods/services with no resources |
|
unemployed. |
Elastic PED |
See price elasticity of demand. |
Entrepreneurship |
Entrepreneurs exploit knowledge by converting |
|
knowledge discovered into profitable gain. |
|
Entrepreneurship is about being alert to a set of |
|
opportunities, having a subjective expectation as to the |
|
value of such opportunities in the market and having the |
|
resources (or ability to generate them) to realize |
|
this value. |
Equity financing |
Selling a share of the business (‘shares’) in exchange for |
|
finance where no specific future payment is defined. |
Ex-ante real interest |
r = i − π e where π e is expected inflation. Rearranging |
rate |
this equation gives the Fisher equation. See also ex-post |
|
real interest rate. |
Exchange rate |
The price of one currency in terms of another. |
Expansionary fiscal |
A policy whereby the government manages to increase |
policy |
activity by injecting extra income into the circular flow by |
|
changing government expenditure or the tax rate. See |
|
also contractionary fiscal policy. |

G L O S S A R Y |
369 |
Expectations- |
The expectations-augmented Phillips curve explains |
augmented Phillips |
inflation in terms of a negative relationship between |
curve |
inflation and unemployment and a positive relationship |
|
between actual inflation and expected inflation. The |
|
formula for the expectations-augmented Phillips curve is |
|
actual inflation rate = expected rate of inflation |
|
+ X (natural unemployment |
|
rate − actual unemployment rate) |
|
where X denotes a positive number, which is different for |
|
different economies. See also Phillips curve. |
Experience goods |
Goods where their quality attributes can only be assessed |
|
through trial (or experience). See also search goods. |
Ex-post real interest |
r = i − π where π is actual inflation. See also ex-ante real |
rate |
interest rate. |
Externalities |
Either positive or negative effects of a transaction by one |
|
set of parties on others who did not have a choice and |
|
whose interests were not taken into account. |
Factors of |
These are the resources necessary for production. They |
production |
include land, labour, capital, entrepreneurship in |
|
business organization and willingness to take |
|
business risks. |
Fertility rate |
The number of children born in a year, usually expressed |
|
per 1000 women in the reproductive age group. |
Fiat money |
Paper with no intrinsic value itself which fulfils the |
|
functions of money; government legislation ensures that |
|
it is accepted for transactions. |
Final goods |
Goods that are not purchased for further processing or |
|
resale but for final use. |
Fiscal drag |
A cost of inflation whereby people are pushed into higher |
|
tax brackets in a progressive income tax system because |
|
tax rates are not fully inflation adjusted. |

370 |
T H E E C O N O M I C S Y S T E M |
Fiscal policy |
Governments use fiscal policy whenever they affect |
|
|
government spending or tax rates (which affect aggregate |
|
|
demand). See also contractionary fiscal policy, |
|
|
expansionary fiscal policy, countercyclical fiscal policy. |
|
Fisher equation |
The nominal interest rate i = r + π e. Rearranging this |
|
|
equation gives the ex-ante real interest rate. |
|
Fixed costs |
Costs, such as rent and rates, that must be paid even if the |
|
|
firm produces no output. See also variable costs. |
|
Fixed exchange rate |
An exchange rate that is tied to another country’s rate. |
|
Floating exchange |
An exchange rate that is set by currency demand |
|
rate |
and supply. |
|
Fractional reserve |
Describes the requirement of the banking system that |
|
system |
banks must hold a fraction of their deposits in the form of |
|
|
reserves. See also required reserve ratio. |
|
Free-rider problem |
Exists due to the non-rival and non-excludable nature of |
|
|
public goods. There is no incentive to supply or pay |
|
|
privately for goods with public-good characteristics. Such |
|
|
goods, if desired, are provided by governments and paid |
|
|
for collectively through taxes. The free-rider problem is |
|
|
one example of market failure, a reason why the market |
|
|
requires government intervention to change what would |
|
|
otherwise be produced. |
|
Frictional |
Unemployment that arises because of changes or friction |
|
unemployment |
in particular markets. |
|
Functions of money |
These are: |
|
|
• |
medium of exchange; |
|
• |
unit of account; |
|
• |
store of value. |
Futures markets |
Markets in which agreements are made relating to a |
|
|
payment that will be made for delivery of goods in |
|
|
the future. |
|

G L O S S A R Y |
371 |
Game theory |
A microeconomic approach or tool of analysis applied to |
|
|
understand the behaviour of individuals and firms. |
|
|
Pay-offs generated by following different strategies can |
|
|
be compared. |
|
Gross domestic |
A location-based measure of economic activity which |
|
product (GDP) |
measures the value of real output produced in |
|
|
an economy. |
|
Gross investment |
The value of new capital created by investment plus |
|
|
depreciation. See net investment. |
|
Gross national |
GNP is also called gross national income (GNI), since |
|
income (GNI) |
national economic activity is the same whether measured |
|
|
in terms of output (the product in GNP) or income that |
|
|
is generated by citizens providing their factor resources to |
|
|
markets for payment. |
|
Gross national |
The value of real output that is retained by the citizens in |
|
product (GNP) |
a country after all inflows and outflows are allowed for. |
|
Growth accounting |
A method of identifying the proximate causes of changes |
|
|
in output and its rate of growth. |
|
Herfindahl Index |
Measures the market share of all firms in an industry by |
|
|
summing the squares of each individual firm’s |
|
|
market share: |
|
|
N |
|
|
H = |
Si2 |
|
1 |
|
|
where Si denotes each firm’s market share and |
|
|
summation is from firm 1 to N , the total number of firms |
|
|
in the market. The squared term indicates that industries |
|
|
consisting of firms with large market shares will have |
|
|
high indices. See market concentration. |
|
Horizontal equity |
Treating identical people in an identical manner (i.e. not |
|
|
discriminating based on gender or race between |
|
individuals who are economically identical and can perform similar tasks). See also vertical equity.

372 |
T H E E C O N O M I C S Y S T E M |
Human capital |
Includes all the skills, knowledge and expertise that |
|
|
people accumulate over time that allow them to increase |
|
|
their productive capacity as individuals, members of firms |
|
|
and within society more broadly. |
|
Import tariffs |
Rates imposed by governments on imported goods, which |
|
|
raise the price paid by consumers, thereby making the |
|
|
goods less attractive to buy. |
|
Income effect |
The adjustment in quantity demanded due to the change |
|
|
in real income alone caused by a price change. |
|
Income elasticity of |
Measures the responsiveness of the quantity demanded of |
|
demand |
a good to changes in consumers’ income (Y ). It is |
|
|
computed as % Qd/% Y. |
|
Indirect |
Arises when the strategic choice of one firm affects the |
|
competition |
performance of another due to strategic reaction by a |
|
|
third firm. |
|
Indirect taxes |
Indirect taxes are paid on expenditure whereas direct |
|
|
taxes are paid on income. |
|
Inelastic PED |
See price elasticity of demand. |
|
Inferior good |
A good for which demand rises if real income falls or for |
|
|
which demand falls if real income rises. |
|
Inflation |
A rise in the average price level. |
|
|
Inflation = rate of money supply growth – rate of real |
|
|
output growth |
|
|
See also deflation. |
|
Inflationary gap |
The difference between equilibrium output and actual |
|
|
output when an economy is producing above its potential |
|
|
long-run level. |
|
Information |
Exist when one party has more information than another |
|
asymmetries |
party in an exchange agreement. |
|
Injections |
Injections into the circular flow of income include: |
|
|
• |
investment expenditure by firms; |
|
• |
government expenditure; |
|
• |
income earned as payment for exports. |
See also leakages.

G L O S S A R Y |
373 |
Intermediate goods |
Goods sold by firms to other firms and used in making |
|
|
final goods. |
|
Investment |
This describes the macroeconomic or aggregate |
|
function |
investment behaviour in an economy. |
|
Labour |
All human resources used in production. |
|
Labour market |
The ability of the labour market to adjust to |
|
flexibility |
economic shocks. |
|
Labour productivity |
The average output of each worker in the economy. It is |
|
|
generally measured as the value of a country’s production |
|
|
per worker, e.g. UK national output divided by the |
|
|
employed workforce of the UK for a particular period |
|
|
of time. |
|
Land |
All natural resources including minerals and other |
|
|
raw materials. |
|
Law of diminishing |
When a firm adds workers to a given amount of |
|
marginal returns |
capital – machinery, equipment, etc. – it eventually leads |
|
|
to a less efficient match between labour and capital to the |
|
|
extent that, if all capital is used by workers, hiring an |
|
|
additional worker will only lead to workers getting in each |
|
|
other’s way and the marginal product of labour declining. |
|
Leakages |
Leakages of income out of the circular flow include: |
|
|
• |
savings; |
|
• |
taxes; |
|
• |
income paid for imported goods. |
|
See also injections. |
|
Living standards |
The level of material well-being of a citizen. It is generally |
|
|
measured as the value of a country’s production per |
|
|
person, e.g. UK national output divided by the |
|
|
population of the UK for a particular period of time. |
|
Long-run aggregate |
A vertical line drawn at potential output. |
|
supply (LRAS) |
|
|
curve |
|
|

374 |
T H E E C O N O M I C S Y S T E M |
Macroeconomics |
The study of: |
|
|
• |
The relationships between aggregate or combined |
|
|
elements in the economic system such as national |
|
• |
production and employment. |
|
Causes of changes in aggregate economic performance |
|
|
|
including economic structure and economic institu- |
|
|
tions. |
Marginal analysis |
The process of considering the effect of small changes in |
|
|
one factor relevant to an economic decision (e.g. on |
|
|
output levels or pricing) and identifying whether an |
|
|
economic objective will be met. The objective may relate |
|
|
to profit maximization, benefit maximization, cost |
|
|
minimization or revenue maximization as examples. The |
|
|
logic of marginal analysis is that a small incremental |
|
|
change should be made once an economic objective is |
|
|
met – there is economic rationale to increasing price only |
|
|
if profits rise, if that is the economic objective. If no |
|
|
change enhances the economic objective (if it is already |
|
|
maximized/minimized) the decision variable should be |
|
|
changed no further. It is a method for optimizing |
|
|
decision-making within a reasonably well-defined setting. |
|
Marginal cost (MC) |
The change in total costs as output changes ( TC/ Q ). |
|
Marginal physical |
The change in the quantity of output produced by each |
|
product of labour |
additional worker: Q / L. |
|
(MPPL) |
|
|
Marginal propensity |
The relationship between a change in income and the |
|
to consume (MPC) |
resulting change in aggregate consumption expenditure. |
|
Marginal rate of |
At different points on the indifference curve, the |
|
substitution |
consumer is willing to trade different amounts of one |
|
|
good for another good. This is also reflected in the slope |
|
|
of the indifference curve at any point. |
|
Marginal revenue |
The change in total revenue associated with a change in |
|
|
quantity demanded. |
|
G L O S S A R Y |
375 |
Marginal revenue |
Shows the amount of additional revenue generated for a |
function |
firm at different levels of quantity demanded. It is |
|
computed as the change in total revenue divided by the |
|
change in output: TR/ Q . |
Marginal revenue |
The change in total revenue (price of output × number |
product of labour |
of units sold) generated by each additional worker. It is |
(MRPL) |
computed by multiplying the product price by the |
|
marginal physical product of labour. |
Marginal utility |
The change in total utility for each additional |
|
good/service consumed. It is estimated as TU / Q . |
Market |
The number of firms in a specific market and their |
concentration |
relative market share. See also Herfindahl Index. |
Market failure |
Occurs when economic resources are not allocated |
|
efficiently caused by the price system working imperfectly. |
Market |
The reduction of barriers to the free movement of goods |
liberalization |
and services to encourage entry by new competitors. |
Market power |
Exists when firms in a market hold a sufficiently large |
|
market share that their actions can change the price of |
|
their product – producing more results in a falling |
|
equilibrium price, producing less leads to a rise in |
|
equilibrium price, ceteris paribus. |
Market structure |
This describes the main characteristics of an industry, |
|
such as the level of concentration, the extent of entry |
|
barriers and the extent of product differentiation. |
|
Examples of market structures are monopoly, perfect |
|
competition, monopolistic competition and oligopoly. |
Markets |
Situations where exchange occurs between buyers and |
|
sellers or where a potential for exchange exists. Markets |
|
cover the full spectrum from physical locations where |
|
buyers and sellers meet to electronic markets (such as |
|
auction websites) facilitated by the Internet. |
Menu costs |
A cost of inflation to firms and shops, which have to |
|
reprint price lists during periods of inflation because of |
|
frequent price changes. |

376 |
T H E E C O N O M I C S Y S T E M |
Microeconomics |
The study of the causes and effects of the behaviour of |
||
|
individual economic units within the economic system |
||
|
(or groups with broadly similar interests and goals) such |
||
|
as consumers, producers, trades unions, firms and their |
||
|
impact on the markets in which they interact. |
||
Minimum efficient |
The size/scale of plant required if a firm wishes to |
||
scale (MES) |
produce sufficient output to allow it to produce at its |
||
|
minimum long-run average cost. |
||
Minimum wage |
Wage rate set by the government below which employers |
||
|
are not legally permitted to pay workers. Employers are |
||
|
free to pay workers above this wage rate if they choose. |
||
Monetary policy |
The means by which the supply of money is regulated in |
||
|
an economy, including how inflation is controlled and |
||
|
how the stability of the currency is maintained. |
||
Money multiplier |
How a change in money supply leads to an ultimate |
||
|
change in money supply by a multiple of the |
||
|
initial change. |
||
|
The size of the money multiplier depends on the |
||
|
required reserve ratio according to the formula: |
||
|
1 |
|
|
|
Money Multiplier = |
|
|
|
required reserve ratio |
||
Monopolistic |
A market structure where there are many firms, each with |
||
competition |
some power to set the price of their product because they |
||
|
supply a particular brand of product – they differentiate |
||
|
their product – but where many imperfect substitutes are |
||
|
available. |
||
Monopoly |
A market structure where there is just one |
||
|
profit-maximizing firm in a market. |
||
Motives for holding |
We hold money or demand money (in more liquid |
||
money |
forms) for different purposes – for transactions, as a |
||
|
precautionary measure and for speculative purposes. |
||
|
These are known as the motives for holding money. |
||
Multiplier |
Indicates how much income/output changes after a |
||
|
change in autonomous expenditure. It is calculated |
||

G L O S S A R Y |
377 |
|
according to the following formula: |
|||
|
|
1 |
|
|
|
|
|
|
|
|
|
|
(1 − MPC ) |
|
Nash equilibrium |
Exists when each player in a game chooses their best |
|||
|
strategy given the strategies followed by other players. |
|||
National economic |
National economic activity is the sum of activity by all of |
|||
activity |
the economic decision-makers including households, |
|||
|
producers and government. For this reason it is also |
|||
|
called aggregate economic activity. |
|||
National output or |
National output or income, denoted Y, is calculated as |
|||
income |
the value of |
|||
|
• |
all the goods bought for consumption purposes; C plus |
||
|
• |
all the investment expenditures by firms; I plus |
||
|
• |
all government expenditures; G plus |
||
|
• |
the net value of all goods traded by the economy, |
||
|
|
exports minus imports: X − M. |
||
Natural monopoly |
Where scale economies imply that only one firm could |
|||
|
supply efficiently, i.e. at low cost to the market. |
|||
Natural rate of |
The rate of unemployment that would prevail when the |
|||
unemployment |
labour market is in long-run equilibrium – some people |
|||
|
choose to change jobs and even in boom periods it can |
|||
|
take a worker time to find a job best suited to their skills. |
|||
Net investment |
Investment which creates new capital assets, whereas |
|||
|
gross investment includes the value of capital |
|||
|
depreciation plus new capital investment. |
|||
Net property |
The difference between GDP and GNP. |
|||
income from |
|
|
|
|
abroad |
|
|
|
|
Normal (economic) |
The minimum profit a firm is willing to make rather than |
|||
profit |
go out of business. Any level of profit beyond this is called |
|||
|
supernormal profit. |
|||
Normal good |
A good for which demand falls if real income falls or for |
|||
|
which demand rises if income rises. |
|||

378 |
T H E E C O N O M I C S Y S T E M |
Offshore |
Offshore outsourcing (known as offshoring in the United |
outsourcing |
States) involves relocation of elements of the supply chain |
|
to a foreign location for more efficient production. Both |
|
production and services may be outsourced. |
Offshoring |
See offshore outsourcing. |
Oligopoly |
A market structure where there are a few firms of large |
|
size relative to the total market, so each firm has some |
|
degree of market power. |
Open-market |
When the central bank buys or sells government bonds. |
operation |
|
Opportunity cost |
The cost of what is given up in following one course of |
|
action such that other choices are no longer possible. It is |
|
subjective and can be estimated in terms of the cost of the |
|
next-best preferred alternative but only when the choice |
|
made cannot be reversed. |
Optimal currency |
This identifies the factors that determine whether a single |
area (OCA) theory |
currency maximizes single-currency benefits for members |
|
given the costs generated. |
Output gap |
The difference between potential output (also known as |
|
full employment output) and actual output. |
Perfect competition |
A market structure where there are many firms, each |
|
small relative to the overall size of the market. |
Phillips curve |
The relationship between unemployment and inflation, |
|
which is negative, meaning that high unemployment is |
|
associated with low inflation and vice versa. See also |
|
expectations-augmented Phillips curve. |
Political economy |
The term given to the study of how the rules, regulations, |
|
laws, institutions and practices of a country (or a state, |
|
region, province) have an influence on the economic |
|
system and its features. |
Potential output |
A country’s output level if all resources were |
|
fully employed. |

G L O S S A R Y |
379 |
Poverty trap |
A poverty trap (also sometimes known as an |
||
|
unemployment trap) exists when the opportunity cost of |
||
|
moving from unemployment benefits to paid |
||
|
employment is too high. Unemployed workers are often |
||
|
entitled to various benefits in addition to unemployment |
||
|
payments. These may include housing or rent allowances, |
||
|
reduced medical costs, food vouchers, etc. On taking up |
||
|
paid employment, especially of a low-paid nature, the |
||
|
benefits foregone may be less than the wages earned. A |
||
|
vicious circle of poverty can be created which is difficult |
||
|
to break. |
||
Present value (PV) |
A method for comparing benefits in different time |
||
determination |
periods in order to compare the future receipt with a |
||
|
current receipt of the same value. The standard formula |
||
|
used to determine present value is |
||
|
PV = |
£X |
|
|
|
|
|
|
(1 + r )T |
||
|
where PV denotes present value; |
||
|
£X is the amount to be received in the future; |
||
|
r is the market interest rate; |
||
|
T is the number of years before the investment is repaid. |
||
Price cap |
See price ceiling. |
||
Price ceiling |
A price that puts an upper limit on the price that |
||
|
suppliers can charge. |
||
Price elasticity of |
The responsiveness of quantity demanded to a change in |
||
demand (PED) |
price. It is calculated as: |
||
|
PED = % Qd/% P |
||
|
PED differs at different points on the demand curve. In |
||
|
absolute terms (ignoring the minus sign) PED is greater |
||
|
than one when the percentage change in quantity |
||
|
demanded is greater than the percentage change in |
||
|
price. This is elastic PED. PED is less than one when the |
||
|
percentage change in quantity demanded is less than the |
||
|
percentage change in price. This is inelastic PED. |
||

380 |
T H E E C O N O M I C S Y S T E M |
Price elasticity of |
The responsiveness of quantity supplied to changes in |
supply (PES) |
price. It may be elastic, inelastic or unit elastic. |
|
It is computed as the proportional change in quantity |
|
supplied divided by the proportional change in |
|
price: |
|
% QS/% P |
Price floor |
A price that suppliers can be sure to receive for |
|
their output. |
Price leadership |
Where either a dominant firm in the industry sets price |
|
and all others follow or a well-established firm becomes |
|
the ‘leader’ and is trusted with setting the price that all |
|
firms will charge. |
Price-cost margin |
See profit margin. |
Prisoner’s Dilemma |
Exists when the equilibrium from a game generates a |
|
sub-optimal outcome for all parties involved. With |
|
commitment (or a binding contract) between the firms, |
|
higher pay-offs could be achieved to the benefit of all |
|
players. |
Privatization |
The sale of government-owned businesses (and associated |
|
assets) in whole or in part to the private sector. Examples |
|
include electricity, gas and telecommunications |
|
industries. |
Producer surplus |
The benefit to producers due to the difference between |
|
the price suppliers are willing to receive for their output |
|
and what they actually receive. |
Product |
The features or attributes that explain consumers’ |
differentiation |
decisions to buy one variety or brand instead of another |
|
are the basis for product differentiation. |
Production |
A relationship describing how economic activity, |
function |
specifically output, depends on the factors of production |

G L O S S A R Y |
381 |
|
and technology. It describes a technically efficient use of |
|
|
the factors of production and technology necessary to |
|
|
produce output, i.e. no resources are unemployed. |
|
Profit margin |
The mark-up over costs that a firm makes or wishes to |
|
|
make. Some firms will be happy to earn low mark-ups, |
|
|
other firms wish to earn high mark-ups. Also called the |
|
|
price-cost margin. |
|
Progressive income |
A tax system in which individuals pay a higher percentage |
|
tax system |
of their income in tax, the more they earn. |
|
Public goods |
Goods that would not be provided in a free-market |
|
|
system. They are goods that |
|
|
• |
if consumed by one person can still be consumed by |
|
|
others; non-rival in consumption. Private goods once |
|
• |
consumed are not available to others. |
|
if provided, cannot be excluded from the consumption |
|
|
|
of anyone who desires the good, even if they do not |
|
|
wish to pay for it. Public goods are non-excludable in |
|
|
consumption. |
Purchasing power |
A measure of the relative purchasing power of different |
|
parity (PPP) |
currencies. PPP is the exchange rate that equates the |
|
|
price of a basket of identical traded goods and services in |
|
|
two countries. It is often very different from the market |
|
|
exchange rate. |
|
Quantity equation |
|
M × V = P × Y |
|
|
|
|
where M denotes the nominal money supply in an |
|
|
economy, V denotes velocity of money, P denotes the |
|
|
average price level, Y denotes the level of real economic |
|
|
activity and hence P × Y is the nominal value of |
|
|
economic activity (i.e. income or output). |
|
Quotas |
Quantitative restrictions set by governments on the |
|
|
amount of imports permitted from another customs area. |
|
|
Because quotas limit the supply of a good, they drive the |
|
|
price of the good up. |
|

382 |
T H E E C O N O M I C S Y S T E M |
Real business cycle |
This theory is based on the view that changes in |
(RBC) theory |
technology explain business cycles. |
Real interest rate |
This is computed as the difference between the nominal |
(r) |
interest rate and the rate of inflation. |
|
r = i − π |
|
where i denotes the nominal rate and π is the rate of |
|
inflation. |
Realignments |
Simultaneous and coordinated devaluation or revaluation |
|
of currencies. |
Recessionary gap |
In a recession, the difference between the level of |
|
potential output and the lower actual output. |
Regulatory capture |
Where regulations set up to protect consumers – to lead |
|
to greater competition and lower prices – become |
|
captured by the industry for the benefit of producers in |
|
that industry. This happens where producers can |
|
convince the regulator to introduce rules |
|
favouring producers. |
Required reserve |
The percentage of all deposits received by banks that |
ratio |
must be held in the bank and not used for loans or |
|
other purposes. |
Reservation wage |
The lowest wage a worker will accept to take a job. |
Search goods |
Goods where their quality attributes can be assessed |
|
before purchase. See also experience goods. |
Services |
Non-material or intangible items of consumption that are |
|
consumed as they are created. |
Shoe-leather costs |
The effect of people holding less currency during periods |
|
of inflation, thereby needing to make more trips to the |
|
bank to withdraw cash. |
Short run |
The period of time it takes for a firm to change its scale of |
|
production and this depends on its fixed factor of |
|
production – usually capital. |

G L O S S A R Y |
383 |
Speculative |
See demand for idle balances. |
demand for money |
|
Spot or cash |
Markets where money changes hands today for goods or |
markets |
services received today. |
Standardized |
Products for which many substitutes are available and |
products |
which use readily available technology in their |
|
production. See also differentiated products. |
Standardized |
The standardized unemployment rate measures those |
unemployment rate |
unemployed as people of working age without work who |
|
are available to start work within two weeks and who are |
|
actively seeking employment. |
Steady state |
The term used by Solow to describe the equilibrium state |
|
of output and capital stock in the long run. (The term is |
|
also used in physics.) An economy that reaches a |
|
steady-state level of capital stock and level of output has |
|
no tendency to change from these levels, ceteris paribus. |
Structural |
Unemployment arising from a permanent decline in |
unemployment |
employment in industries located in a particular region |
|
or area. |
Subsidy |
A payment or a tax concession from the government that |
|
reduces producers’ average production costs. |
Substitution effect |
The adjustment in quantity demanded due to the change |
|
in relative prices alone, i.e as the price of one good |
|
increases, people buy less of it preferring its relatively |
|
cheaper substitutes. |
Supernormal profit |
See normal profit. |
Supply |
The activities of firms that organize the factors of |
|
production to produce output and make it available |
|
to buyers. |
Supply chain |
The resources and processes that are involved in |
|
acquiring components and raw materials and includes |
|
delivery of end products to final consumers. It includes |

384 |
T H E E C O N O M I C S Y S T E M |
|
the activities of sellers, distributors, manufacturers, |
|
wholesalers and any other service providers and |
|
contributors to the buyer’s decision to buy. |
Tacit knowledge |
Knowledge that is highly personal, not easily visible or |
|
expressible and cannot easily be copied. It usually |
|
requires joint, shared activities in order to transmit it. |
|
Examples of tacit knowledge include subjective insights, |
|
intuitions and hunches. |
Tariffs |
See import tariffs. |
Tax wedge |
The difference between the real wage paid by an |
|
employee and the real wage received by an employee. |
|
Differences are accounted for by payroll taxes (usually |
|
related to social insurance/security contributions), |
|
income taxes, consumer price taxes. |
Total costs (TC) |
The sum of variable costs and fixed costs incurred by a |
|
firm. |
Total factor |
A measure of the efficiency with which inputs are |
productivity (TFP) |
employed to produce output. TFP is a catch-all term that |
|
measures the effect on output not only of any changes in |
|
technology, but also in the social and political systems |
|
that affect the quantity and quality of output that an |
|
economy can produce from its labour and capital |
|
resources. TFP is effectively that portion of output change |
|
that cannot be accounted for by changes in the quantity |
|
and quality of labour and capital. |
Total revenue (TR) |
Price times the quantity of goods sold: TR = P × Q . |
Total utility (TU) |
The total benefit perceived by the consumer from |
|
consumption of a good/service. |
Trade barriers |
Policies or practices that reduce the amount of imports |
|
into a country. Examples include import tariffs and |
|
quotas. |
Transactions costs |
The complete price plus non-price costs of a transaction, |
|
including search, information, bargaining and |
|
policing costs. |
G L O S S A R Y |
385 |
Unanticipated |
Inflation that takes people by surprise and therefore has |
inflation |
not been taken into account in economic |
|
decision-making. See also anticipated inflation. |
Unemployment |
See poverty trap. |
trap |
|
Variable costs (VC) |
Costs that depend directly on the amount of output a |
|
firm produces, such as the costs for production inputs |
|
and workers. The higher the quantity produced the |
|
higher the variable costs. See also fixed costs. |
Vertical equity |
Treating people with intrinsically different characteristics |
|
(education, experience, abilities) differently in order to |
|
reduce the income disparity resulting from their |
|
differences. See also horizontal equity. |

I N D E X
absolute advantage 37–8, 135 AC see average costs
ACEA see European Automobile Manufacturers Association
acquisition 234
active labour market policies 315 advantages of single European currency
277 |
|
advertising |
215, 226 |
Aer Lingus |
235 |
AFC see average fixed costs
aggregate consumer behaviour 103–7
aggregate demand |
172–5 |
aggregate economic activity 170–71 |
|
aggregate expenditure 172–3 |
|
aggregate supply |
171, 175–7, 269 |
Airbus 205–6, 233 |
|
alliance of economic perspectives 27–9 allocation of resources 187
ALPS see active labour market policies alternative targets for monetary policy
270–72
fixed and floating exchange rates 270–72
Taylor rules and economic judgement
272 |
|
|
analysis of unemployment |
291–3 |
|
classical approach |
291–2 |
|
Keynesian approach |
292–3 |
|
analytical tools 138 |
|
|
anti-competitive practices |
17, 226, 315 |
|
anti-pollution systems |
52 |
|
anticipated inflation |
304 |
–5 |
antitrust 231 |
|
|
applications of elasticity analysis 98–9 appreciation 255, 258
arbitrage 259–60, 277
arc price elasticity |
96 |
artificial scarcity |
17 |
Asian Tiger 330, 337
assembled knowledge |
58–9 |
|
|
||||||
assumption of rationality in economics |
|||||||||
83–4 |
|
|
|
|
|
|
|
|
|
ATC see average total cost |
|
|
|
|
|||||
attribute combination |
102 |
|
|
|
|||||
attribute model |
|
101–3 |
|
|
|
|
|||
Austrian perspectives on competition |
|||||||||
221–3 |
|
|
|
|
|
|
|
|
|
Austrian School of Economics |
200, 204 |
||||||||
automatic stabilizers |
188 |
|
|
|
|||||
autonomous consumption |
104, 178–9 |
||||||||
autonomous investment |
143 |
|
|
||||||
average costs |
125–31 |
|
|
|
|
||||
explaining U-shaped cost curves |
126–31 |
||||||||
and profit maximization |
133 |
|
|||||||
average fixed costs |
123–4 |
|
|
|
|||||
average output |
120–23 |
|
|
|
|
||||
average product of labour |
121 |
|
|
||||||
average relationships |
122–3 |
|
|
||||||
average total cost |
|
|
125 |
|
|
|
|
||
BA see British Airways |
|
|
|
|
|
||||
backward bending |
71 |
|
|
|
|
||||
balance of payments |
275, 305 |
|
|
||||||
Bank of England |
|
|
266 |
|
|
|
|
||
Bank for International Settlements |
259 |
||||||||
banking system |
244 |
|
|
|
|
|
|||
bankruptcy |
202, 235, 264 |
|
|
|
|||||
banning smoking |
|
109 |
|
|
|
|
|||
bargaining power |
|
309, 313 |
|
|
|
||||
barriers to entry |
|
135, 199, 315 |
|
|
|||||
basket of goods |
|
172 |
|
|
|
|
|
||
benchmark |
209 |
|
|
|
|
|
|
|
|
benefits of competition |
232 |
|
|
||||||
benefits of international trade |
184–6 |
||||||||
benefits of monopoly |
213 |
|
|
|
|||||
best practice |
314, 325 |
|
|
|
|
||||
beyond demand |
|
|
77–112 |
|
|
|
|||
aggregate consumer behaviour |
103–7 |
||||||||

388 |
T H E E C O N O M I C S Y S T E M |
beyond demand (continued)
consumer choice and product attributes 101–3
consumer satisfaction – utility 81–4 consumers’ response to price changes
93–100
demand, consumers and consumer
surplus |
90–92 |
|
||
demand and the importance of |
||||
consumers |
78–81 |
|
||
government policies – consumer focus |
||||
107–9 |
|
|
|
|
introduction |
77–8 |
|
||
marginal utility, prices and law of |
||||
demand |
84–90 |
|
||
see also consumers; demand |
|
|||
beyond supply |
113–54 |
|
||
firms in economic action 114–15 |
||||
firms’ investment behaviour |
142–4 |
|||
government influence on supply and |
||||
production |
144–50 |
|
||
introduction |
113–14 |
|
||
maximizing profits in the long run |
||||
131–8 |
|
|
|
|
organizing economic system around firms |
||||
115–31 |
|
|
|
|
producers’ response to price changes |
||||
140–42 |
|
|
|
|
supply, producers and producer supply |
||||
139 |
|
|
|
|
see also firms; supply |
|
|||
bid down price |
212 |
|
||
Big Mac Index |
4 |
|
||
black market |
152 |
|
||
BMW |
49 |
|
|
|
Boeing |
205–6, 233 |
|
||
bond rankings |
265 |
|
||
bonds |
263–8, 304 |
|
||
inflation and interest rates |
266–8 |
|||
boom |
160, 273, 298, 306 |
|
||
borrowing 105–6 |
|
|||
bounded rationality 84 |
|
|||
brand loyalty |
212, 214–15 |
|
||
breakfast cereals |
101–3 |
|
||
bringing AD and AS together |
|
|||||||
177–8 |
|
|
|
|
|
|
|
|
British Airways |
235 |
|
|
|
||||
broadband |
348–9 |
|
|
|
||||
budget deficit |
189, 276 |
|
|
|||||
budget line |
87, 89 |
|
|
|
||||
business cycle |
158–65 |
|
|
|||||
explanations/causes of business cycles |
||||||||
161–4 |
|
|
|
|
|
|
|
|
implications for business and |
||||||||
government |
|
165 |
|
|
||||
and real output |
158–65 |
|
||||||
business uncertainty |
305 |
|
|
|||||
buyers’ income |
43–4 |
|
|
|||||
Cambridge School of Economics 14 |
||||||||
capital |
23, 303, 334–5, 344–5 |
|||||||
capital deepening |
342 |
|
|
|||||
capital goods |
23–4 |
|
|
|
||||
capital intensity |
|
191 |
|
|
||||
capital requirement |
212 |
|
|
|||||
capital resources |
|
27 |
|
|
||||
capital stock investment |
335–6 |
|||||||
capital widening |
|
342 |
|
|
||||
cartel |
216, 301 |
|
|
|
|
|
||
cash market |
|
261 |
|
|
|
|
||
caste system |
|
5 |
|
|
|
|
|
|
Caterpillar tractors |
185 |
|
|
|||||
causes of business cycles |
161–4 |
|||||||
causes of change in exchange rates |
||||||||
258–60 |
|
|
|
|
|
|
|
|
causes of differences in natural |
||||||||
unemployment rate |
312–14 |
|||||||
Celtic Tiger |
|
330 |
|
|
|
|
||
central bank independence |
255, 268 |
|||||||
central banks |
162, 242–5 |
|
||||||
money multiplier |
244–5 |
|
||||||
central planning |
|
61 |
|
|
||||
centralized decision-making |
20–22 |
|||||||
ceteris paribus assumption |
8–9, 13, 42–4, |
|||||||
160, 331 |
|
|
|
|
|
|
||
CFC gases |
147 |
|
|
|
|
|
||
challenges for car producers |
130 |
|||||||

I N D E X |
389 |
challenges for the economic system
283–320 |
|
cross-country differences 314–17 |
|
inflation 296–305 |
|
introduction 283–4 |
|
linking unemployment and inflation |
|
306–314 |
|
unemployment 284–96 |
|
Chamberlin, Edward |
213 |
change 223 |
|
changes in equilibrium |
55 |
changes in influences on demand 45–6
changes in labour input 341–3 |
||
changes in technology |
343–4 |
|
chlorofluorocarbons |
147 |
|
Chrysler 130 |
|
|
circular flow |
156–8 |
|
classical approach to unemployment |
||
analysis |
291–2 |
|
classification of dangerous substances 52
Clayton Act 1914 231 |
|
|
co-operative equilibrium |
221 |
|
Coca-Cola |
90, 234 |
|
Coke see Coca-Cola |
|
|
collective wage-bargaining |
290–91, |
|
315 |
|
|
collusion |
216–19, 301 |
|
comfort products 45 |
|
|
commodity |
182–3 |
|
Common Agricultural Policy 57 comparative advantage 39
comparative measures of economic activity
168 |
|
|
|
competition |
134, 197–238 |
||
alternative models of competition and |
|||
market structure |
204–221 |
||
Austrian and traditional perspectives: a |
|||
comparison |
221–3 |
||
benefits of |
232 |
|
|
in the economic system 198–204 |
|||
government regulation of competition |
|||
226–35 |
|
|
|
introduction |
197–8 |
||
when markets fail |
223–6 |
||
competition policy |
230–35 |
|
|
|||||
implementation of |
232–5 |
|
|
|||||
principles |
231–2 |
|
|
|
|
|
||
competition spectrum |
229 |
|
|
|
||||
competitiveness |
28, 276 |
|
|
|
|
|||
complements 42–3, 51 |
|
|
|
|
||||
components of real output |
165–70 |
|||||||
other measures of economic activity |
||||||||
167–8 |
|
|
|
|
|
|
|
|
computation of multiplier |
|
179 |
|
|
||||
concentration ratio |
205 |
|
|
|
|
|||
conclusions from the Solow model |
345–7 |
|||||||
congestion charge |
43 |
|
|
|
|
|
||
consideration of the euro |
274–8 |
|
||||||
constant returns to scale |
129 |
|
|
|||||
constraints |
116 |
|
|
|
|
|
|
|
consumer choice |
|
101–3 |
|
|
|
|
||
consumer confidence |
17, 44–5 |
|
||||||
consumer focus |
107–9 |
|
|
|
|
|||
consumer preferences |
90 |
|
|
|
||||
consumer price index |
299–300 |
|
||||||
consumer response to price changes |
||||||||
93–100 |
|
|
|
|
|
|
|
|
applications of elasticity analysis |
98–9 |
|||||||
other elasticity examples |
99–100 |
|||||||
price elasticity of demand |
94–8 |
|
||||||
consumer satisfaction |
81–4 |
|
|
|||||
assumption of rationality in economics |
||||||||
83–4 |
|
|
|
|
|
|
|
|
consumer surplus |
|
90–92, 289 |
|
|
||||
consumer theory |
15 |
|
|
|
|
|
||
consumer welfare |
|
92 |
|
|
|
|
|
|
consumers |
77–112 |
|
|
|
|
|
||
aggregate consumer behaviour |
103–7 |
|||||||
choice and product attributes |
101–3 |
|||||||
consumer surplus and consumer welfare |
||||||||
92 |
|
|
|
|
|
|
|
|
demand and consumer surplus |
90–92 |
|||||||
demand and importance of |
78–81 |
|||||||
as focus of government policies |
107–9 |
|||||||
marginal utility |
|
84–90 |
|
|
|
|
||
response to price changes |
93–100 |
|||||||
and utility |
81–4 |
|
|
|
|
|
||
consumption function |
104, 107, 108 |
|||||||

390 |
T H E E C O N O M I C S Y S T E M |
consumption goods |
77, 79–81 |
|
|
|||||
consumption smoothing |
261–2 |
|
||||||
containerization |
183 |
|
|
|
|
|||
contestable market |
202 |
|
|
|
|
|||
contracting out |
49 |
|
|
|
|
|
||
convergence |
337, 354, 355 |
|
|
|||||
convertible bond |
264 |
|
|
|
|
|||
copyright |
153 |
|
|
|
|
|
|
|
cost disadvantage |
212 |
|
|
|
|
|||
cost-push inflation |
296–7, 308 |
|
|
|||||
costs of firm |
123–5 |
|
|
|
|
|||
costs of inflation |
304–5 |
|
|
|
|
|||
costs of international trade |
184–6 |
|||||||
costs of unemployment |
285–96 |
|
||||||
countercyclical fiscal policy |
188 |
|
||||||
CPI see consumer price index |
|
|
||||||
CR see concentration ratio |
|
|
|
|||||
creative destruction |
164, 236 |
|
|
|||||
credit cards |
240–42 |
|
|
|
|
|||
cross-country differences: |
|
|
|
|
||||
unemployment and inflation |
314–17 |
|||||||
employment legislation |
316–17 |
|||||||
cross-price elasticity |
100 |
|
|
|
||||
currency stability |
273, 276 |
|
|
|
||||
cyclical unemployment |
287 |
|
|
|||||
cyclically adjusted budget |
189 |
|
|
|||||
Daimler |
130 |
|
|
|
|
|
|
|
deadweight loss |
211, 225 |
|
|
|
||||
dealing with AS and AD shocks |
187 |
|||||||
debt 303 |
|
|
|
|
|
|
|
|
debt financing 264 |
|
|
|
|
|
|||
decentralized decision-making |
61–2 |
|||||||
decision-making |
16–22, 61–2, 70–71, |
|||||||
116–17, 253–5 |
|
|
|
|
|
|||
decisions of firms |
116–17 |
|
|
|
||||
decline in trade barriers |
182 |
|
|
|||||
deflation |
171, 299 |
|
|
|
|
|
||
demand |
35–76, 78–81, 90–92 |
|
|
|||||
consumers and consumer surplus |
||||||||
90–92 |
|
|
|
|
|
|
|
|
in the foreign exchange market |
256 |
|||||||
and importance of consumers |
|
78–81 |
||||||
non-price determinants of demand 42–6
see also beyond demand; law of demand
demand for balances |
246–7 |
|
|||
demand for bonds |
265 |
|
|||
demand for credit |
304 |
|
|||
demand curve |
40–41, 46 |
|
|||
demand for money |
246–7 |
|
|||
demand schedule |
41, 46 |
|
|||
demand shock |
188 |
|
|
||
demand-deficient unemployment |
292 |
||||
demand-pull inflation |
296–7 |
|
|||
demography |
339 |
|
|
|
|
dependency ratio |
327–31 |
|
|||
depreciation |
142–3, 169, 255, 271, 335–6 |
||||
depression |
80 |
|
|
|
|
description of economic relationships |
|||||
9–14 |
|
|
|
|
|
determinants of demand |
|
||||
non-price 42–6 |
|
|
|
||
determination of exchange rate |
257–8 |
||||
devaluation |
271, 276 |
|
|
||
development of the economic system |
|||||
321–60 |
|
|
|
|
|
economic growth over time 331–2 |
|||||
income distribution |
349–56 |
|
|||
introduction 322 |
|
|
|||
living standards and labour productivity |
|||||
relationships |
322–31 |
|
|||
modelling economic growth: Solow |
|||||
growth model |
333–49 |
|
|||
differentiated product |
199 |
|
|||
diminishing returns 127, 215, 348 |
|||||
direct competition |
233 |
|
|||
direct taxes |
169 |
|
|
|
|
dis-saving 105–6 |
|
|
|
||
discouraged workers |
284 |
|
|||
discovery 201–4 |
|
|
|
||
diseconomies of scale |
127, 130 |
|
|||
disequilibrium |
72, 311 |
|
|||
disposable income |
43, 44 |
|
|||
distortion |
146 |
|
|
|
|
dominant strategy |
217–18 |
|
|||
domino effect |
178 |
|
|
||

I N D E X |
391 |
Dr Pepper |
234 |
|
|
|
|
|
|
durable consumption goods |
43, 79 |
||||||
dynamic efficiency |
26–7 |
|
|
|
|||
easyJet 130, 233 |
|
|
|
|
|
|
|
ECB see European Central Bank |
|
|
|||||
economic action |
114–15 |
|
|
|
|||
economic activity |
155–96 |
|
|
|
|||
another perspective on 190–92 |
|
||||||
and the circular flow |
156–8 |
|
|
||||
equilibrium economic activity |
170–78 |
||||||
equilibrium economic activity and the |
|||||||
multiplier 178–81 |
|
|
|
||||
government activity |
187–92 |
|
|
||||
international integration |
181–7 |
|
|||||
real output and the business cycle |
|||||||
158–65 |
|
|
|
|
|
|
|
real output and its components |
165–70 |
||||||
see also macroeconomy |
|
|
|
||||
economic analysis |
|
7, 138 |
|
|
|
||
economic approach |
6–9 |
|
|
|
|||
economic efficiency |
3 |
|
|
|
|
||
economic fundamentals |
260–61 |
|
|||||
economic growth |
3, 330 |
|
|
|
|||
economic growth over time |
331–2 |
||||||
economic judgement 272 |
|
|
|
||||
economic and monetary union |
275 |
||||||
economic perspectives |
27–9 |
|
|
||||
economic profit |
46–8 |
|
|
|
|
||
see also normal profit |
|
|
|
|
|||
economic relationships |
9–14 |
|
|
||||
economic resources and markets |
2–6 |
||||||
economic shock |
161, 270, 273, 316 |
||||||
economic system |
1–34 |
|
|
|
|||
alliance of economic perspectives |
27–9 |
||||||
competition in |
197–238 |
|
|
|
|||
describing and interpreting economic |
|||||||
relationships |
9–14 |
|
|
|
|||
economic resources and markets |
2–6 |
||||||
economics approach: theory-based |
|||||||
analysis |
6–9 |
|
|
|
|
|
|
introducing the economic system |
1–2 |
||||||
microeconomics and macroeconomics 14–18
positive/normative economics |
29–30 |
||||||||
resource scarcity and prices in the |
|||||||||
economic system |
18–22 |
|
|
||||||
resource use, opportunity costs and |
|||||||||
efficiency |
22–7 |
|
|
|
|||||
economic theory |
7 |
|
|
|
|
||||
economies of scale |
127, 210–213 |
|
|||||||
economies of scope |
215 |
|
|
||||||
economy as a production function |
190–92 |
||||||||
effects of inflation on income distribution |
|||||||||
305 |
|
|
|
|
|
|
|
|
|
effects on production of environmental |
|||||||||
taxes |
147–8 |
|
|
|
|
|
|||
efficiency |
2–3, 22–7, 133–6, 198 |
|
|||||||
efficiency wage |
290 |
|
|
|
|
||||
efficient production |
24 |
|
|
||||||
elastic PED |
96–7 |
|
|
|
|
||||
elasticity see price elasticity of demand |
|||||||||
elasticity analysis |
98–9 |
|
|
||||||
elderly dependency ratios 329 |
|
|
|||||||
employment legislation |
316–17 |
|
|||||||
EMU see economic and monetary union |
|||||||||
End of Life Vehicles EU directive |
50, 52, |
||||||||
74 |
|
|
|
|
|
|
|
|
|
endogenous growth |
347–9 |
|
|
||||||
Enron |
17 |
|
|
|
|
|
|
|
|
entrepreneurship |
23, 201–4, 350 |
|
|||||||
environmental taxes |
147–8 |
|
|
||||||
equilibrium |
55, 63, 71–2 |
|
|
||||||
in the labour market |
71–2 |
|
|
||||||
equilibrium economic activity |
170–81 |
||||||||
aggregate demand |
172–5 |
|
|
||||||
aggregate supply |
175–7 |
|
|
||||||
bringing AD and AS together: the short |
|||||||||
run |
177–8 |
|
|
|
|
|
|||
and the multiplier |
178–81 |
|
|
||||||
price level |
171–2 |
|
|
|
|||||
equilibrium price |
53–5, 91 |
|
|
||||||
equity financing |
|
264 |
|
|
|
||||
ERM see exchange rate mechanism |
|
||||||||
euro |
255–9, 274–8 |
|
|
|
|
||||
how it scores under the four OCA factors 277–8

392 |
T H E E C O N O M I C S Y S T E M |
European Automobile Manufacturers
Association |
74 |
|
|
|
|
European car industry |
111–12 |
|
|||
European Central Bank |
179, 242, 250–51, |
||||
258, 271, 277 |
|
|
|
|
|
European Monetary Union |
189 |
|
|||
evidence on convergence |
354 |
|
|||
ex-ante real interest rate |
253–4 |
|
|||
ex-post real interest rate |
253–4 |
|
|||
exchange 36–40, 240–41 |
|
|
|||
and money |
240–41 |
|
|
|
|
exchange rate |
255–60, 270–72 |
|
|||
causes of changes in |
258–60 |
|
|||
determination |
257–8 |
|
|
||
exchange rate mechanism |
275 |
|
|||
expansionary fiscal policy |
188 |
|
|||
expectations of inflation |
253–5 |
|
|||
expectations-augmented Phillips curve |
|||||
306–7 |
|
|
|
|
|
expectations-generated inflation |
308 |
||||
expected future prices |
44, 51 |
|
|||
expenditure approach |
165 |
|
|||
expenditure categories |
156 |
|
|||
experience curve effect |
212 |
|
|||
experience goods |
225 |
|
|
|
|
explaining U-shaped cost curves |
126–31 |
||||
explanation of business cycles 161–4 |
|||||
explanation of growth |
344–5 |
|
|||
explanation of international productivity |
|||||
differences |
|
346 |
|
|
|
explanation of international trade growth 182–4
extent of competition in the economy 198–204
competition as a process 199–201 entrepreneurship, discovery and market
process |
201–4 |
|
|
externalities |
147, 224 |
|
|
factor earnings |
169 |
|
|
factors of production |
2, 48–50 |
||
fallacy of composition |
106, 186 |
||
Federal Reserve |
242, 250, 258, 272 |
||
female participation in the workforce 316
fertility rate |
329 |
|
fiat money |
241 |
|
final goods |
168 |
|
Finance Act 2001 |
108 |
|
financial markets |
239–82 |
|
foreign exchange market 255–60 |
||
international monetary integration |
||
272–8 |
|
|
introduction 239–40 |
||
liquidity, central banks and money supply |
||
242–5 |
|
|
monetary policy |
268–72 |
|
money demand |
246–7 |
|
money and exchange 240–41 money market: demand and supply
247–51
quantity theory of money and explaining
inflation 251–5 |
|
|
||
speculation in markets |
260–68 |
|||
firm output |
120–23 |
|
|
|
see also product |
|
|
||
firms 113–54 |
|
|
|
|
in economic action |
114–15 |
|||
government influence on supply and |
||||
production |
144–50 |
|||
investment behaviour |
142–4 |
|||
maximizing profits in the long run |
||||
131–8 |
|
|
|
|
organizing economic system around |
||||
115–31 |
|
|
|
|
producers’ response to price changes |
||||
140–42 |
|
|
|
|
supply, producers and producer surplus |
||||
139 |
|
|
|
|
first-mover advantage |
136 |
|||
fiscal drag |
305 |
|
|
|
fiscal policy |
188, 298 |
|
|
|
Fisher equation |
254 |
|
|
|
fixed costs |
123–4 |
|
|
|
fixed exchange rates |
270–72 |
|||
fixed factors of production 116 |
||||
floating exchange rates |
270–72 |
|||
floor prices |
141 |
|
|
|
food labelling |
52, 226 |
|
||

I N D E X |
393 |
foreign bond |
264 |
|
|
|
foreign exchange market |
158, 255–60 |
|||
causes of changes in exchange rates |
||||
258–60 |
|
|
|
|
demand in |
256 |
|
|
|
exchange rate determination 257–8 |
||||
supply in |
256–7 |
|
||
fractional reserve system |
244 |
|||
Franklin, Benjamin |
164 |
|
||
free entry 202 |
|
|
|
|
free-market outcome 35 |
|
|||
free-market system |
61–2, 204, 289 |
|||
free-rider problem |
22 |
|
||
frictional unemployment |
286–7, 291, 308 |
|||
Friedman, Milton |
306 |
|
||
full employment output |
272 |
|||
full-time workers |
316 |
|
||
functions of money |
240–41 |
|||
futures market |
261 |
|
||
game of chance |
222 |
|
||
game theory |
217–20 |
|
||
gas emissions |
147 |
|
|
|
GDP deflator |
300 |
|
|
|
General Agreement on Tariffs and Trade 186, 354
golden rule level of capital 340–41 government activity 187–92
economy as a production function 190–92
government contribution to inflation 303–4
see also inflation
government effect on prices 56–8 price ceiling 56–7
price floor 57
problems of price ceilings and floors 57–8
government expenditure 115 government influence on supply and
production 144–50 government policies 107–9 government regulation of competition
226–35
competition policy |
230–35 |
|||||
competition spectrum |
229 |
|||||
structure, conduct and performance |
||||||
229–30 |
|
|
|
|
|
|
government regulations |
52, |
|
||||
204 |
|
|
|
|
|
|
Great Depression |
80–81, 164 |
|||||
Greenspan, Alan |
250 |
|
|
|||
grey imports |
|
152–3 |
|
|
||
grey market for cars |
152–3 |
|
||||
Groningen Growth and Development |
||||||
Centre |
193 |
|
|
|
|
|
gross domestic product |
166–70 |
|||||
what it does not measure |
169–70 |
|||||
gross national income 43, 166 |
||||||
gross national product |
168–70 |
|||||
what it does not measure |
169–70 |
|||||
growth accounting |
344 |
|
|
|||
growth differential |
258–9 |
|
||||
growth of the economic system 3, |
||||||
321–60 |
|
|
|
|
|
|
haggling 62 |
|
|
|
|
|
|
hard investment |
336 |
|
|
|||
Harmonized Index of Consumer Prices |
||||||
193 |
|
|
|
|
|
|
Hayek, Friedrich August von |
60–61, 75, |
|||||
200, 223, 230 |
|
|
|
|
||
hazardous waste |
74 |
|
|
|
||
HDI see human development index |
||||||
health and safety standards |
226 |
|||||
Herfindahl Index |
205 |
|
|
|||
Hitler, Adolf |
|
81 |
|
|
|
|
horizontal equity |
351 |
|
|
|||
household saving rates |
338–40 |
|||||
how euro scores under the four OCA |
||||||
factors |
277–8 |
|
|
|
||
human capital |
24, 296, 348 |
|
||||
human development index |
324 |
|||||
Iberia Airlines |
235 |
|
|
|
||
IBM 222 |
|
|
|
|
|
|
idiosyncratic knowledge |
59 |
|
||||
idle balances |
|
246–7 |
|
|
||

394 |
T H E E C O N O M I C S Y S T E M |
illegal accounting methods 17
ILO see International Labour Organization imperfect competition 205 implementation of competition policy
232–5
implications of business cycles 165 implications of change in influence on
demand |
45–6 |
|
|
||
implications of market failure |
225–6 |
||||
implicit collusion |
216–17 |
|
|||
importance of consumers 78–81 |
|||||
consumption goods |
79–81 |
||||
incentive |
21, 39, 51, 142, 355 |
||||
income |
168–70 |
|
|
|
|
income distribution |
105, 305, 321–60 |
||||
intra-country 351–6 |
|
||||
welfare perspective |
349–51 |
||||
income effect |
42, 87–90 |
|
|||
income elasticity of demand |
99–100 |
||||
income injection |
158, 298 |
|
|||
income method of measuring economic
activity |
167–8 |
|
|
increased quality of labour |
27 |
||
increased quantity of labour |
26 |
||
increasing opportunity costs of |
|||
production |
25 |
|
|
independence of central banks |
|||
255, 268 |
|
|
|
index numbers |
10 |
|
|
indifference curve 87–8 |
|
||
indirect competition 233 |
|
||
indirect taxes |
169 |
|
|
individual supply decision |
70–71 |
||
indivisibilities in production |
128 |
||
industry labour demand curve 64 |
|||
inelastic PED |
96 |
|
|
inelastic PES |
140 |
|
|
inferior good |
89, 99 |
|
|
inflation 171, 251–5, 266–72, 276, |
|||
283–320 |
|
|
|
bonds and interest rates |
266–8 |
||
costs of anticipated and unanticipated |
|||
inflation |
304–5 |
|
|
cross-country differences: unemployment and 314–17
governments’ contribution to inflation 303–4
inflation expectations, interest rates and decision-making 253–5
inflationary gap 297–9
linking unemployment and 306–314 measurement of 296–7
trends in international price levels 299–303
see also challenges for the economic
system |
|
|
|
|
|
|
|
inflation differential |
|
258–9 |
|
|
|||
inflation expectations |
253–5, 304 |
||||||
inflationary gap |
297–9 |
|
|
|
|||
influences on demand |
45–6 |
|
|||||
influences on supply and production |
|||||||
144–50 |
|
|
|
|
|
|
|
environmental taxes |
147–8 |
|
|||||
international trade |
145–7 |
|
|||||
tax incidence |
149–50 |
|
|
||||
using subsidies |
145–7 |
|
|
||||
information |
58–62 |
|
|
|
|
||
decentralized decision-making |
61–2 |
||||||
information asymmetries |
223–6 |
|
|||||
innovation |
21, 163, 198–200 |
|
|||||
innovation incentives |
21 |
|
|
||||
input see labour input |
|
|
|
|
|||
insider–outsider model |
303 |
|
|
||||
intellectual property |
|
153 |
|
|
|||
intention 40 |
|
|
|
|
|
|
|
interest rate differential |
258 |
|
|
||||
interest rate effect |
174–5 |
|
|
||||
interest rates |
248–51, 253–5, 266–8, |
||||||
276, 304 |
|
|
|
|
|
|
|
bonds and inflation |
266–8 |
|
|||||
and decision-making |
253–5 |
|
|||||
intermediate goods |
168 |
|
|
|
|||
international business cycle |
159 |
|
|||||
see also business cycle |
|
|
|
||||
international competitiveness |
305 |
||||||
international dependency ratios |
328 |
||||||
international inflation rates |
300 |
|
|||||

I N D E X |
395 |
international integration |
181–7 |
|
benefits and costs of international trade |
||
184–7 |
|
|
explaining growing international trade |
||
182–4 |
|
|
see also international trade |
|
|
International Labour Organization |
285 |
|
international monetary integration |
272–8 |
|
considering the euro |
274–8 |
|
international price level trends 299–303
international trade |
145–7, 181–7 |
benefits and costs |
184–7 |
explaining growing international trade |
|
182–4 |
|
international trade effect 175 |
|
interpretation of economic relationships |
|
9–14 |
|
intervention 226 |
|
intra-country income distribution 351–6
evidence on convergence |
354 |
trade and development |
354–6 |
introduction to the economic system 1–2 inventory 45, 142–3, 202
inventory investment |
79 |
|
||
investment behaviour of firms |
142–4 |
|||
investment in bond markets |
263–6 |
|||
investment function |
143–4 |
|
||
‘invisible hand’ concept 60 |
|
|||
see also Smith, Adam |
|
|||
Iranian Revolution 302 |
|
|||
Irish Special Savings Investment Accounts |
||||
108 |
|
|
|
|
irrational exuberance |
250 |
|
||
Keynes, John Maynard |
164, 292 |
|||
Keynesian approach to unemployment |
||||
analysis |
292–3, 298 |
|
||
knowledge |
58–62, 201–2, 221–3, 230 |
|||
see also information |
|
|
||
Kyoto Protocol |
147 |
|
|
|
labour demand |
64–70 |
|
||
labour input |
325, 341–5 |
|
||
labour laws |
165 |
|
|
|
labour market |
|
64–72, 289–90 |
|
||||
equilibrium in the labour market |
71–2 |
||||||
labour demand |
64–70 |
|
|
||||
labour supply |
70–71 |
|
|
||||
labour market analysis 286–91 |
|
||||||
labour market flexibility |
316 |
|
|||||
labour output see output |
|
|
|||||
labour productivity |
21, 322–31, 333, 347 |
||||||
dependency ratio |
|
327–31 |
|
||||
see also living standards |
|
|
|||||
labour supply |
70–71 |
|
|
||||
lack of stability effects |
305 |
|
|||||
law of demand |
84–90 |
|
|
||||
income and substitution effects |
87–90 |
||||||
see also beyond demand; demand |
|
||||||
law of diminishing returns |
66–7 |
|
|||||
leakage |
158, 180 |
|
|
|
|
||
lean production |
144 |
|
|
|
|||
legal protection |
213 |
|
|
|
|||
liberalization |
228 |
|
|
|
|
||
licensing |
204 |
|
|
|
|
|
|
linking unemployment and inflation |
|||||||
306–314 |
|
|
|
|
|
|
|
causes of differences in natural |
|
||||||
unemployment rates |
312–14 |
|
|||||
model explaining natural unemployment |
|||||||
rate |
309–312 |
|
|
|
|
||
liquidity |
242–7 |
|
|
|
|
||
living standards |
31, 322–31, 350 |
|
|||||
definition |
3 |
|
|
|
|
|
|
dependency ratio |
|
327–31 |
|
||||
see also labour productivity |
|
||||||
loan term |
248–9 |
|
|
|
|
||
lobby groups |
144, 317 |
|
|
||||
logistics |
184 |
|
|
|
|
|
|
London ForEx |
260 |
|
|
|
|||
long run |
116–17 |
|
|
|
|
||
long-run aggregate supply |
176–7 |
|
|||||
long-run aggregate supply curve 176–7 |
|||||||
long-run average cost |
129 |
|
|||||
long-run average cost curve 131, 208, 214 long-run equilibrium 208–9
loss of purchasing power 305 LRAC see long-run average cost
396 |
T H E E C O N O M I C S Y S T E M |
LRAS see long-run aggregate supply lumpy investment 162
macroeconomic consumption behaviour
103–7 |
|
|
|
|
|
|
macroeconomics |
14–18 |
|
|
|||
environment for economic decisions |
||||||
16–18 |
|
|
|
|
|
|
macroeconomy |
|
155–96, 310 |
|
|||
economic activity and the circular flow |
||||||
156–8 |
|
|
|
|
|
|
equilibrium economic activity |
170–78 |
|||||
equilibrium economic activity and the |
||||||
multiplier |
178–81 |
|
|
|||
government activity |
187–92 |
|
||||
international integration |
181–7 |
|||||
introduction |
155–6 |
|
|
|||
real output and the business cycle |
||||||
158–65 |
|
|
|
|
|
|
real output and its components |
165–70 |
|||||
see also economic activity |
|
|
||||
maintenance of brand loyalty in |
|
|||||
monopolistic competition 215 |
||||||
margin-setting curve |
310, 312 |
|
||||
marginal analysis |
117 |
|
|
|||
marginal costs |
25–6, 69, 125–31 |
|
||||
explaining U-shaped cost curves |
126–31 |
|||||
marginal output |
120–23 |
|
|
|||
marginal product of capital |
344 |
|
||||
marginal product of labour |
65, 121, 345 |
|||||
marginal propensity to consume |
104–5, |
|||||
108 |
|
|
|
|
|
|
marginal rate of substitution |
88 |
|
||||
marginal relationships 122–3 |
|
|||||
marginal revenue |
118–19 |
|
|
|||
product of labour |
67, 69 |
|
|
|||
marginal revenue function |
118–19 |
|||||
marginal utility |
82–90 |
|
|
|||
income and substitution effects |
87–90 |
|||||
mark-up |
309 |
|
|
|
|
|
market abuse |
235 |
|
|
|
||
market analysis |
35–76 |
|
|
|||
demand |
40–46 |
|
|
|
||
equilibrium |
63 |
|
|
|
||
exchange |
36–40 |
|
|
|
||
government affecting prices 56–8 |
||||||
information and knowledge in the |
||||||
market system |
58–62 |
|
||||
introduction |
35–6 |
|
||||
market interaction |
52–5 |
|||||
market labour |
64–72 |
|
||||
supply |
46–52 |
|
|
|
||
market clearing price |
52 |
|
||||
market concentration |
204 |
|
||||
market economy |
62 |
|
|
|||
market failure |
22, 223–6 |
|
||||
implications of market failure |
||||||
225–6 |
|
|
|
|
|
|
why markets fail |
223–5 |
|
||||
market failure implications |
225–6 |
|||||
market failure types |
|
223–5 |
||||
externalities |
224 |
|
|
|
||
information asymmetries |
224–5 |
|||||
monopoly power |
224 |
|
||||
natural monopoly |
|
224 |
|
|||
public goods |
223–4 |
|
||||
market interaction |
52–5 |
|
||||
changes in equilibrium |
55 |
|||||
market power |
204 |
|
|
|
||
market process |
201–4 |
|
||||
market structure |
204–221 |
|
||||
markets |
2–6, 204 |
|
|
|
||
Marshall, Alfred |
13–14 |
|
||||
maximization of profits in the long run |
||||||
131–8 |
|
|
|
|
|
|
maximizing profits over the short run |
||||||
137–8 |
|
|
|
|
|
|
profit maximization, normal profit and |
||||||
efficiency |
133–6 |
|
||||
maximization of profits in the short run 137–8
economic analysis 138 MC see marginal costs measures of economic activity
167–70
GNP, GDP and income 168–70 menu costs 305
MES see minimum efficient scale

I N D E X |
397 |
microeconomics |
14–18, 356 |
||
environment for economic decisions |
|||
16–18 |
|
|
|
Microsoft |
222 |
|
|
millennium development goals (UN) |
|||
354 |
|
|
|
minimum efficient scale |
129 |
||
minimum wage |
287–91 |
||
mismatch |
314 |
|
|
Mitchell, B.R. 299 |
|
||
model explaining natural unemployment |
|||
rate |
309–312 |
|
|
modelling economic growth 333–49 |
|||
conclusions from the Solow model |
|||
345–7 |
|
|
|
endogenous growth |
347–9 |
||
explaining growth: labour, capital and |
|||
technology |
344–5 |
|
|
more on savings 337–41 |
|||
Solow model and changes in labour input |
|||
341 |
–3 |
|
|
|
|
Solow model and changes in technology |
|||||
343 |
–4 |
|
|
|
|
models of competition and market |
|||||
structure 204–221 |
|
||||
monopolistic competition |
213–15 |
||||
monopoly |
209–211 |
|
|||
oligopoly |
215–21 |
|
|
||
perfect competition |
206–9 |
||||
perfect competition vs. monopoly |
|||||
211 |
–13 |
|
|
|
|
monetary policy |
242, 268–72 |
||||
alternative targets |
270–72 |
|
|||
difficulties in targeting money supply |
|||||
269 |
–70 |
|
|
|
|
Taylor rules and economic judgement |
|||||
272 |
|
|
|
|
|
Monetary Policy Committee |
271 |
||||
money |
239–82 |
|
|
|
|
demand |
246–7 |
|
|
||
and exchange |
240–41 |
|
|||
international monetary integration |
|||||
272 |
–8 |
|
|
|
|
liquidity, central banks and money supply 242–5
market: demand and supply 247–51 monetary policy 268–72
quantity theory of money and explaining
inflation |
251–5 |
|
||
see also financial markets |
|
|||
money demand |
246–51 |
|
||
money market |
247–51 |
|
||
nominal and real interest rates |
||||
249–51 |
|
|
|
|
which interest rate 248–9 |
||||
money multiplier |
244–5 |
|
||
money supply |
242–5, 247–51 |
|||
monopolistic competition |
213–15 |
|||
maintaining and enhancing brand loyalty |
||||
215 |
|
|
|
|
monopoly |
209–211 |
|
||
benefits |
213 |
|
|
|
vs. perfect competition |
211–13 |
|||
monopoly power |
224 |
|
||
Moody’s |
265 |
|
|
|
mortgages |
248–9 |
|
||
MPC see marginal propensity to consume |
||||
MPPL see marginal physical product of |
||||
labour
MR see marginal revenue MSC see margin-setting curve multiplier 178–81 municipal bond 264
NAIRU see non-accelerating inflation rate of
unemployment |
|
||
nanny state |
109 |
|
|
Nash equilibrium |
219, 237 |
||
Nash, John |
219 |
|
|
National Association of Software and |
|||
Service Companies |
184 |
||
national exchange rates |
15–16 |
||
national income |
78, 162 |
|
|
national output 78, 299 |
|
||
National Socialist Workers Party 81 |
|||
national statistics |
171 |
|
|
natural monopoly |
210, 224 |
||

398 |
T H E E C O N O M I C S Y S T E M |
natural rate of unemployment 286–7,
306–314 |
|
|
causes of differences in |
312–14 |
|
explanatory model 309–312 |
||
neoclassical growth model |
333 |
|
see also Solow growth model |
||
net exports 115, 175 |
|
|
net investment |
143 |
|
neuromarketing |
90 |
|
new growth model 347
NGOs see non-governmental organizations
Nissan 130 |
|
|
nominal amounts |
11 |
|
nominal inflation |
249 |
|
nominal interest rates |
249–51 |
|
non-accelerating inflation rate of |
||
unemployment |
286 |
|
non-durable goods |
79, 81 |
|
non-governmental organizations 350 |
||
non-price competition |
215 |
|
non-price determinants of demand |
42–6 |
|||
buyers’ income 43–4 |
|
|
||
complements and substitutes 42–3 |
||||
consumer confidence |
44–5 |
|
||
expected future prices |
44 |
|
||
implications of changes in influences on |
||||
demand |
45–6 |
|
|
|
population |
44 |
|
|
|
preferences |
44 |
|
|
|
price of related goods/services |
42–3 |
|||
non-unionized workers |
303, 309 |
|
||
normal good |
89, 99 |
|
|
|
normal profit |
48, 133–6 |
|
||
see also economic profit |
|
|||
normative economics |
29–30 |
|
||
see also positive economics |
|
|||
number of suppliers |
51 |
|
|
|
OCA see optimal currency area OECD see Organization for Economic
Cooperation and Development offshore outsourcing 184–5 offshoring see offshore outsourcing oil prices 42, 162, 301–2, 324
and inflation 301–2 |
|
oligopoly 215–21 |
|
and game theory |
217–19 |
Prisoner’s Dilemma 219–21 |
|
OPEC see Organization of Petroleum Exporting Countries
open-market operation 243, 247, 303–4 opportunity costs 18, 22–7, 37–9, 47, 86 opposition 223
optimal currency area 273 optimal form of organization 61–2
Organization for Economic Cooperation and Development 3, 32, 216, 301, 316, 329, 337
organization of economic system around
firms |
115–31 |
|
|
|
|||
firm costs |
123–5 |
|
|
|
|||
firm output |
120–23 |
|
|
||||
firm revenue |
|
117–20 |
|
||||
firms’ decisions and role of time |
|||||||
116–17 |
|
|
|
|
|
||
marginal and average costs |
125–31 |
||||||
marginal and average output |
120–23 |
||||||
product |
120–23 |
|
|
|
|||
Organization of Petroleum Exporting |
|||||||
Countries |
142 |
|
|
|
|||
output |
120–23, 158–70 |
|
|||||
output gap |
160 |
|
|
|
|
||
outsourcing |
49, 314 |
|
|
||||
overproduction |
|
141 |
|
|
|||
overspending |
303 |
|
|
|
|||
ownership rights |
203–4 |
|
|||||
paradox of thrift |
106 |
|
|
||||
parallel imports |
|
152–3 |
|
|
|||
Parmalat 17 |
|
|
|
|
|
||
part-time workers |
316, 343 |
|
|||||
patents |
135, 153, 203 |
|
|
||||
patterns in real output |
159 |
|
|||||
PED see price elasticity of demand |
|||||||
Penn World Table |
31, 79 |
|
|||||
Pepsi |
90, 234 |
|
|
|
|
|
|
perfect competition |
204–9, 222 |
||||||
long-run equilibrium |
208–9 |
||||||

I N D E X |
399 |
short-run equilibrium 207–8 |
|
vs. monopoly 211–13 |
|
perfect elasticity |
141 |
perfect inelasticity |
141 |
persistent economic growth 347 |
|
perspectives on competition compared 221–3
PES see price elasticity of supply
Phelps, Edmund |
306 |
||
Phillips curve |
306–8 |
||
Phillips, William |
306 |
||
physical capital |
348 |
||
political economy |
5 |
||
pollution |
52, 147, 170 |
||
population |
44, 351 |
||
positive economics 29–30 |
|||
see also normative economics |
|||
potential output |
160, 175–6 |
||
poverty trap 326 |
|
||
PPF see production possibility frontier
preferences 44, 105 |
|
see also consumer preferences |
|
present value |
266–8 |
price cap see price ceiling |
|
price ceiling |
56–7, 142, 289 |
problems of |
57–8 |
price changes |
93–100, 140–42 |
price changes and consumer response
93–100 |
|
|
|
|
|
price elasticity of demand |
94–8 |
||||
cross-price elasticity |
100 |
||||
income elasticity |
99–100 |
||||
other examples |
99–100 |
|
|||
some special cases |
98 |
|
|||
and total revenue |
96–8 |
|
|||
price elasticity of supply |
140, 142 |
||||
price fixing |
17 |
|
|
|
|
price floor |
57–8 |
|
|
|
|
price leadership |
216–17 |
|
|||
price level |
171–2 |
|
|
|
|
price of production factors |
48–50 |
||||
price and quantity effects |
11, 14 |
||||
price ratios |
85–6 |
|
|
|
|
price of related goods/services 42–3, 51
price sensitivity |
93–4, 98–9, 302 |
|
|||||||
price-cost margin |
309 |
|
|
|
|
||||
prices 18–22, 84–90 |
|
|
|
|
|||||
using resources and centralized |
|
||||||||
decision-making 20–22 |
|
|
|||||||
principles of competition policy |
231–2 |
||||||||
Prisoner’s Dilemma |
219–21 |
|
|
||||||
private property rights |
61 |
|
|
|
|||||
privatization |
228 |
|
|
|
|
|
|
||
pro-competitive practices |
315 |
|
|
||||||
problems of price ceilings and floors |
57–8 |
||||||||
process of competition |
199–201 |
|
|||||||
process of economic analysis 7 |
|
|
|||||||
producer response to price change |
|
||||||||
140–42 |
|
|
|
|
|
|
|
|
|
producer surplus |
139 |
|
|
|
|
||||
producers |
139 |
|
|
|
|
|
|
||
product |
120–23 |
|
|
|
|
|
|
||
see also firm output |
|
|
|
|
|
||||
product attributes |
101–3 |
|
|
|
|||||
attribute model |
101–3 |
|
|
|
|||||
product differentiation |
101, 135 |
|
|||||||
production function |
190–92, 334, 348 |
||||||||
production possibility frontier |
23–7, 348 |
||||||||
productivity advantage |
38 |
|
|
|
|||||
profit margin |
309 |
|
|
|
|
|
|||
profit maximization in the long run |
131–8 |
||||||||
normal profit and efficiency |
133–6 |
||||||||
profit maximization, normal profit and |
|||||||||
efficiency |
133–6 |
|
|
|
|
||||
profit maximization in the short run |
|
||||||||
137–8 |
|
|
|
|
|
|
|
|
|
economic analysis |
138 |
|
|
|
|||||
profitability |
290 |
|
|
|
|
|
|
||
property bubble |
250 |
|
|
|
|
||||
property rights |
349 |
|
|
|
|
|
|||
psychology |
45 |
|
|
|
|
|
|
|
|
public debt |
276 |
|
|
|
|
|
|
||
public goods |
21–2, 187, 223–6 |
|
|||||||
public interest |
27 |
|
|
|
|
|
|||
public sector employment |
108–9 |
|
|||||||
purchasing power parity |
3–4, 41–2 |
|
|||||||
adjustment |
3 |
|
|
|
|
|
|
||

400 |
T H E E C O N O M I C S Y S T E M |
quantity theory of money 251–5, 304 inflation expectations, interest rates and
decision-making 253–5
quasi-fixing |
271 |
|
|
|
|
|
|
quota 182, 187 |
|
|
|
|
|
||
R&D see research and development |
|||||||
rankings of bonds |
265 |
|
|
|
|||
rationality in economics |
83–4 |
||||||
real amounts |
11 |
|
|
|
|
|
|
real business cycle |
162 |
|
|
||||
see also business cycle |
|
|
|
||||
real business cycle theory |
162–3 |
||||||
real economic activity |
|
166 |
|
||||
real interest rates |
249–51 |
|
|||||
real output |
158–70 |
|
|
|
|
||
and the business cycle |
158–65 |
||||||
and its components |
|
165–70 |
|||||
patterns in |
159 |
|
|
|
|
||
real wage-setting curve |
310, 313 |
||||||
real wealth effect |
174 |
|
|
|
|||
realignment |
275 |
|
|
|
|
|
|
the real thing 153 |
|
|
|
|
|||
reasons for inflation |
301 |
|
|
||||
recession |
80, 160, 176, 273, 287 |
||||||
recessionary gap |
293–5 |
|
|
||||
redistribution effect |
225 |
|
|
||||
redundancy |
316 |
|
|
|
|
|
|
registered design rights |
153 |
||||||
regulation of competition |
|
226–35 |
|||||
regulatory capture |
227 |
|
|
||||
related goods/services price |
42–3, 51 |
||||||
relative price |
86 |
|
|
|
|
|
|
Renault |
130 |
|
|
|
|
|
|
required reserve ratio |
|
244 |
|
||||
research and development |
213, 349 |
||||||
reservation wage |
70 |
|
|
|
|
||
reserve ratio |
244 |
|
|
|
|
|
|
reskilling |
315 |
|
|
|
|
|
|
resource scarcity |
18–22 |
|
|
||||
using resources and centralized |
|||||||
decision-making 20–22 |
|||||||
resources |
18–22, 187, 297 |
|
|||||
restrictions |
199 |
|
|
|
|
|
|
restructuring |
49, 235 |
|
|
|||||
returns to large-scale production |
128 |
|||||||
revenue of firm |
117–20 |
|
|
|||||
revenue maximization |
118 |
|
|
|||||
risk 249 |
|
|
|
|
|
|
|
|
robotics |
|
49, 124 |
|
|
|
|
||
robustness 236 |
|
|
|
|
|
|||
role of time |
116–17 |
|
|
|
||||
Rover |
49 |
|
|
|
|
|
|
|
RWS curve see real wage-setting curve |
||||||||
Ryanair |
|
130, 233 |
|
|
|
|
||
Sabena |
|
235 |
|
|
|
|
|
|
savings |
337–41 |
|
|
|
|
|||
savings axis |
105 |
|
|
|
|
|||
savings function |
106 |
|
|
|
||||
scale economies |
136 |
|
|
|
||||
scale of world poverty |
354 |
|
|
|||||
Schumpeter, Joseph |
136, 163–4, 200, 203, |
|||||||
213 |
|
|
|
|
|
|
|
|
scientific knowledge |
58 |
|
|
|||||
SCP paradigm see structure, conduct, |
||||||||
performance paradigm |
|
|
||||||
SEA see Single European Act |
|
|
||||||
seasonal unemployment 287 |
|
|
||||||
self-sufficiency |
38 |
|
|
|
|
|||
Sen, Amartya |
354 |
|
|
|
|
|||
services |
|
79, 81 |
|
|
|
|
|
|
Sherman Act 1890 |
231 |
|
|
|||||
shoe-leather costs |
305 |
|
|
|||||
short run |
116–17 |
|
|
|
|
|||
short-run average cost curve |
130–31 |
|||||||
short-run average total costs |
137–8 |
|||||||
short-run equilibrium |
207–8 |
|
||||||
short-term fluctuation |
156, 170 |
|
||||||
shortage |
53 |
|
|
|
|
|
|
|
Single European Act |
274 |
|
|
|||||
Smith, Adam |
3, 20, 60, 128, 184, 203 |
|||||||
soft investment |
336 |
|
|
|
||||
Solow growth model |
333–49, 356 |
|||||||
and changes in labour input |
341–3 |
|||||||
and changes in technology |
343–4 |
|||||||
conclusions from |
345–7 |
|
|
|||||
endogenous growth |
347–9 |
|
||||||

I N D E X |
401 |
explaining growth: labour, capital and
technology 344–5 |
|
|||
more on savings |
337–41 |
|||
Solow residual |
345 |
|
|
|
Solow, Robert |
333 |
|
|
|
spare capacity |
176 |
|
|
|
special cases of price elasticity of |
||||
demand |
|
98 |
|
|
special savings accounts |
108 |
|||
specialization |
|
128, 203 |
|
|
spectrum of competition |
229 |
|||
speculation |
246, 258–68, 277 |
|||
bonds, inflation and interest rates |
||||
266–8 |
|
|
|
|
investment in bond markets 263–6 |
||||
sports utility vehicle |
45–6, 51, 55 |
|||
spot market |
261 |
|
|
|
SRAC see short-run average cost curve
stabilization policy |
187–8 |
Standard & Poor’s |
265 |
standardized product 199 |
|
standardized unemployment rate 285
Starbucks |
4 |
start-ups 27 |
|
static efficiency 26 |
|
steady state |
335–7, 347 |
sticky wages |
292, 294, 298, 302, 308 |
structural unemployment 286–7, 308 structure, conduct, performance paradigm
229–30 |
|
|
|
|
subsidies |
144–7, 234–5, 355 |
|
||
subsidizing |
145, 349, 355 |
|
|
|
substitutes |
41–3, 51, 175, 233 |
|
||
substitution effect |
41, 87–90 |
|
||
summary of market characteristics |
220–21 |
|||
sunspot theory 164 |
|
|
||
supernormal profit |
48, 133–6, 207–211, |
|||
214 |
|
|
|
|
supplier number |
51 |
|
|
|
supply 35–76, 139 |
|
|
||
expected future prices |
51 |
|
||
in the foreign exchange market |
256–7 |
|||
government regulations |
52 |
|
||
number of suppliers 51 |
|
|||
prices of factors of production |
48–50 |
|||||||
prices of related goods |
51 |
|
||||||
producers and producer surplus |
139 |
|||||||
supply chain |
183 |
|
|
|
||||
supply curve |
47, 50 |
|
|
|
||||
supply of money |
242–5 |
|
|
|||||
supply schedule |
47, 50 |
|
|
|||||
surplus |
53, 90–92, 139 |
|
|
|||||
SUV see sports utility vehicle |
|
|||||||
switching costs |
315 |
|
|
|
||||
tacit knowledge |
59, 201 |
|
|
|||||
Tall Latte Index |
4 |
|
|
|
||||
targeting monetary supply 269–72 |
||||||||
alternative targets |
270–72 |
|
||||||
difficulties in |
269–70 |
|
|
|||||
tariff |
182, 184, 187, 355 |
|
|
|||||
tax incidence |
149–50 |
|
|
|||||
tax rate |
108, 303 |
|
|
|
||||
tax wedge |
314–15 |
|
|
|
||||
see also wedge |
|
|
|
|
||||
taxation |
187 |
|
|
|
|
|
||
Taylor rules |
|
272 |
|
|
|
|||
technology |
27, 343–5 |
|
|
|||||
TFC see total fixed costs |
|
|
||||||
TFP see total factor productivity |
|
|||||||
theory-based analysis |
6–9 |
|
||||||
time |
116–17 |
|
|
|
|
|||
time-series data |
12 |
|
|
|
||||
total costs |
123–5 |
|
|
|
||||
total factor productivity |
345, 347 |
|
||||||
total fixed costs |
123–4 |
|
|
|||||
total output |
|
120 |
|
|
|
|||
total revenue |
96–7, 118 |
|
|
|||||
and price elasticity of demand |
96–8 |
|||||||
total utility |
82–3 |
|
|
|
||||
total variable cost curve |
124–5 |
|
||||||
tourism |
259, 287 |
|
|
|
||||
trade barriers |
182 |
|
|
|
||||
trade deficit |
|
181, 271 |
|
|
||||
trade and development |
354–6 |
|
||||||
trade restrictions |
186, 354 |
|
||||||
trademarks |
153 |
|
|
|
||||

402 |
T H E E C O N O M I C S Y S T E M |
traditional perspectives on competition
221–3 |
|
|
transaction costs |
62 |
|
transactions |
246 |
|
transfer payment |
157, 187 |
|
transport deregulation 183 |
||
Treaty of Maastricht 274–5 |
||
Treaty of Rome |
229, 232, 274 |
|
trend line |
14 |
|
trends in international price levels 299–303
TVC see total variable cost curve
types of market failure |
223–5 |
||
types of unemployment |
286–91 |
||
unanticipated inflation |
304–5 |
||
unemployment |
283–320 |
|
|
analysing unemployment |
291–3 |
||
causes of differences in natural rates of |
|||
312–14 |
|
|
|
costs of 295–6 |
|
|
|
cross-country differences: inflation and |
|||
314–17 |
|
|
|
labour market analysis |
286–91 |
||
linking inflation and |
306–314 |
||
model explaining natural rate of |
|||
309–312 |
|
|
|
rate 284–6 |
|
|
|
and the recessionary gap |
293–5 |
||
types of unemployment |
286–91 |
||
see also challenges for the economic |
|||
system |
|
|
|
unemployment benefits |
292 |
||
unemployment trap 326 |
|
||
United Nations |
354 |
|
|
unpredictability |
222–3 |
|
|
unregistered design rights 153 use of resources 20–27
opportunity costs and efficiency 22–7 use of subsidy 145–7
utility 81–4
value-added method of measuring economic activity 167–8
variable costs 123 velocity 251–2 vertical equity 351 Virgin Airlines 235
wage rise negotiations 303–4, 313
wage-bargaining |
290–91, 302, 304, 315 |
|||
Wall Street Crash |
80 |
|
||
waste |
50, 74 |
|
|
|
wealth |
105 |
|
|
|
Wealth of Nations 3 |
|
|
||
wedge |
147, 166, 314–15 |
|
||
welfare economics |
92, 160, 326, 356 |
|||
what GNP and GDP do not measure |
||||
169–70 |
|
|
|
|
women |
316 |
|
|
|
world poverty |
354 |
|
||
World Trade Organization |
16, 146, 186, |
|||
354 |
|
|
|
|
World War Two |
81, 301, 324 |
|||
WorldCom 17 |
|
|
|
|
WTO see World Trade Organization |
||||
Yom Kippur War |
302 |
|
||
young dependency ratios |
329 |
|||
zero-coupon bond |
264 |
|
||
zero-sum game |
200 |
|
||