

Primer on molecular genetics (Human Genome Project, DOE)(44s)
.pdfGeneticists have already charted the approximate positions of over 2300 genes, and a start has been made in establishing high-resolution maps of the genome (Fig. 7). Moreprecise maps are needed to organize systematic sequencing efforts and plan new research directions.
Mapping Strategies
Genetic Linkage Maps
A genetic linkage map shows the relative locations of specific DNA markers along the chromosome. Any inherited physical or molecular characteristic that differs among individuals and is easily detectable in the laboratory is a potential genetic marker. Markers can be expressed DNA regions (genes) or DNA segments that have no known coding function but whose inheritance pattern can be followed. DNA sequence differences are especially useful markers because they are plentiful and easy to characterize precisely.
NUMBER OF EXPRESSED GENES MAPPED
ORNL-DWG 91M-17362A
2500
2000
1500
1000
500
0
66 68 |
70 72 |
74 76 78 80 82 84 |
86 |
88 90 |
92 |
|
|
YEAR |
|
|
|
Fig. 7. Assignment of Genes to Specific Chromosomes.
The number of genes assigned (mapped) to specific chromosomes has greatly increased since the first autosomal (i.e., not on the X or Y chromosome) marker was mapped in 1968. Most of these genes have been mapped to specific bands on chromosomes. The acceleration of chromosome assignments is due to (1) a combination of improved and new techniques in chromosome sorting and band analysis, (2) data from family studies, and (3) the introduction of recombinant DNA technology. [Source: adapted from Victor A. McKusick, “Current Trends in Mapping Human Genes,” The FASEB Journal 5(1), 12 (1991).]
11

Primer on Molecular Genetics
 Complete a detailed human genetic map
 Complete a physical map
 Acquire the genome as clones
 Determine the complete sequence
 Find all the genes
With the data generated by the project, investigators will determine the functions of the genes and develop tools for biological and medical applications.
One short-term goal of the genome project is to develop a high-resolution genetic map (2 to 5 cM); recent consensus maps of some chromosomes have averaged 7 to 10 cM between genetic markers. Genetic mapping resolution has been increased through the application of recombinant DNA technology, including in vitro radiation-induced chromosome fragmentation and cell fusions (joining human cells with those of other species to form hybrid cells) to create panels of cells with specific and varied human
12

|
ORNL-DWG 91M-17363 |
|
|
FATHER |
MOTHER |
Marker M M
and HD HD
|
|
|
|
|
|
|
|
|
|
|
|
|
|
|
|
|
|
|
|
|
|
|
|
|
|
|
|
|
|
|
|
|
|
|
|
|
|
|
|
|
|
|
|
|
|
|
|
CHILDREN |
|
|
|
|
|
|
|||||
|
|
|
|
|
|
|
|
|
|
|
|
|
|
||||||
M |
|
|
|
|
|
|
|
M |
|
|
|
|
|
M |
|
|
|
|
|
|
|
|
|
|
|
|
|
|
|
|
|
|
|
|
|
|
|||
|
|
|
|
|
|
||||||||||||||
HD |
|
|
|
|
|
|
|
|
|
|
|
|
|
HD |
|
|
|
|
|
|
|
|
|
|
|
|
|
|
|
|
|
||||||||
|
|
|
|
|
|
|
|
|
|
|
|
|
|
|
|
|
|
||
|
Marker M |
|
|
|
Marker M |
|
Marker M |
||||||||||||
|
and HD |
|
|
|
Only* |
|
and HD |
||||||||||||
*Recombinant: Frequency of this event reflects the distance between genes for the marker M and HD.
Fig. 8. Constructing a Genetic Linkage Map. Genetic linkage maps of each chromosome are made by determining how frequently two markers are passed together from parent to child. Because genetic material is sometimes exchanged during the production of sperm and egg cells, groups of traits (or markers) originally together on one chromosome may not be inherited together. Closely linked markers are less likely to be separated by spontaneous chromosome rearrangements. In this diagram, the vertical lines represent chromosome 4 pairs for each individual in a family. The father has two traits that can be detected in any child who inherits them: a short known DNA sequence used as a genetic marker (M) and Huntington’s disease (HD). The fact that one child received only a single trait (M) from that particular chromosome indicates that the father’s genetic material recombined during the process of sperm production. The frequency of this event helps determine the distance between the two DNA sequences on a genetic map .
chromosomal components. Assessing the frequency of marker sites remaining together after radiation-induced DNA fragmentation can establish the order and distance between the markers. Because only a single copy of a chromosome is required for analysis, even nonpolymorphic markers are useful in radiation hybrid mapping. [In meiotic mapping (described above), two copies of a chromosome must be distinguished from each other by polymorphic markers.]
Physical Maps
Different types of physical maps vary in their degree of resolution. The lowest-resolution physical map is the chromosomal (sometimes called cytogenetic) map, which is based on the distinctive banding patterns observed by light microscopy of stained chromosomes. A cDNA map shows the locations of expressed DNA regions (exons) on the chromosomal map. The more detailed cosmid contig map depicts the order of overlapping DNA fragments spanning the genome. A macrorestriction map describes the order and distance between enzyme cutting (cleavage) sites. The highest-resolution physical map is the complete elucidation of the DNA base-pair sequence of each chromosome in the human genome. Physical maps are described in greater detail below.
13

Primer on Molecular Genetics
Low-Resolution Physical Mapping
Chromosomal map. In a chromosomal map, genes or other identifiable DNA fragments are assigned to their respective chromosomes, with distances measured in base pairs. These markers can be physically associated with particular bands (identified by cytogenetic staining) primarily by in situ hybridization, a technique that involves tagging the DNA marker with an observable label (e.g., one that fluoresces or is radioactive). The location of the labeled probe can be detected after it binds to its complementary DNA strand in an intact chromosome.
As with genetic linkage mapping, chromosomal mapping can be used to locate genetic markers defined by traits observable only in whole organisms. Because chromosomal maps are based on estimates of physical distance, they are considered to be physical maps. The number of base pairs within a band can only be estimated.
Until recently, even the best chromosomal maps could be used to locate a DNA fragment only to a region of about 10 Mb, the size of a typical band seen on a chromosome. Improvements in fluorescence in situ hybridization (FISH) methods allow orientation of DNA sequences that lie as close as 2 to 5 Mb. Modifications to in situ hybridization methods, using chromosomes at a stage in cell division (interphase) when they are less compact, increase map resolution to around 100,000 bp. Further banding refinement might allow chromosomal bands to be associated with specific amplified DNA fragments, an improvement that could be useful in analyzing observable physical traits associated with chromosomal abnormalities.
cDNA map. A cDNA map shows the positions of expressed DNA regions (exons) relative to particular chromosomal regions or bands. (Expressed DNA regions are those transcribed into mRNA.) cDNA is synthesized in the laboratory using the mRNA molecule as a template; base-pairing rules are followed (i.e., an A on the mRNA molecule will pair with a T on the new DNA strand). This cDNA can then be mapped to genomic regions.
Because they represent expressed genomic regions, cDNAs are thought to identify the parts of the genome with the most biological and medical significance. A cDNA map can provide the chromosomal location for genes whose functions are currently unknown. For disease-gene hunters, the map can also suggest a set of candidate genes to test when the approximate location of a disease gene has been mapped by genetic linkage techniques.
High-Resolution Physical Mapping
The two current approaches to high-resolution physical mapping are termed “top-down” (producing a macrorestriction map) and “bottom-up” (resulting in a contig map). With either strategy (described below) the maps represent ordered sets of DNA fragments that are generated by cutting genomic DNA with restriction enzymes (see Restriction Enzymes box at right). The fragments are then amplified by cloning or by polymerase chain reaction (PCR) methods (see DNA Amplification). Electrophoretic techniques are used to separate the fragments according to size into different bands, which can be visualized by
14

direct DNA staining or by hybridization with DNA probes of interest. The use of purified chromosomes separated either by flow sorting from human cell lines or in hybrid cell lines allows a single chromosome to be mapped (see Separating Chromosomes box at right).
A number of strategies can be used to reconstruct the original order of the DNA fragments in the genome. Many approaches make use of the ability of single strands of DNA and/or RNA to hybridize—to form double-stranded segments by hydrogen bonding between complementary bases. The extent of sequence homology between the two strands can be
Restriction Enzymes: Microscopic Scalpels
Isolated from various bacteria, restriction enzymes recognize short DNA sequences and cut the DNA molecules at those specific sites. (A natural biological function of these enzymes is to protect bacteria by attacking viral and other foreign DNA.) Some restriction enzymes (rare-cutters) cut the DNA very infrequently, generating a small number of very large fragments (several thousand to a million bp). Most enzymes cut DNA more frequently, thus generating a large number of small fragments (less than a hundred to more than a thousand bp).
On average, restriction enzymes with
•4-base recognition sites will yield pieces 256 bases long,
•6-base recognition sites will yield pieces 4000 bases long, and
•8-base recognition sites will yield pieces 64,000 bases long.
Since hundreds of different restriction enzymes have been characterized, DNA can be cut into many different small fragments.
Separating Chromosomes
Flow sorting
Pioneered at Los Alamos National Laboratory (LANL), flow sorting employs flow cytometry to separate, according to size, chromosomes isolated from cells during cell division when they are condensed and stable. As the chromosomes flow singly past a laser beam, they are differen-tiated by analyzing the amount of DNA present, and individual chromosomes are directed to specific collection tubes.
Somatic cell hybridization
In somatic cell hybridization, human cells and rodent tumor cells are fused (hybridized); over time, after the chromosomes mix, human chromosomes are preferentially lost from the hybrid cell until only one or a few remain. Those individual hybrid cells are then propagated and maintained as cell lines containing specific human chromosomes. Improvements to this technique have generated a number of hybrid cell lines, each with a specific single human chromosome.
15

Primer on Molecular Genetics
inferred from the length of the double-stranded segment. Fingerprinting uses restriction map data to determine which fragments have a specific sequence (fingerprint) in common and therefore overlap. Another approach uses linking clones as probes for hybridization to chromosomal DNA cut with the same restriction enzyme.
Macrorestriction maps: Top-down mapping. In top-down mapping, a single chromosome is cut (with rare-cutter restriction enzymes) into large pieces, which are ordered and subdivided; the smaller pieces are then mapped further. The resulting macrorestriction maps depict the order of and distance between sites at which rare-cutter enzymes cleave (Fig. 9a). This approach yields maps with more continuity and fewer gaps between fragments than contig maps (see below), but map resolution is lower and may not be useful in finding particular genes; in addition, this strategy generally does not produce long stretches of mapped sites. Currently, this approach allows DNA pieces to be located in regions measuring about 100,000 bp to 1 Mb.
The development of pulsed-field gel (PFG) electrophoretic methods has improved the mapping and cloning of large DNA molecules. While conventional gel electrophoretic methods separate pieces less than 40 kb (1 kb = 1000 bases) in size, PFG separates molecules up to 10 Mb, allowing the application of both conventional and new mapping methods to larger genomic regions.
|
|
|
|
|
|
|
|
(a) |
|
|
|
|
|
|
|
|
|
|
|
|
|
|
|
|
|
(b) |
|||||||||||||||||||||||||||||||
|
|
|
|
|
|
Chromosome |
|
|
|
|
|
|
|
|
|
|
Linked Library |
||||||||||||||||||||||||||||||||||||||||
|
|
|
|
|
|
|
|
|
|
|
|
|
|
|
|
|
|
|
|
|
|
|
|
|
|
Detailed but incomplete |
|||||||||||||||||||||||||||||||
|
|
|
|
|
|
|
|
|
|
|
|
|
|
|
|
|
|
|
|
|
|
|
|
|
|
|
|
|
|
|
|
|
|
|
|
|
|
|
|
|
|
|
|
|
|
|
|
|
|
|
|
|
|
|
|
|
|
|
|
|
|
|
|
|
|
|
|
|
|
|
|
|
|
|
|
|
|
|
|
|
|
|
|
|
|
|
|
|
|
|
|
|
|
|
|
|
|
|
|
|
|
|
|
|
|
|
|
|
|
|
|
|
|
|
|
|
|
|
|
|
|
|
|
|
|
|
|
|
|
|
|
|
|
|
|
|
|
|
|
|
|
|
|
|
|
|
|
|
|
|
|
|
|
|
|
|
|
|
|
|
|
|
|
|
|
|
|
|
|
|
|
|
|
|
|
|
|
|
|
|
|
|
|
|
|
|
|
|
|
|
|
|
|
|
|
|
|
|
|
|
|
|
|
|
|
|
|
|
|
|
|
|
|
|
|
|
|
|
|
|
|
|
|
|
|
|
|
|
|
|
|
Top |
|
|
|
|
|
|
|
|
|
|
|
|
|
|
|
|
|
|
|
|
|
|
Contig |
Bottom |
|||||||||||||||||||||||||||||||||
|
|
|
|
|
|
|
|
|
|
|
|
|
|
|
|
|
|
|
|
|
|
|
|
|
|
|
|
|
|
|
|
|
|
|
|
|
|
|
|
|
|||||||||||||||||
|
|
|
|
|
|
|
|
|
|
|
|
|
|
|
|
|
|
|
|
|
|
|
|
|
|
|
|
|
|
|
|
|
|
|
|
|
|
|
|
|
|||||||||||||||||
|
|
|
|
|
|
|
|
|
|
|
|
|
|
|
|
|
|
|
|
|
|
|
|
|
|
|
|
|
|
|
|
|
|
|
|
|
|
|
|||||||||||||||||||
|
|
|
|
|
|
|
|
|
|
|
|
|
|
|
|
|
|
|
|
|
|
|
|
|
|
|
|
|
|
|
|
|
|
|
|
|
|
|
|||||||||||||||||||
|
|
|
|
|
|
|
|
|
|
|
|
|
|
|
|
|
|
|
|
|
|
|
|
|
|
|
|
|
|
|
|
|
|
|
|
|
|
|
|||||||||||||||||||
|
|
|
|
|
|
|
|
|
|
|
|
|
|
|
|
|
|
|
|
|
|
|
|
|
|
|
|
|
|
|
|
|
|
|
|
|
|
|
|||||||||||||||||||
Down |
|
|
|
|
|
|
|
|
|
|
|
|
|
|
|
|
|
|
|
|
|
|
|
|
|
|
|
|
|
|
|
|
|
|
|
|
|
|
|
|
|
Up |
|||||||||||||||
|
|
|
|
|
|
|
|
|
|
|
|
|
|
|
|
|
|
|
|
|
|
|
|
|
|
|
|
|
|
|
|
|
|
|
|
|
|
|
|||||||||||||||||||
|
|
|
|
|
|
|
|
|
|
|
|
|
|
|
|
|
|
|
|
|
|
|
|
|
|
|
|
|
|
|
|
|
|
|
|
|
|
|
|||||||||||||||||||
|
|
|
|
|
|
|
|
|
|
|
|
|
|
Fingerprint, map, sequence, or |
|||||||||||||||||||||||||||||||||||||||||||
|
|
|
|
|
|
|
|
|
|
|
|
|
|
|
|
|
|
|
|
|
|
|
|
|
|
|
|
|
|
|
|
||||||||||||||||||||||||||
|
|
|
|
|
|
|
|
|
|
|
|
|
|
|
|
|
|
|
|
|
|
|
|
|
|
|
|
|
|
|
hybridize to detect overlaps |
|
|||||||||||||||||||||||||
|
|
|
|
|
|
|
|
|
|
|
|
|
|
|
|
|
|
|
|
|
|
|
|
|
|
|
|
|
|
|
|
|
|
|
|
|
|
|
|
|
|
|
|
|
|
|
|
|
|
|
|
|
|
|
|
|
|
|
|
|
|
|
|
|
|
|
|
|
|
|
|
|
|
|
|
|
|
|
|
|
|
|
|
|
|
|
|
|
|
|
|
|
|
|
|
|
|
|
|
|
|
|
|
|
|
|
|
|
|
|
|
|
|
|
|
|
|
|
Macrorestriction Map |
|
|
|
|
|
|
|
|
|
|
|
|
|
|
|
|
|
|
|
|
|
|
|
|
|
|
|
|
|
|
|
|
|
|
|
|
|
|
|
|
|
|||||||||||||
|
|
|
|
|
|
|
|
|
|
Arrayed Library |
|||||||||||||||||||||||||||||||||||||||||||||||
|
|
|
Complete but low resolution |
|
|
|
|
|
|
|
|||||||||||||||||||||||||||||||||||||||||||||||
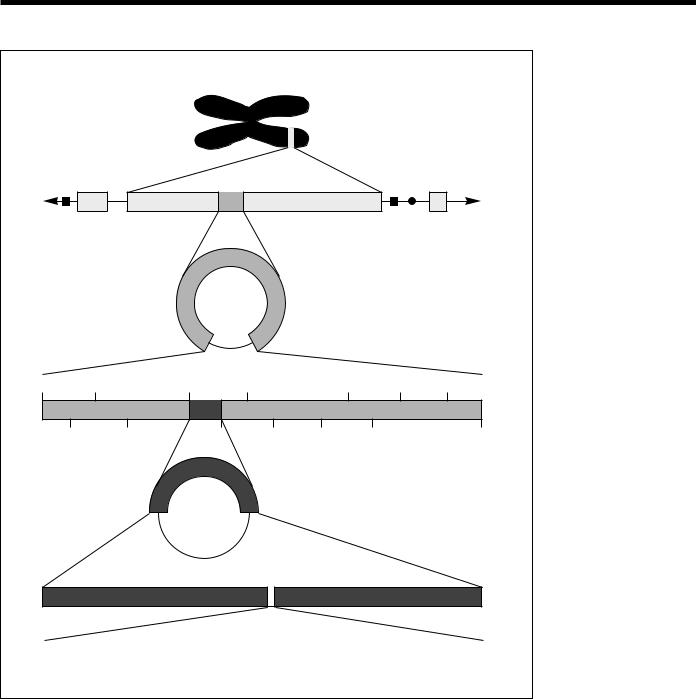
Fig. 9. Physical Mapping Strategies. Top-down physical mapping (a) produces maps with few gaps, but map resolution may not allow location of specific genes. Bottom-up strategies (b) generate extremely detailed maps of small areas but leave many gaps. A combination of both approaches is being used. [Source: Adapted from P. R. Billings et al., “New Techniques for Physical Mapping of the Human Genome,” The FASEB Journal 5(1), 29 (1991).]
16

Contig maps: Bottom-up mapping. The bottom-up approach involves cutting the chromosome into small pieces, each of which is cloned and ordered. The ordered fragments form contiguous DNA blocks (contigs). Currently, the resulting “library” of clones varies in size from 10,000 bp to 1 Mb (Fig. 9b). An advantage of this approach is the accessibility of these stable clones to other researchers. Contig construction can be verified by FISH, which localizes cosmids to specific regions within chromosomal bands.
Contig maps thus consist of a linked library of small overlapping clones representing a complete chromosomal segment. While useful for finding genes localized to a small area (under 2 Mb), contig maps are difficult to extend over large stretches of a chromosome because all regions are not clonable. DNA probe techniques can be used to fill in the gaps, but they are time consuming. Figure 10 is a diagram relating the different types of maps.
Technological improvements now make possible the cloning of large DNA pieces, using artificially constructed chromosome vectors that carry human DNA fragments as large as 1 Mb. These vectors are maintained in yeast cells as artificial chromosomes (YACs). (For more explanation, see DNA Amplification.) Before YACs were developed, the largest cloning vectors (cosmids) carried inserts of only 20 to 40 kb. YAC methodology drastically reduces the number of clones to be ordered; many YACs span entire human genes. A more detailed map of a large YAC insert can be produced by subcloning, a process in which fragments of the original insert are cloned into smaller-insert vectors. Because some YAC regions are unstable, large-capacity bacterial vectors (i.e., those that can accommodate large inserts) are also being developed.
Gene or
Polymorphism
GENETIC
MAP
RESTRICTION
FRAGMENTS
ORDERED
LIBRARY
SEQUENCE
ORNL-DWG 91M-17369
Gene or
Polymorphism
Fig. 10. Types of Genome Maps. At the coarsest resolution, the genetic map measures recombination frequency between linked markers (genes or polymorphisms). At the next resolution level, restriction fragments of 1 to 2 Mb can be separated and mapped. Ordered libraries of cosmids and YACs have insert sizes from 40 to 400 kb. The base sequence is the ultimate physical map. Chromosomal mapping (not shown) locates genetic sites in relation to bands on chromosomes (estimated resolution of
5 Mb); new in situ hybridization techniques can place loci 100 kb apart. These direct strategies link the other four mapping approaches diagramed here. [Source: see Fig. 9.]
17

Primer on Molecular Genetics
Sequencing Technologies
The ultimate physical map of the human genome is the complete DNA sequence—the determination of all base pairs on each chromosome. The completed map will provide biologists with a Rosetta stone for studying human biology and enable medical researchers to begin to unravel the mechanisms of inherited diseases. Much effort continues to be spent locating genes; if the full sequence were known, emphasis could shift to determining gene function. The Human Genome Project is creating research tools for 21st-century biology, when the goal will be to understand the sequence and functions of the genes residing therein.
Achieving the goals of the Human Genome Project will require substantial improvements in the rate, efficiency, and reliability of standard sequencing procedures. While technological advances are leading to the automation of standard DNA purification, separation, and detection steps, efforts are also focusing on the development of entirely new sequencing methods that may eliminate some of these steps. Sequencing procedures currently involve first subcloning DNA fragments from a cosmid or bacteriophage library into special sequencing vectors that carry shorter pieces of the original cosmid fragments (Fig. 11). The next step is to make the subcloned fragments into sets of nested fragments differing in length by one nucleotide, so that the specific base at the end of each successive fragment is detectable after the fragments have been separated by gel electrophoresis. Current sequencing technologies are discussed later.
18
|
|
|
|
|
|
|
ORNL-DWG 91M-17367 |
|
|
|
|
|
|
HUMAN |
|
|
|
|
|
|
|
|
CHROMOSOME |
|
||
Average 400,000-bp |
|
|
|
|
|
|
||
fragment cloned into YAC |
|
|
|
|
|
|
||
|
|
|
|
|
YEAST ARTIFICIAL CHROMOSOME (YAC) |
|||
Average 40,000-bp |
|
|
|
|
|
|
||
fragment cloned into cosmid |
|
|
|
|
|
|
||
|
|
|
|
|
COSMID |
|
|
|
EcoRI |
EcoRI |
|
EcoRI |
EcoRI |
EcoRI |
EcoRI |
EcoRI |
|
BamHI |
BamHI |
BamHI |
BamHI |
BamHI |
BamHI |
BamHI |
||
Average 4000-bp |
|
|
|
|
RESTRICTION MAP |
|||
|
|
|
|
|
|
|||
fragment cloned into |
|
|
|
|
|
|
||
plasmid or sequencing |
|
PLASMID |
|
|
|
|||
vector |
|
|
|
|
|
|
||
|
|
|
PARTIAL NUCLEOTIDE SEQUENCE |
|
|
|
||
|
|
|
(from human β-globin gene) |
|
|
|
||
GGCACTGACTCTCTCTGCCTATTGGTCTATTTTCCCACCCTTAGGCTGCTGGTGGTCTACCC |
||||||||
TGGACCCAGAGGTTCTTTGAGTCCTTTGGGGATCTGTCCACTCCTGATGCTGTTATGG. . . |
||||||||
Fig. 11. Constructing Clones for Sequencing. Cloned DNA molecules must be made progressively smaller and the fragments subcloned into new vectors to obtain fragments small enough for use with current sequencing technology. Sequencing results are compiled to provide longer stretches of sequence across a chromosome. (Source: adapted from David A. Micklos and Greg A. Freyer, DNA Science, A First Course in Recombinant DNA Technology, Burlington, N.C.: Carolina Biological Supply Company, 1990.)
19

DNA Amplification:
Cloning and Polymerase
Chain Reaction (PCR)
Cloning (in vivo DNA amplification)
Cloning involves the use of recombinant DNA technology to propagate DNA fragments inside a foreign host. The fragments are usually isolated from chromosomes using restriction enzymes and then united with a carrier (a vector). Following introduction into suitable host cells, the DNA fragments can then be reproduced along with the host cell DNA. Vectors are DNA molecules originating from viruses, bacteria, and yeast cells. They accommodate various sizes of foreign DNA fragments ranging from 12,000 bp for bacterial vectors (plasmids and cosmids) to
1 Mb for yeast vectors (yeast artificial chromosomes). Bacteria are most often the hosts for these inserts, but yeast and mammalian cells are also used (a).
Cloning procedures provide unlimited material for experimental study. A random (unordered) set of cloned DNA fragments is called a library.
Genomic libraries are sets of overlapping fragments encompassing an entire genome (b). Also available are chromosome-specific libraries, which consist of fragments derived from source DNA enriched for a particular chromosome. (See Separating Chromosomes box.)
(a)
|
|
|
ORNL-DWG 92M-6649 |
||
Cut DNA |
|
|
|
|
|
molecules |
|
|
|
|
|
with restriction |
|
|
Chromosomal DNA |
||
enzyme to |
|
|
|||
generate |
|
|
Fragment |
||
complementary |
|
|
To Be Cloned |
||
sequences on |
|
|
|||
|
|
|
|
|
|
Vector DNA the vector and |
|
|
|
|
|
the fragment |
|
|
|
|
|
Join vector and chromosomal DNA fragment, using
the enzyme DNA ligase
Recombinant DNA Molecule
Introduce into bacterium
 Recombinant
DNA Molecule
 Bacterial
Chromosome
(a) Cloning DNA in Plasmids. By fragmenting DNA of any origin (human, animal, or plant) and inserting it in the DNA of rapidly reproducing foreign cells, billions of copies of a single gene or DNA segment can be produced in a very short time. DNA to be cloned is inserted into a plasmid (a small, selfreplicating circular molecule of DNA) that is separate from chromosomal DNA. When the recombinant plasmid is introduced into bacteria, the newly inserted segment will be replicated along with the rest of the plasmid.
20