

world trade report 2012
C. Appendix figures and tables
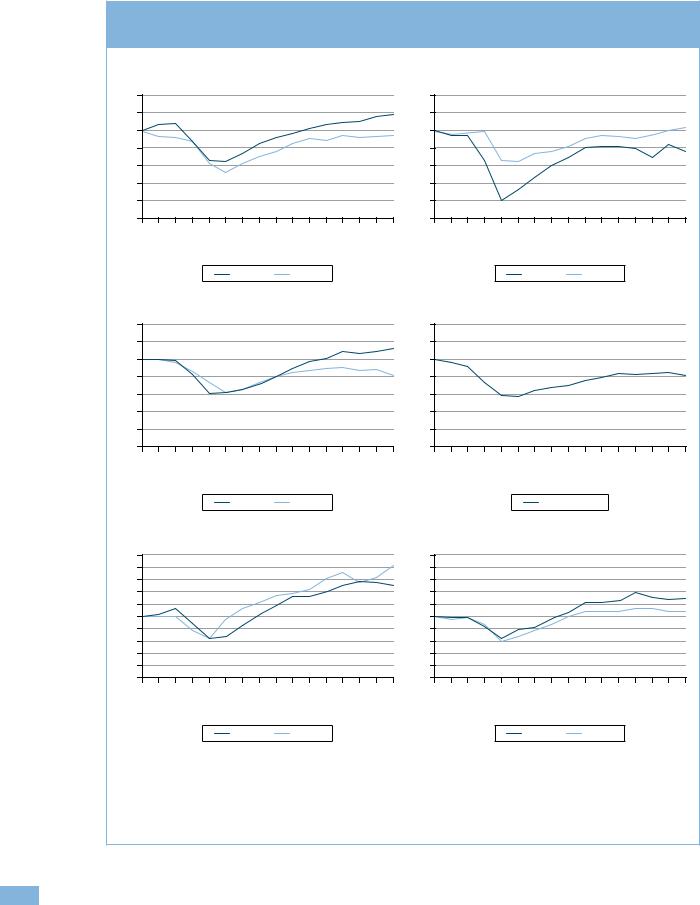
Appendix Figure 1: Seasonally adjusted quarterly merchandise trade volume indices, 2008Q1 – 2011Q4
(indices, 2008Q1 = 100)
United States
120 |
|
|
|
|
|
|
|
|
|
|
|
|
|
|
120 |
110 |
|
|
|
|
|
|
|
|
|
|
|
|
|
|
110 |
100 |
|
|
|
|
|
|
|
|
|
|
|
|
|
|
100 |
90 |
|
|
|
|
|
|
|
|
|
|
|
|
|
|
90 |
80 |
|
|
|
|
|
|
|
|
|
|
|
|
|
|
80 |
70 |
|
|
|
|
|
|
|
|
|
|
|
|
|
|
70 |
60 |
|
|
|
|
|
|
|
|
|
|
|
|
|
|
60 |
50 |
|
|
|
|
|
|
|
|
|
|
|
|
|
|
50 |
2008Q1 |
2008Q2 |
2008Q3 |
2008Q4 |
2009Q1 |
2009Q2 |
2009Q3 |
2009Q4 |
2010Q1 |
2010Q2 |
2010Q3 |
2010Q4 |
2011Q1 |
2011Q2 |
2011Q3 |
2011Q4 |
|
|
|
|
|
|
Exports |
|
Imports |
|
|
|
|
|||
|
|
|
|
|
|
|
Japan |
|
|
|
|
|
|
|
|
2008Q1 |
2008Q2 |
2008Q3 |
2008Q4 |
2009Q1 |
2009Q2 |
2009Q3 |
2009Q4 |
2010Q1 |
2010Q2 |
2010Q3 |
2010Q4 |
2011Q1 |
2011Q2 |
2011Q3 |
2011Q4 |
|
|
|
|
|
|
Exports |
|
Imports |
|
|
|
|
|||
European Union extra |
European Union intra |
120 |
|
|
|
|
|
|
|
|
|
|
|
|
|
|
120 |
110 |
|
|
|
|
|
|
|
|
|
|
|
|
|
|
110 |
100 |
|
|
|
|
|
|
|
|
|
|
|
|
|
|
100 |
90 |
|
|
|
|
|
|
|
|
|
|
|
|
|
|
90 |
80 |
|
|
|
|
|
|
|
|
|
|
|
|
|
|
80 |
70 |
|
|
|
|
|
|
|
|
|
|
|
|
|
|
70 |
60 |
|
|
|
|
|
|
|
|
|
|
|
|
|
|
60 |
50 |
|
|
|
|
|
|
|
|
|
|
|
|
|
|
50 |
2008Q1 |
2008Q2 |
2008Q3 |
2008Q4 |
2009Q1 |
2009Q2 |
2009Q3 |
2009Q4 |
2010Q1 |
2010Q2 |
2010Q3 |
2010Q4 |
2011Q1 |
2011Q2 |
2011Q3 |
2011Q4 |
|
|
|
|
|
|
Exports |
|
Imports |
|
|
|
|
|||
|
|
|
|
|
|
|
China |
|
|
|
|
|
|
|
|
150 |
|
|
|
|
|
|
|
|
|
|
|
|
|
|
150 |
140 |
|
|
|
|
|
|
|
|
|
|
|
|
|
|
140 |
130 |
|
|
|
|
|
|
|
|
|
|
|
|
|
|
130 |
120 |
|
|
|
|
|
|
|
|
|
|
|
|
|
|
120 |
110 |
|
|
|
|
|
|
|
|
|
|
|
|
|
|
110 |
100 |
|
|
|
|
|
|
|
|
|
|
|
|
|
|
100 |
90 |
|
|
|
|
|
|
|
|
|
|
|
|
|
|
90 |
80 |
|
|
|
|
|
|
|
|
|
|
|
|
|
|
80 |
70 |
|
|
|
|
|
|
|
|
|
|
|
|
|
|
70 |
60 |
|
|
|
|
|
|
|
|
|
|
|
|
|
|
60 |
50 |
|
|
|
|
|
|
|
|
|
|
|
|
|
|
50 |
2008Q1 |
2008Q2 |
2008Q3 |
2008Q4 |
2009Q1 |
2009Q2 |
2009Q3 |
2009Q4 |
2010Q1 |
2010Q2 |
2010Q3 |
2010Q4 |
2011Q1 |
2011Q2 |
2011Q3 |
2011Q4 |
|
|
|
|
|
|
Exports |
|
Imports |
|
|
|
|
|||
2008Q1 |
2008Q2 |
2008Q3 |
2008Q4 |
2009Q1 |
2009Q2 |
2009Q3 |
2009Q4 |
2010Q1 |
2010Q2 |
2010Q3 |
2010Q4 |
2011Q1 |
2011Q2 |
2011Q3 |
2011Q4 |
Intra-EU trade
Newly-industrialized economies (4) a
2008Q1 |
2008Q2 |
2008Q3 |
2008Q4 |
2009Q1 |
2009Q2 |
2009Q3 |
2009Q4 |
2010Q1 |
2010Q2 |
2010Q3 |
2010Q4 |
2011Q1 |
2011Q2 |
2011Q3 |
2011Q4 |
|
|
|
|
|
|
Exports |
|
Imports |
|
|
|
|
|||
a Hong Kong, China; Republic of Korea; Singapore; and Chinese Taipei.
Sources: National statistics and WTO Secretariat calculations. Seasonally adjusted figures for the United States, the European Union, Japan and Hong Kong, China are taken from national sources. Non-seasonally adjusted volume figures for other countries were seasonally adjusted by the Secretariat
26
I – World Trade in 2011
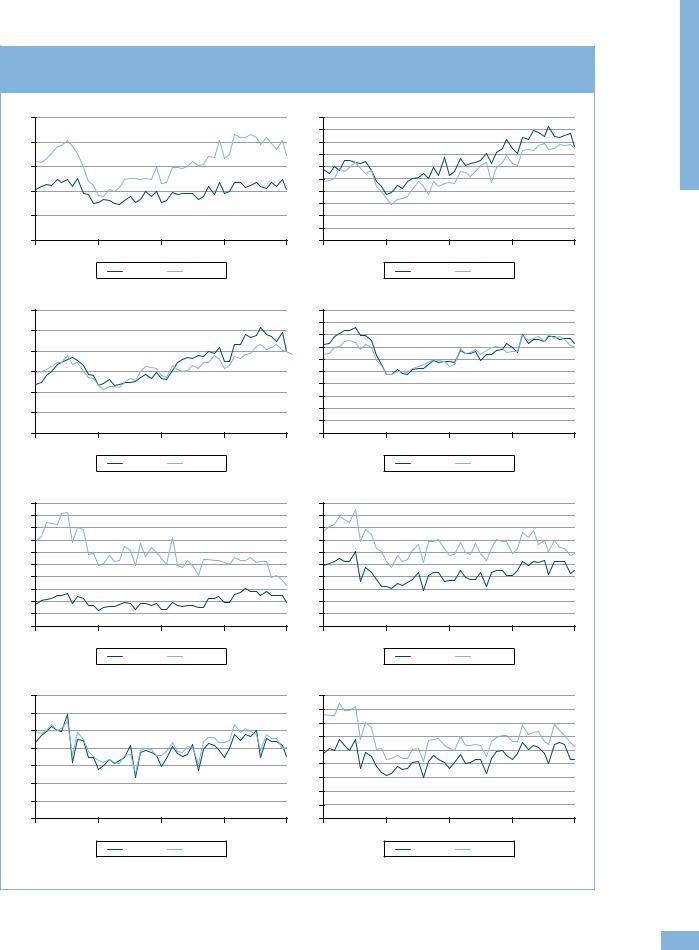
Appendix Figure 2: Monthly merchandise exports and imports of selected economies, January 2008-February 2012
(US$ billion)
25 |
Turkey |
|
20 |
|
|
||
|
|
|
18 |
20 |
|
|
16 |
|
|
|
14 |
15 |
|
|
12 |
|
|
|
10 |
10 |
|
|
8 |
|
|
|
6 |
5 |
|
|
4 |
|
|
|
2 |
0 |
|
|
0 |
2008 |
2009 |
2010 |
2011 |
|
Exports |
Imports |
|
|
Australia |
|
|
30 |
|
|
50 |
25 |
|
|
45 |
|
|
40 |
|
|
|
|
|
20 |
|
|
35 |
|
|
30 |
|
|
|
|
|
15 |
|
|
25 |
10 |
|
|
20 |
|
|
15 |
|
|
|
|
|
5 |
|
|
10 |
|
|
5 |
|
|
|
|
|
0 |
|
|
0 |
2008 |
2009 |
2010 |
2011 |
|
Exports |
Imports |
|
|
Greece |
|
|
10 |
|
|
10 |
9 |
|
|
9 |
8 |
|
|
8 |
7 |
|
|
7 |
6 |
|
|
6 |
5 |
|
|
5 |
4 |
|
|
4 |
3 |
|
|
3 |
2 |
|
|
2 |
1 |
|
|
1 |
0 |
|
|
0 |
2008 |
2009 |
2010 |
2011 |
|
Exports |
Imports |
|
70 |
Italy |
|
45 |
|
|
||
60 |
|
|
40 |
|
|
35 |
|
50 |
|
|
|
|
|
30 |
|
|
|
|
|
40 |
|
|
25 |
30 |
|
|
20 |
20 |
|
|
15 |
|
|
10 |
|
10 |
|
|
|
|
|
5 |
|
|
|
|
|
0 |
|
|
0 |
2008 |
2009 |
2010 |
2011 |
|
Exports |
Imports |
|
|
Indonesia |
|
|
2008 |
2009 |
2010 |
2011 |
|
Exports |
Imports |
|
|
Canada |
|
|
2008 |
2009 |
2010 |
2011 |
|
Exports |
Imports |
|
|
Portugal |
|
|
2008 |
2009 |
2010 |
2011 |
|
Exports |
Imports |
|
|
Spain |
|
|
2008 |
2009 |
2010 |
2011 |
|
Exports |
Imports |
|
Sources: IMF International Financial Statistics, Global Trade Information Services GTA database, national statistics.
Appendixfigures.C andtables
27

world trade report 2012
Appendix Table 1: World merchandise trade by region and selected economies, 2011
(US$ billion and percentage)
|
|
|
|
Exports |
|
|
|
|
|
Imports |
|
|
|
|
|
|
|
|
|
|
|
||||
|
Value |
|
Annual percentage change |
|
|
Value |
Annual percentage change |
|
||||
|
|
|
|
|
|
|
|
|
|
|
|
|
|
2011 |
2005-11 |
2009 |
2010 |
2011 |
2011 |
2005-11 |
2009 |
2010 |
2011 |
||
|
|
|
|
|
|
|
|
|
|
|
|
|
World |
17,779 |
10 |
-23 |
22 |
20 |
18,000 |
9 |
-23 |
21 |
19 |
||
|
|
|
|
|
|
|
|
|
|
|
|
|
North America |
2,283 |
8 |
-21 |
23 |
16 |
3,090 |
5 |
-25 |
23 |
15 |
||
|
|
|
|
|
|
|
|
|
|
|
|
|
United States |
1,481 |
9 |
-18 |
21 |
16 |
2,265 |
5 |
-26 |
23 |
15 |
||
|
|
|
|
|
|
|
|
|
|
|
|
|
Canadaa |
452 |
|
4 |
-31 |
23 |
17 |
|
462 |
6 |
-21 |
22 |
15 |
Mexico |
350 |
9 |
-21 |
30 |
17 |
361 |
8 |
-24 |
28 |
16 |
||
|
|
|
|
|
|
|
|
|
|
|
|
|
South and Central |
|
|
|
|
|
|
|
|
|
|
|
|
Americab |
749 |
|
13 |
-23 |
26 |
27 |
|
727 |
16 |
-25 |
30 |
24 |
Brazil |
256 |
14 |
-23 |
32 |
27 |
237 |
20 |
-27 |
43 |
24 |
||
|
|
|
|
|
|
|
|
|
|
|
|
|
Other South and |
|
|
|
|
|
|
|
|
|
|
|
|
Central Americab |
493 |
|
12 |
-24 |
22 |
27 |
|
490 |
14 |
-25 |
24 |
25 |
Europe |
6,601 |
7 |
-22 |
12 |
17 |
6,854 |
7 |
-25 |
13 |
17 |
||
|
|
|
|
|
|
|
|
|
|
|
|
|
European Union (27) |
6,029 |
7 |
-22 |
12 |
17 |
6,241 |
7 |
-25 |
13 |
16 |
||
|
|
|
|
|
|
|
|
|
|
|
|
|
Germany |
1,474 |
7 |
-23 |
12 |
17 |
1,254 |
8 |
-22 |
14 |
19 |
||
|
|
|
|
|
|
|
|
|
|
|
|
|
France |
597 |
4 |
-21 |
8 |
14 |
715 |
6 |
-22 |
9 |
17 |
||
|
|
|
|
|
|
|
|
|
|
|
|
|
Netherlands |
660 |
8 |
-22 |
15 |
15 |
597 |
9 |
-24 |
17 |
16 |
||
|
|
|
|
|
|
|
|
|
|
|
|
|
United Kingdom |
473 |
4 |
-23 |
15 |
17 |
636 |
4 |
-24 |
16 |
13 |
||
|
|
|
|
|
|
|
|
|
|
|
|
|
Italy |
523 |
6 |
-25 |
10 |
17 |
557 |
6 |
-26 |
17 |
14 |
||
|
|
|
|
|
|
|
|
|
|
|
|
|
Commonwealth of |
|
|
|
|
|
|
|
|
|
|
|
|
Independent States (CIS) |
788 |
15 |
-36 |
31 |
34 |
540 |
17 |
-33 |
24 |
30 |
||
|
|
|
|
|
|
|
|
|
|
|
|
|
Russian Federationa |
522 |
|
14 |
-36 |
32 |
30 |
|
323 |
17 |
-34 |
30 |
30 |
Africa |
597 |
11 |
-30 |
29 |
17 |
555 |
14 |
-15 |
15 |
18 |
||
|
|
|
|
|
|
|
|
|
|
|
|
|
South Africa |
97 |
11 |
-24 |
31 |
20 |
122 |
12 |
-27 |
27 |
29 |
||
|
|
|
|
|
|
|
|
|
|
|
|
|
Africa less South Africa |
500 |
12 |
-31 |
29 |
17 |
433 |
14 |
-12 |
12 |
15 |
||
|
|
|
|
|
|
|
|
|
|
|
|
|
Oil exportersc |
331 |
|
11 |
-38 |
34 |
15 |
|
160 |
15 |
-9 |
8 |
11 |
Non oil exporters |
169 |
13 |
-14 |
21 |
20 |
274 |
14 |
-14 |
15 |
18 |
||
|
|
|
|
|
|
|
|
|
|
|
|
|
Middle East |
1,228 |
15 |
-31 |
27 |
37 |
665 |
12 |
-15 |
13 |
16 |
||
|
|
|
|
|
|
|
|
|
|
|
|
|
Asia |
5,534 |
12 |
-18 |
31 |
18 |
5,568 |
13 |
-20 |
33 |
23 |
||
|
|
|
|
|
|
|
|
|
|
|
|
|
China |
1,899 |
16 |
-16 |
31 |
20 |
1,743 |
18 |
-11 |
39 |
25 |
||
|
|
|
|
|
|
|
|
|
|
|
|
|
Japan |
823 |
6 |
-26 |
33 |
7 |
854 |
9 |
-28 |
26 |
23 |
||
|
|
|
|
|
|
|
|
|
|
|
|
|
India |
297 |
20 |
-15 |
33 |
35 |
451 |
21 |
-20 |
36 |
29 |
||
|
|
|
|
|
|
|
|
|
|
|
|
|
Newly-industrialized |
|
|
|
|
|
|
|
|
|
|
|
|
economies (4)d |
1,290 |
10 |
-17 |
30 |
16 |
1,302 |
10 |
-24 |
32 |
18 |
||
Memorandum |
|
|
|
|
|
|
|
|
|
|
|
|
|
|
|
|
|
|
|
|
|
|
|
|
|
MERCOSURe |
354 |
|
14 |
-22 |
29 |
26 |
|
334 |
20 |
-28 |
43 |
25 |
ASEANf |
1,244 |
|
11 |
-18 |
29 |
18 |
|
1,151 |
11 |
-23 |
31 |
21 |
EU (27) extra-trade |
2,131 |
8 |
-20 |
17 |
19 |
2,344 |
8 |
-27 |
19 |
17 |
||
|
|
|
|
|
|
|
|
|
|
|
|
|
Least-developed countries |
|
|
|
|
|
|
|
|
|
|
|
|
(LDCs) |
203 |
16 |
-25 |
27 |
25 |
202 |
15 |
-5 |
11 |
19 |
||
a.Imports are valued f.o.b.
b.Includes the Caribbean. For composition of groups see the Technical Notes of WTO, International Trade Statistics, 2011.
c.Algeria, Angola, Cameroon, Chad, Congo, Equatorial Guinea, Gabon, Libya, Nigeria, Sudan.
d.Hong Kong, China; Republic of Korea; Singapore; and Chinese Taipei.
e.Common Market of the Southern Cone: Argentina, Brazil, Paraguay, Uruguay.
f.Association of Southeast Asian Nations: Brunei Darussalam, Cambodia, Indonesia, Laos, Malaysia, Myanmar, Philippines, Singapore, Thailand, Viet Nam.
Source: WTO Secretariat.
28
I – World Trade in 2011
Appendix Table 2: World trade in commercial services by region and selected country, 2011
(US$ billion and percentage)
|
|
|
|
Exports |
|
|
|
|
|
|
Imports |
|
|
|
|
|
|
|
|
|
|
|
|
||||
|
Value |
|
Annual percentage change |
|
|
Value |
|
Annual percentage change |
|
||||
|
|
|
|
|
|
|
|
|
|
|
|
|
|
|
2011 |
2005-11 |
2009 |
2010 |
2011 |
2011 |
2005-11 |
2009 |
2010 |
2011 |
|||
|
|
|
|
|
|
|
|
|
|
|
|
|
|
World |
4,150 |
9 |
-11 |
10 |
11 |
3,865 |
9 |
-11 |
10 |
10 |
|||
|
|
|
|
|
|
|
|
|
|
|
|
|
|
North America |
668 |
8 |
-7 |
9 |
10 |
516 |
6 |
-8 |
8 |
8 |
|||
|
|
|
|
|
|
|
|
|
|
|
|
|
|
United States |
578 |
8 |
-6 |
9 |
11 |
391 |
6 |
-7 |
6 |
6 |
|||
|
|
|
|
|
|
|
|
|
|
|
|
|
|
South and Central |
|
|
|
|
|
|
|
|
|
|
|
|
|
Americaa |
130 |
|
11 |
-8 |
15 |
14 |
|
163 |
|
15 |
-8 |
23 |
18 |
Brazil |
37 |
16 |
-9 |
15 |
21 |
73 |
22 |
-1 |
36 |
22 |
|||
|
|
|
|
|
|
|
|
|
|
|
|
|
|
Europe |
1,964 |
7 |
-13 |
4 |
10 |
1,605 |
6 |
-13 |
3 |
8 |
|||
|
|
|
|
|
|
|
|
|
|
|
|
|
|
European Union (27) |
1,762 |
7 |
-13 |
4 |
10 |
1,480 |
6 |
-12 |
2 |
4 |
|||
|
|
|
|
|
|
|
|
|
|
|
|
|
|
Germany |
253 |
8 |
-9 |
3 |
9 |
284 |
5 |
-12 |
3 |
8 |
|||
|
|
|
|
|
|
|
|
|
|
|
|
|
|
United Kingdom |
274 |
5 |
-14 |
2 |
11 |
171 |
1 |
-19 |
1 |
7 |
|||
|
|
|
|
|
|
|
|
|
|
|
|
|
|
France |
161 |
5 |
-13 |
1 |
11 |
141 |
5 |
-8 |
2 |
7 |
|||
|
|
|
|
|
|
|
|
|
|
|
|
|
|
Netherlands |
128 |
6 |
-9 |
4 |
11 |
118 |
6 |
-3 |
-2 |
12 |
|||
|
|
|
|
|
|
|
|
|
|
|
|
|
|
Spain |
141 |
7 |
-14 |
1 |
14 |
91 |
5 |
-17 |
0 |
5 |
|||
|
|
|
|
|
|
|
|
|
|
|
|
|
|
Commonwealth of |
|
|
|
|
|
|
|
|
|
|
|
|
|
Independent States (CIS) |
96 |
15 |
-17 |
13 |
20 |
133 |
15 |
-19 |
19 |
21 |
|||
|
|
|
|
|
|
|
|
|
|
|
|
|
|
Russian Federation |
54 |
14 |
-19 |
8 |
22 |
90 |
16 |
-20 |
22 |
24 |
|||
|
|
|
|
|
|
|
|
|
|
|
|
|
|
Ukraine |
19 |
13 |
-23 |
24 |
13 |
14 |
13 |
-30 |
10 |
19 |
|||
|
|
|
|
|
|
|
|
|
|
|
|
|
|
Africa |
85 |
7 |
-10 |
11 |
-0 |
149 |
13 |
-12 |
10 |
9 |
|||
|
|
|
|
|
|
|
|
|
|
|
|
|
|
South Africa |
15 |
5 |
-6 |
17 |
8 |
20 |
9 |
-13 |
25 |
13 |
|||
|
|
|
|
|
|
|
|
|
|
|
|
|
|
Egypt |
19 |
5 |
-14 |
11 |
-20 |
13 |
5 |
-22 |
2 |
-0 |
|||
|
|
|
|
|
|
|
|
|
|
|
|
|
|
Morocco |
14 |
11 |
-7 |
2 |
14 |
6 |
13 |
-6 |
8 |
11 |
|||
|
|
|
|
|
|
|
|
|
|
|
|
|
|
Middle East |
111 |
|
… |
-3 |
6 |
10 |
210 |
|
… |
-7 |
9 |
10 |
|
|
|
|
|
|
|
|
|
|
|
|
|
|
|
Saudi Arabia, Kingdom of |
12 |
|
… |
3 |
10 |
17 |
55 |
|
… |
-5 |
8 |
8 |
|
|
|
|
|
|
|
|
|
|
|
|
|
|
|
Israel |
26 |
7 |
-10 |
13 |
6 |
20 |
7 |
-14 |
6 |
14 |
|||
|
|
|
|
|
|
|
|
|
|
|
|
|
|
Asia |
1,096 |
13 |
-11 |
23 |
12 |
1,091 |
11 |
-10 |
21 |
14 |
|||
|
|
|
|
|
|
|
|
|
|
|
|
|
|
China |
182 |
16 |
-12 |
32 |
7 |
236 |
19 |
0 |
22 |
23 |
|||
|
|
|
|
|
|
|
|
|
|
|
|
|
|
Japan |
143 |
6 |
-14 |
10 |
3 |
165 |
5 |
-12 |
6 |
6 |
|||
|
|
|
|
|
|
|
|
|
|
|
|
|
|
India |
148 |
19 |
-13 |
33 |
20 |
130 |
19 |
-9 |
45 |
12 |
|||
|
|
|
|
|
|
|
|
|
|
|
|
|
|
Singapore |
125 |
14 |
-6 |
20 |
12 |
110 |
12 |
-9 |
22 |
15 |
|||
|
|
|
|
|
|
|
|
|
|
|
|
|
|
Korea, Republic of |
94 |
12 |
-19 |
19 |
8 |
98 |
9 |
-17 |
19 |
3 |
|||
|
|
|
|
|
|
|
|
|
|
|
|
|
|
Hong Kong, China |
121 |
11 |
-6 |
23 |
14 |
56 |
9 |
-7 |
16 |
10 |
|||
|
|
|
|
|
|
|
|
|
|
|
|
|
|
Australia |
50 |
9 |
-8 |
15 |
6 |
59 |
12 |
-13 |
22 |
18 |
|||
|
|
|
|
|
|
|
|
|
|
|
|
|
|
Memorandum item |
|
|
|
|
|
|
|
|
|
|
|
|
|
|
|
|
|
|
|
|
|
|
|
|
|
|
|
Extra-EU(27) trade |
789 |
8 |
-13 |
6 |
12 |
639 |
7 |
-13 |
4 |
8 |
|||
a. Includes the Caribbean. For composition of groups see Chapter IV Metadata of WTO International Trade Statistics, 2011.
Note: While provisional full-year data were available in early March for 50 countries accounting for more than two-thirds of world commercial services trade, estimates for most other countries are based on data for the first three-quarters.
Source: WTO and UNCTAD Secretariats.
Appendixfigures.C andtables
29

world trade report 2012
Appendix Table 3: Merchandise trade: leading exporters and importers, 2011
(US$ billion and percentage)
|
|
|
|
Annual |
Rank |
Exporters |
Value |
Share |
percentage |
|
|
|
|
change |
|
|
|
|
|
1 |
China |
1,899 |
10.4 |
20 |
|
|
|
|
|
2 |
United States |
1,481 |
8.1 |
16 |
|
|
|
|
|
3 |
Germany |
1,474 |
8.1 |
17 |
|
|
|
|
|
4 |
Japan |
823 |
4.5 |
7 |
|
|
|
|
|
5 |
Netherlands |
660 |
3.6 |
15 |
|
|
|
|
|
6 |
France |
597 |
3.3 |
14 |
|
|
|
|
|
7 |
Korea, Republic of |
555 |
3.0 |
19 |
|
|
|
|
|
8 |
Italy |
523 |
2.9 |
17 |
|
|
|
|
|
9 |
Russian Federation |
522 |
2.9 |
30 |
|
|
|
|
|
10 |
Belgium |
476 |
2.6 |
17 |
|
|
|
|
|
|
|
|
|
|
11 |
United Kingdom |
473 |
2.6 |
17 |
|
|
|
|
|
12 |
Hong Kong, China |
456 |
2.5 |
14 |
|
|
|
|
|
|
domestic exports |
17 |
0.1 |
14 |
|
|
|
|
|
|
re-exports |
439 |
2.4 |
14 |
|
|
|
|
|
13 |
Canada |
452 |
2.5 |
17 |
|
|
|
|
|
14 |
Singapore |
410 |
2.2 |
16 |
|
|
|
|
|
|
domestic exports |
224 |
1.2 |
23 |
|
|
|
|
|
|
re-exports |
186 |
1.0 |
10 |
|
|
|
|
|
15 |
Saudi Arabia, Kingdom ofc |
365 |
2.0 |
45 |
16 |
Mexico |
350 |
1.9 |
17 |
|
|
|
|
|
17 |
Taipei, Chinese |
308 |
1.7 |
12 |
|
|
|
|
|
18 |
Spain |
297 |
1.6 |
17 |
|
|
|
|
|
19 |
India |
297 |
1.6 |
35 |
|
|
|
|
|
20 |
United Arab Emiratesc |
285 |
1.6 |
30 |
21 |
Australia |
271 |
1.5 |
27 |
|
|
|
|
|
22 |
Brazil |
256 |
1.4 |
27 |
|
|
|
|
|
23 |
Switzerland |
235 |
1.3 |
20 |
|
|
|
|
|
24 |
Thailand |
229 |
1.3 |
17 |
|
|
|
|
|
25 |
Malaysia |
227 |
1.2 |
14 |
|
|
|
|
|
26 |
Indonesia |
201 |
1.1 |
27 |
|
|
|
|
|
27 |
Poland |
187 |
1.0 |
17 |
|
|
|
|
|
28 |
Sweden |
187 |
1.0 |
18 |
|
|
|
|
|
29 |
Austria |
179 |
1.0 |
17 |
|
|
|
|
|
30 |
Czech Republic |
162 |
0.9 |
22 |
|
|
|
|
|
|
Total of aboved |
14,835 |
81.4 |
- |
|
Worldd |
18,215 |
100.0 |
19 |
|
|
|
|
Annual |
Rank |
Importers |
Value |
Share |
percentage |
|
|
|
|
change |
|
|
|
|
|
1 |
United States |
2,265 |
12.3 |
15 |
|
|
|
|
|
2 |
China |
1,743 |
9.5 |
25 |
|
|
|
|
|
3 |
Germany |
1,254 |
6.8 |
19 |
|
|
|
|
|
4 |
Japan |
854 |
4.6 |
23 |
|
|
|
|
|
5 |
France |
715 |
3.9 |
17 |
|
|
|
|
|
6 |
United Kingdom |
636 |
3.5 |
13 |
|
|
|
|
|
7 |
Netherlands |
597 |
3.2 |
16 |
|
|
|
|
|
8 |
Italy |
557 |
3.0 |
14 |
|
|
|
|
|
9 |
Korea, Republic of |
524 |
2.9 |
23 |
|
|
|
|
|
10 |
Hong Kong, China |
511 |
2.8 |
16 |
|
|
|
|
|
|
retained imports |
130 |
0.7 |
16 |
|
|
|
|
|
11 |
Canadaa |
462 |
2.5 |
15 |
12 |
Belgium |
461 |
2.5 |
17 |
|
|
|
|
|
|
|
|
|
|
|
|
|
|
|
13 |
India |
451 |
2.5 |
29 |
|
|
|
|
|
14 |
Singapore |
366 |
2.0 |
18 |
|
|
|
|
|
|
retained importsb |
180 |
1.0 |
27 |
|
|
|
|
|
15 |
Spain |
362 |
2.0 |
11 |
|
|
|
|
|
16 |
Mexico |
361 |
2.0 |
16 |
|
|
|
|
|
17 |
Russian Federationa |
323 |
1.8 |
30 |
18 |
Taipei, Chinese |
281 |
1.5 |
12 |
|
|
|
|
|
19 |
Australia |
244 |
1.3 |
21 |
|
|
|
|
|
20 |
Turkey |
241 |
1.3 |
30 |
|
|
|
|
|
21 |
Brazil |
237 |
1.3 |
24 |
|
|
|
|
|
22 |
Thailand |
228 |
1.2 |
25 |
|
|
|
|
|
23 |
Switzerland |
208 |
1.1 |
18 |
|
|
|
|
|
24 |
Poland |
208 |
1.1 |
17 |
|
|
|
|
|
25 |
United Arab Emiratesc |
205 |
1.1 |
28 |
26 |
Austria |
192 |
1.0 |
20 |
|
|
|
|
|
27 |
Malaysia |
188 |
1.0 |
14 |
|
|
|
|
|
28 |
Indonesia |
176 |
1.0 |
30 |
|
|
|
|
|
29 |
Sweden |
175 |
1.0 |
18 |
|
|
|
|
|
30 |
Czech Republic |
151 |
0.8 |
20 |
|
|
|
|
|
|
Total of aboved |
15,180 |
82.6 |
- |
|
Worldd |
18,380 |
100.0 |
19 |
a.Imports are valued f.o.b.
b.Singapore’s retained imports are defined as imports less re-exports.
c.Secretariat estimates.
d.Includes significant re-exports or imports for re-export.
Source: WTO Secretariat.
30

I – World Trade in 2011
Appendix Table 4: Merchandise trade: leading exporters and importers (excluding intra-EU (27) trade), 2011
(US$ billion and percentage)
|
|
|
|
Annual |
Rank |
Exporters |
Value |
Share |
percentage |
|
|
|
|
change |
|
|
|
|
|
1 |
Extra-EU(27) exports |
2,131 |
14.9 |
19 |
|
|
|
|
|
2 |
China |
1,899 |
13.3 |
20 |
|
|
|
|
|
3 |
United States |
1,481 |
10.3 |
16 |
|
|
|
|
|
4 |
Japan |
823 |
5.7 |
7 |
|
|
|
|
|
5 |
Korea, Republic of |
555 |
3.9 |
19 |
|
|
|
|
|
6 |
Russian Federation |
522 |
3.6 |
30 |
|
|
|
|
|
|
|
|
|
|
7 |
Hong Kong, China |
456 |
3.2 |
14 |
|
|
|
|
|
|
domestic exports |
17 |
0.1 |
14 |
|
|
|
|
|
|
re-exports |
439 |
3.1 |
14 |
|
|
|
|
|
8 |
Canada |
452 |
3.2 |
17 |
|
|
|
|
|
9 |
Singapore |
410 |
2.9 |
16 |
|
|
|
|
|
|
domestic exports |
224 |
1.6 |
23 |
|
|
|
|
|
|
re-exports |
186 |
1.3 |
10 |
|
|
|
|
|
10 |
Saudi Arabia, Kingdom ofc |
365 |
2.5 |
45 |
11 |
Mexico |
350 |
2.4 |
17 |
|
|
|
|
|
12 |
Taipei, Chinese |
308 |
2.2 |
12 |
|
|
|
|
|
13 |
India |
297 |
2.1 |
35 |
|
|
|
|
|
14 |
United Arab Emiratesc |
285 |
2.0 |
30 |
15 |
Australia |
271 |
1.9 |
27 |
|
|
|
|
|
16 |
Brazil |
256 |
1.8 |
27 |
|
|
|
|
|
17 |
Switzerland |
235 |
1.6 |
20 |
|
|
|
|
|
18 |
Thailand |
229 |
1.6 |
17 |
|
|
|
|
|
19 |
Malaysia |
227 |
1.6 |
14 |
|
|
|
|
|
20 |
Indonesia |
201 |
1.4 |
27 |
|
|
|
|
|
21 |
Norway |
159 |
1.1 |
21 |
|
|
|
|
|
22 |
Turkey |
135 |
0.9 |
19 |
|
|
|
|
|
23 |
Iranc |
131 |
0.9 |
30 |
24 |
Nigeriac |
119 |
0.8 |
42 |
25 |
Kuwait, State ofc |
98 |
0.7 |
46 |
26 |
Qatarc |
98 |
0.7 |
58 |
27 |
South Africa |
97 |
0.7 |
20 |
|
|
|
|
|
28 |
Viet Nam |
97 |
0.7 |
34 |
|
|
|
|
|
29 |
Venezuela, Bolivarian |
93 |
0.6 |
41 |
|
Rep. of |
|
|
|
|
|
|
|
|
30 |
Kazakhstan |
88 |
0.6 |
48 |
|
|
|
|
|
|
Total of aboved |
12,865 |
89.8 |
- |
|
Worldd (excl. Intra- |
14,320 |
100.0 |
20 |
|
EU(27)) |
|
|
|
|
|
|
|
Annual |
Rank |
Importers |
Value |
Share |
percentage |
|
|
|
|
change |
|
|
|
|
|
1 |
Extra-EU(27) imports |
2,344 |
16.2 |
17 |
|
|
|
|
|
2 |
United States |
2,265 |
15.6 |
15 |
|
|
|
|
|
3 |
China |
1,743 |
12.0 |
25 |
|
|
|
|
|
4 |
Japan |
854 |
5.9 |
23 |
|
|
|
|
|
5 |
Korea, Republic of |
524 |
3.6 |
23 |
|
|
|
|
|
6 |
Hong Kong, China |
511 |
3.5 |
16 |
|
|
|
|
|
|
retained imports |
130 |
0.9 |
16 |
|
|
|
|
|
7 |
Canadaa |
462 |
3.2 |
15 |
|
|
|
|
|
|
|
|
|
|
8 |
India |
451 |
3.1 |
29 |
|
|
|
|
|
9 |
Singapore |
366 |
2.5 |
18 |
|
|
|
|
|
|
retained importsb |
180 |
1.2 |
27 |
|
|
|
|
|
10 |
Mexico |
361 |
2.5 |
16 |
|
|
|
|
|
11 |
Russian Federationa |
323 |
2.2 |
30 |
12 |
Taipei, Chinese |
281 |
1.9 |
12 |
|
|
|
|
|
13 |
Australia |
244 |
1.7 |
21 |
|
|
|
|
|
14 |
Turkey |
241 |
1.7 |
30 |
|
|
|
|
|
15 |
Brazil |
237 |
1.6 |
24 |
|
|
|
|
|
16 |
Thailand |
228 |
1.6 |
25 |
|
|
|
|
|
17 |
Switzerland |
208 |
1.4 |
18 |
|
|
|
|
|
18 |
United Arab Emiratesc |
205 |
1.4 |
28 |
19 |
Malaysia |
188 |
1.3 |
14 |
|
|
|
|
|
20 |
Indonesia |
176 |
1.2 |
30 |
|
|
|
|
|
21 |
South Africa |
122 |
0.8 |
29 |
|
|
|
|
|
22 |
Saudi Arabia, |
112 |
0.8 |
5 |
|
Kingdom of |
|
|
|
|
|
|
|
|
23 |
Viet Nam |
107 |
0.7 |
26 |
|
|
|
|
|
24 |
Norway |
91 |
0.6 |
17 |
|
|
|
|
|
25 |
Ukraine |
83 |
0.6 |
36 |
|
|
|
|
|
26 |
Israel |
76 |
0.5 |
24 |
|
|
|
|
|
27 |
Chile |
74 |
0.5 |
26 |
|
|
|
|
|
28 |
Argentina |
74 |
0.5 |
31 |
|
|
|
|
|
29 |
Iranc |
68 |
0.5 |
5 |
|
|
|
|
|
30 |
Philippinesc |
64 |
0.4 |
9 |
|
Total of aboved |
13,085 |
90.3 |
- |
|
Worldd (excl. |
14,485 |
100.0 |
20 |
|
Intra-EU(27)) |
|
|
|
a.Imports are valued f.o.b.
b.Singapore’s retained imports are defined as imports less re-exports.
c.Secretariat estimates.
d.Includes significant re-exports or imports for re-export.
Source: WTO Secretariat.
Appendixfigures.C andtables
31

world trade report 2012
Appendix Table 5: Leading exporters and importers in world trade in commercial services, 2011
(US$ billion and percentage)
|
|
|
|
Annual |
Rank |
Exporters |
Value |
Share |
percentage |
|
|
|
|
change |
|
|
|
|
|
1 |
United States |
578 |
13.9 |
11 |
|
|
|
|
|
2 |
United Kingdom |
274 |
6.6 |
11 |
|
|
|
|
|
3 |
Germany |
253 |
6.1 |
9 |
|
|
|
|
|
4 |
China |
182 |
4.4 |
7 |
|
|
|
|
|
5 |
France |
161 |
3.9 |
11 |
|
|
|
|
|
6 |
India |
148 |
3.6 |
20 |
|
|
|
|
|
7 |
Japan |
143 |
3.4 |
3 |
|
|
|
|
|
8 |
Spain |
141 |
3.4 |
14 |
|
|
|
|
|
9 |
Netherlands |
128 |
3.1 |
11 |
|
|
|
|
|
10 |
Singapore |
125 |
3.0 |
12 |
|
|
|
|
|
11 |
Hong Kong, China |
121 |
2.9 |
14 |
|
|
|
|
|
12 |
Ireland |
107 |
2.6 |
10 |
|
|
|
|
|
13 |
Italy |
107 |
2.6 |
9 |
|
|
|
|
|
14 |
Switzerland |
96 |
2.3 |
17 |
|
|
|
|
|
15 |
Korea, Republic of |
94 |
2.3 |
8 |
|
|
|
|
|
16 |
Belgium |
86 |
2.1 |
1 |
|
|
|
|
|
17 |
Sweden |
76 |
1.8 |
16 |
|
|
|
|
|
18 |
Canada |
74 |
1.8 |
10 |
|
|
|
|
|
19 |
Luxembourg |
72 |
1.7 |
8 |
|
|
|
|
|
20 |
Denmark |
66 |
1.6 |
11 |
|
|
|
|
|
21 |
Austria |
60 |
1.4 |
11 |
|
|
|
|
|
22 |
Russian Federation |
54 |
1.3 |
22 |
|
|
|
|
|
23 |
Australia |
50 |
1.2 |
6 |
|
|
|
|
|
24 |
Taipei, Chinese |
46 |
1.1 |
14 |
|
|
|
|
|
25 |
Norway |
42 |
1.0 |
7 |
|
|
|
|
|
26 |
Thailand |
40 |
1.0 |
19 |
|
|
|
|
|
27 |
Greece |
40 |
1.0 |
7 |
|
|
|
|
|
28 |
Macao, China |
39 |
0.9 |
36 |
|
|
|
|
|
29 |
Turkey |
38 |
0.9 |
12 |
|
|
|
|
|
30 |
Poland |
37 |
0.9 |
12 |
|
|
|
|
|
|
Total of above |
3,480 |
83.8 |
- |
|
|
|
|
|
|
World |
4,150 |
100.0 |
11 |
|
|
|
|
Annual |
Rank |
Importers |
Value |
Share |
percentage |
|
|
|
|
change |
|
|
|
|
|
1 |
United States |
391 |
10.1 |
6 |
|
|
|
|
|
2 |
Germany |
284 |
7.3 |
8 |
|
|
|
|
|
3 |
China |
236 |
6.1 |
23 |
|
|
|
|
|
4 |
United Kingdom |
171 |
4.4 |
7 |
|
|
|
|
|
5 |
Japan |
165 |
4.3 |
6 |
|
|
|
|
|
6 |
France |
141 |
3.6 |
7 |
|
|
|
|
|
7 |
India |
130 |
3.4 |
12 |
|
|
|
|
|
8 |
Netherlands |
118 |
3.1 |
12 |
|
|
|
|
|
9 |
Italy |
115 |
3.0 |
5 |
|
|
|
|
|
10 |
Ireland |
113 |
2.9 |
6 |
|
|
|
|
|
11 |
Singapore |
110 |
2.9 |
15 |
|
|
|
|
|
12 |
Canada |
99 |
2.6 |
10 |
|
|
|
|
|
13 |
Korea, Republic of |
98 |
2.5 |
3 |
|
|
|
|
|
14 |
Spain |
91 |
2.4 |
5 |
|
|
|
|
|
15 |
Russian Federation |
90 |
2.3 |
24 |
|
|
|
|
|
16 |
Belgium |
82 |
2.1 |
5 |
|
|
|
|
|
17 |
Brazil |
73 |
1.9 |
22 |
|
|
|
|
|
18 |
Australia |
59 |
1.5 |
18 |
|
|
|
|
|
19 |
Denmark |
56 |
1.5 |
11 |
|
|
|
|
|
20 |
Hong Kong, China |
56 |
1.4 |
10 |
|
|
|
|
|
21 |
Sweden |
56 |
1.4 |
15 |
|
|
|
|
|
22 |
Saudi Arabia, |
55 |
1.4 |
8 |
|
Kingdom of |
|
|
|
|
|
|
|
|
23 |
Thailand |
50 |
1.3 |
13 |
|
|
|
|
|
24 |
Switzerland |
47 |
1.2 |
18 |
|
|
|
|
|
25 |
United Arab Emiratesa |
46 |
1.2 |
… |
26 |
Austria |
44 |
1.2 |
20 |
|
|
|
|
|
27 |
Norway |
44 |
1.1 |
4 |
|
|
|
|
|
28 |
Taipei, Chinese |
41 |
1.1 |
11 |
|
|
|
|
|
29 |
Luxembourg |
40 |
1.0 |
10 |
|
|
|
|
|
30 |
Malaysia |
37 |
1.0 |
17 |
|
|
|
|
|
|
Total of above |
3,140 |
81.2 |
- |
|
|
|
|
|
|
World |
3,865 |
100.0 |
10 |
a. preliminary estimates.
Note: Figures for a number of countries and territories have been estimated. Annual percentage changes and rankings are affected by continuity breaks in the series for a large number of economies, and by limitations in cross-country comparability.
Source: WTO and UNCTAD Secretariats.
32

I – World Trade in 2011
Appendix Table 6: Leading exporters and importers in world trade in commercial services (excluding intra-EU(27) trade), 2011
(US$ billion and percentage)
|
|
|
|
Annual |
Rank |
Exporters |
Value |
Share |
percentage |
|
|
|
|
change |
|
|
|
|
|
1 |
Extra-EU(27) exports |
789 |
24.8 |
12 |
|
|
|
|
|
2 |
United States |
578 |
18.2 |
11 |
|
|
|
|
|
3 |
China |
182 |
5.7 |
7 |
|
|
|
|
|
4 |
India |
148 |
4.7 |
20 |
|
|
|
|
|
5 |
Japan |
143 |
4.5 |
3 |
|
|
|
|
|
6 |
Singapore |
125 |
3.9 |
12 |
|
|
|
|
|
7 |
Hong Kong, China |
121 |
3.8 |
14 |
|
|
|
|
|
8 |
Switzerland |
96 |
3.0 |
17 |
|
|
|
|
|
9 |
Korea, Republic of |
94 |
2.9 |
8 |
|
|
|
|
|
10 |
Canada |
74 |
2.3 |
10 |
|
|
|
|
|
11 |
Russian Federation |
54 |
1.7 |
22 |
|
|
|
|
|
12 |
Australia |
50 |
1.6 |
6 |
|
|
|
|
|
13 |
Taipei, Chinese |
46 |
1.4 |
14 |
|
|
|
|
|
14 |
Norway |
42 |
1.3 |
7 |
|
|
|
|
|
15 |
Thailand |
40 |
1.3 |
19 |
|
|
|
|
|
16 |
Macao, China |
39 |
1.2 |
36 |
|
|
|
|
|
17 |
Turkey |
38 |
1.2 |
12 |
|
|
|
|
|
18 |
Brazil |
37 |
1.2 |
21 |
|
|
|
|
|
19 |
Malaysia |
36 |
1.1 |
9 |
|
|
|
|
|
20 |
Israel |
26 |
0.8 |
6 |
|
|
|
|
|
21 |
Indonesia |
20 |
0.6 |
23 |
|
|
|
|
|
22 |
Egypt |
19 |
0.6 |
-20 |
|
|
|
|
|
23 |
Ukraine |
19 |
0.6 |
13 |
|
|
|
|
|
24 |
Lebanese Republica |
18 |
0.6 |
… |
25 |
Philippines |
16 |
0.5 |
8 |
|
|
|
|
|
26 |
Mexico |
15 |
0.5 |
-0 |
|
|
|
|
|
27 |
South Africa |
15 |
0.5 |
8 |
|
|
|
|
|
28 |
Argentina |
14 |
0.4 |
10 |
|
|
|
|
|
29 |
Morocco |
14 |
0.4 |
14 |
|
|
|
|
|
30 |
Croatia |
13 |
0.4 |
13 |
|
|
|
|
|
|
Total of above |
2,920 |
91.9 |
- |
|
|
|
|
|
|
World (excl. intra- |
3,180 |
100.0 |
12 |
|
EU(27)) |
|
|
|
|
|
|
|
Annual |
Rank |
Importers |
Value |
Share |
percentage |
|
|
|
|
change |
|
|
|
|
|
1 |
Extra-EU(27) imports |
639 |
21.1 |
8 |
|
|
|
|
|
2 |
United States |
391 |
12.9 |
6 |
|
|
|
|
|
3 |
China |
236 |
7.8 |
23 |
|
|
|
|
|
4 |
Japan |
165 |
5.4 |
6 |
|
|
|
|
|
5 |
India |
130 |
4.3 |
12 |
|
|
|
|
|
6 |
Singapore |
110 |
3.7 |
15 |
|
|
|
|
|
7 |
Canada |
99 |
3.3 |
10 |
|
|
|
|
|
8 |
Korea, Republic of |
98 |
3.2 |
3 |
|
|
|
|
|
9 |
Russian Federation |
90 |
3.0 |
24 |
|
|
|
|
|
10 |
Brazil |
73 |
2.4 |
22 |
|
|
|
|
|
11 |
Australia |
59 |
2.0 |
18 |
|
|
|
|
|
12 |
Hong Kong, China |
56 |
1.8 |
10 |
|
|
|
|
|
13 |
Saudi Arabia, |
55 |
1.8 |
8 |
|
Kingdom of |
|
|
|
|
|
|
|
|
14 |
Thailand |
50 |
1.7 |
13 |
|
|
|
|
|
15 |
Switzerland |
47 |
1.5 |
18 |
|
|
|
|
|
16 |
United Arab Emiratesa |
46 |
1.5 |
… |
17 |
Norway |
44 |
1.5 |
4 |
|
|
|
|
|
18 |
Taipei, Chinese |
41 |
1.4 |
11 |
|
|
|
|
|
19 |
Malaysia |
37 |
1.2 |
17 |
|
|
|
|
|
20 |
Indonesia |
32 |
1.1 |
24 |
|
|
|
|
|
21 |
Mexico |
25 |
0.8 |
16 |
|
|
|
|
|
22 |
Irana |
22 |
0.7 |
… |
23 |
South Africa |
20 |
0.7 |
13 |
|
|
|
|
|
24 |
Israel |
20 |
0.7 |
14 |
|
|
|
|
|
25 |
Angolaa |
20 |
0.7 |
… |
26 |
Turkey |
20 |
0.6 |
7 |
|
|
|
|
|
27 |
Nigeriaa |
17 |
0.6 |
… |
28 |
Argentina |
16 |
0.5 |
16 |
|
|
|
|
|
29 |
Lebanese Republica |
15 |
0.5 |
… |
30 |
Ukraine |
14 |
0.5 |
19 |
|
|
|
|
|
|
Total of above |
2,690 |
88.9 |
- |
|
|
|
|
|
|
World (excl. |
3,025 |
100.0 |
13 |
|
intra-EU(27)) |
|
|
|
a. Preliminary estimates.
Note: Figures for a number of countries and territories have been estimated. Annual percentage changes and rankings are affected by continuity breaks in the series for a large number of economies, and by limitations in cross-country comparability.
Source: WTO and UNCTAD Secretariats.
Appendixfigures.C andtables
33