


II – Trade and public policies: A closer look at non-tariff measures in the 21st century
2.Stylized facts about NTMs related to trade in goods
Currently available databases on non-tariff measures, despite the shortcomings discussed above, can be used to address important questions about trade in goods, including whether such measures have increased over time, how important SPS and TBT measures are compared with other types of NTMs, and how firms perceive the obstacles they face in international markets. This sub-section poses several such questions about NTMs and provides answers in the form of descriptive statistics in order to establish a number of stylized facts about NTMs. Only with a reliable set of facts can researchers hope to make progress in addressing more fundamental questions about NTMs.
(a)Is there evidence of an increasing mediumto long-term trend in NTMs?
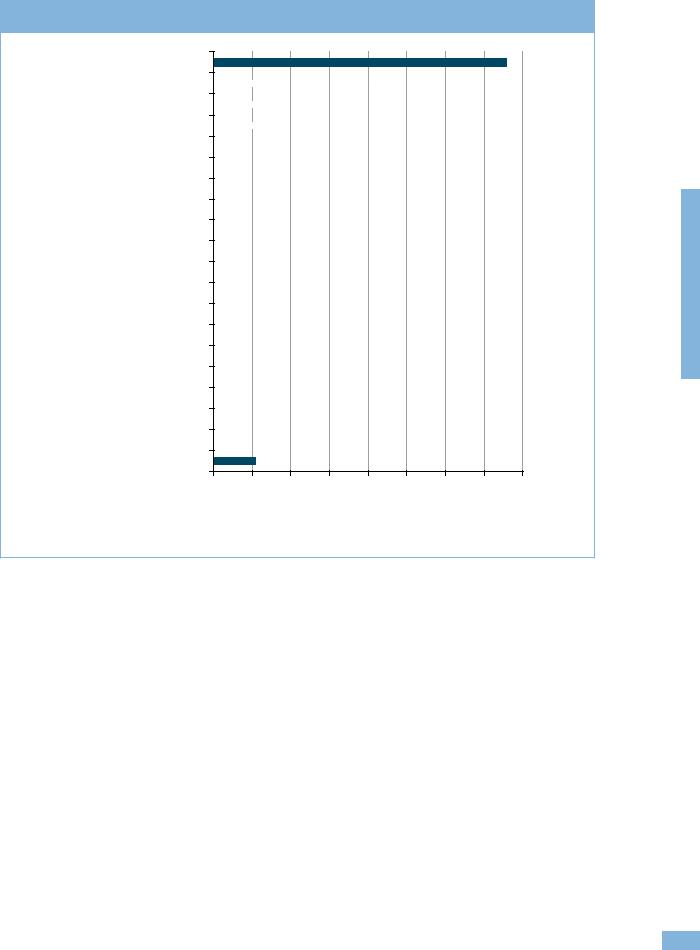
To grasp the general trends in non-tariff measures since the mid-1990s, information was first collected from the UNCTAD TRAINS database.34 Panel (a) of Figure C.2 presents the average share of product lines and share of trade value affected by NTMs for all countries for which information has been collected. As explained in more detail in Box C.1, these are inventory-based measures of the intensive margin (value of trade) and the extensive margin (number of lines affected) of trade covered by NTMs, respectively. The shares of lines and trade value covered by NTMs have increased between 1996-2000 and 2001-04, but there is no evidence of a further increase for the 2005-08 period.35
It is well known that the TRAINS database suffers from inconsistent data collection across years. To address this problem, in Panel (b) of Figure C.2 the same information is presented for selected Latin American countries with the most complete NTM information in the database.36 The qualitative results
are similar to the ones in Panel (a): the shares of lines and trade value covered by NTMs have increased between 1996-2000 and 2001-04, but there is no evidence of a further increase since the mid-2000s.
Beyond the well-known data limitations, the absence of conclusive evidence of an increasing use of nontariff measures may be due to different trends of specific NTMs. The focus of this report is, however, on TBT/SPS measures. WTO internal sources of information on notifications and specific trade concerns can be used to display the trends in TBT/SPS measures since 1995. Figure C.3 shows the number of notifications to the WTO and the number of notifying countries since 1995 for both SPS and TBT measures. Both series exhibit upward trends.37
As a caveat, it should be emphasized that WTO members do not have the obligation to notify all measures imposed, but only the new ones being introduced (see Section C.1). Moreover, the mechanism underlying such trends (increasing number of measures or increased compliance with WTO obligations) cannot be clearly identified.
The evidence of an upward trend in the number of SPS and TBT measures notified is supported by complaintbased information contained in the Specific Trade Concerns Database. In Figure C.4, the left axis represents the number of SPS concerns initiated and resolved per year.38 The right axis represents the cumulative number of concerns. It is useful to distinguish between new and resolved concerns because new concerns may signal an increasingly adverse effect of measures or an increasing participation of countries in the specific trade concerns mechanism.39 The rate at which concerns are resolved conveys (partial) information on the effectiveness of the mechanism. The figure shows that both the number of concerns initiated and the number of concerns resolved fluctuate widely between 1995 and 2010. However, due to the fact that the former number is larger than the latter in all years
Figure C.2: Shares of product lines and trade value covered by NTMs, 1996-2008
(percentage)
(a) All available countries
0.6 |
|
|
0.57 |
0.53 0.54 |
|
|
0.49 |
|
|
0.5 |
|
|
|
|
|
|
|
|
|
0.4 |
|
|
|
|
0.3 |
0.26 0.29 |
|
|
|
0.2 |
|
|
|
|
0.1 |
|
|
|
|
0 |
|
|
|
|
|
1996-2000 |
2001-2004 |
2005-2008 |
|
|
Share of product lines |
Share of trade value |
||
(b) Selected Latin American countries
0.6 |
|
|
0.61 |
0.61 |
|
0.51 |
|
0.52 |
|
0.5 |
0.49 |
|
||
|
|
|
||
0.40 |
|
|
|
|
0.4 |
|
|
|
|
|
|
|
|
|
0.3 |
|
|
|
|
0.2 |
|
|
|
|
0.1 |
|
|
|
|
0 |
|
|
|
|
|
1999-2002 |
2002-2005 |
2006-2008 |
|
|
Share of product lines |
Share of trade value |
||
Source: UNCTAD TRAINS.
Note: Latin American countries in Panel (b) include Argentina, Colombia, Ecuador, Peru, Uruguay and the Bolivarian Republic of Venezuela.
inventoryA .C ofnon measures servicesand measures
tariff-
105

world trade report 2012
Figure C.3: SPS and TBT notifications, 1995-2010
(number of notifying countries and number of notified measures per year)
(a) SPS
60 |
|
|
|
|
|
|
|
|
|
|
|
|
|
|
1200 |
50 |
|
|
|
|
|
|
|
|
|
|
|
|
|
|
1000 |
40 |
|
|
|
|
|
|
|
|
|
|
|
|
|
|
800 |
30 |
|
|
|
|
|
|
|
|
|
|
|
|
|
|
600 |
20 |
|
|
|
|
|
|
|
|
|
|
|
|
|
|
400 |
10 |
|
|
|
|
|
|
|
|
|
|
|
|
|
|
200 |
0 |
|
|
|
|
|
|
|
|
|
|
|
|
|
|
0 |
1995 |
1996 |
1997 |
1998 |
1999 |
2000 |
2001 |
2002 |
2003 |
2004 |
2005 |
2006 |
2007 |
2008 |
2009 |
2010 |
|
|
Number of measures (right axis) |
Number of notifying countries (left axis) |
|
|
||||||||||
(b) TBT
100 |
|
|
|
|
|
|
|
|
|
|
|
|
|
|
1800 |
90 |
|
|
|
|
|
|
|
|
|
|
|
|
|
|
1600 |
80 |
|
|
|
|
|
|
|
|
|
|
|
|
|
|
1400 |
|
|
|
|
|
|
|
|
|
|
|
|
|
|
|
|
70 |
|
|
|
|
|
|
|
|
|
|
|
|
|
|
1200 |
|
|
|
|
|
|
|
|
|
|
|
|
|
|
|
|
60 |
|
|
|
|
|
|
|
|
|
|
|
|
|
|
1000 |
|
|
|
|
|
|
|
|
|
|
|
|
|
|
|
|
50 |
|
|
|
|
|
|
|
|
|
|
|
|
|
|
|
40 |
|
|
|
|
|
|
|
|
|
|
|
|
|
|
800 |
|
|
|
|
|
|
|
|
|
|
|
|
|
|
|
|
30 |
|
|
|
|
|
|
|
|
|
|
|
|
|
|
600 |
|
|
|
|
|
|
|
|
|
|
|
|
|
|
|
|
20 |
|
|
|
|
|
|
|
|
|
|
|
|
|
|
400 |
|
|
|
|
|
|
|
|
|
|
|
|
|
|
|
|
10 |
|
|
|
|
|
|
|
|
|
|
|
|
|
|
200 |
0 |
|
|
|
|
|
|
|
|
|
|
|
|
|
|
0 |
1995 |
1996 |
1997 |
1998 |
1999 |
2000 |
2001 |
2002 |
2003 |
2004 |
2005 |
2006 |
2007 |
2008 |
2009 |
2010 |
|
|
Number of measures (right axis) |
Number of notifying countries (left axis) |
|
|
||||||||||
Source: WTO I-TIP database.
except 2004, the cumulative number of SPS concerns increases over time.
A total of 312 SPS specific trade concerns were raised between 1995 and 2010. Ninety-five (30 per cent) were reported as resolved by WTO members to the SPS Committee. Eighteen (6 per cent) were reported as partially resolved – meaning, for instance, that trade may have been allowed for selected products or by some of the members using the measure in question. No solutions were reported for the remaining 215 trade concerns (64 per cent). However, it is possible that some of these concerns were resolved without the SPS Committee being made aware of these developments. Therefore, the number of resolved concerns in Figure C.4 should be taken as a lower estimate. Table C.4 below documents the fact that disputes citing SPS measures have not increased over time, either as
an annual total or as a share of all disputes. This
106
suggests that the specific trade concerns mechanism may be functioning better than the rising number of disputes and notifications in this area would suggest.
In the case of TBT specific trade concerns, only information on initiation of concerns, but not on their termination, is available. The data, shown in Figure C.5, indicate an upward trend in initiations (but with reductions between 1998 and 1999; 2002 and 2005; and 2009 and 2010).
Consistent with the measures-based information from notifications, there is also some indication that an increasing number of countries is involved in raising specific trade concerns or maintaining TBT/SPS measures subject to STCs (see Figure C.6).40 A key element is that developing countries are becoming important users of the system – an issue that will be explored in more detail in Section C.2(c).

II – Trade and public policies: A closer look at non-tariff measures in the 21st century
Figure C.4: New and resolved SPS specific trade concerns, 1995-2010
(number of concerns)
|
45 |
|
|
|
|
|
|
|
|
|
|
|
|
|
|
250 |
|
concerns |
40 |
|
|
|
|
|
|
|
|
|
|
|
|
|
|
|
concerns |
35 |
|
|
|
|
|
|
|
|
|
|
|
|
|
|
200 |
||
|
|
|
|
|
|
|
|
|
|
|
|
|
|
|
|||
30 |
|
|
|
|
|
|
|
|
|
|
|
|
|
|
|
||
resolved |
|
|
|
|
|
|
|
|
|
|
|
|
|
|
|
of active |
|
25 |
|
|
|
|
|
|
|
|
|
|
|
|
|
|
150 |
||
|
|
|
|
|
|
|
|
|
|
|
|
|
|
|
|||
|
|
|
|
|
|
|
|
|
|
|
|
|
|
|
|
||
newand |
20 |
|
|
|
|
|
|
|
|
|
|
|
|
|
|
100 |
number |
|
|
|
|
|
|
|
|
|
|
|
|
|
|
|
|||
15 |
|
|
|
|
|
|
|
|
|
|
|
|
|
|
|
||
Number of |
|
|
|
|
|
|
|
|
|
|
|
|
|
|
|
Cumulative |
|
10 |
|
|
|
|
|
|
|
|
|
|
|
|
|
|
50 |
||
|
|
|
|
|
|
|
|
|
|
|
|
|
|
|
|||
5 |
|
|
|
|
|
|
|
|
|
|
|
|
|
|
|
||
|
|
|
|
|
|
|
|
|
|
|
|
|
|
|
|
|
|
|
0 |
|
|
|
|
|
|
|
|
|
|
|
|
|
|
0 |
|
|
1995 |
1996 |
1997 |
1998 |
1999 |
2000 |
2001 |
2002 |
2003 |
2004 |
2005 |
2006 |
2007 |
2008 |
2009 |
2010 |
|
|
|
|
Number of new concerns |
Number of resolved concerns |
|
Cumulative |
|
|
|
||||||||
Source: WTO STC Database.
Figure C.5: New TBT specific trade concerns, 1995-2010
(number of concerns)
50 |
|
|
|
|
|
|
|
|
|
|
|
|
|
|
|
45 |
|
|
|
|
|
|
|
|
|
|
|
|
|
|
|
40 |
|
|
|
|
|
|
|
|
|
|
|
|
|
|
|
35 |
|
|
|
|
|
|
|
|
|
|
|
|
|
|
|
30 |
|
|
|
|
|
|
|
|
|
|
|
|
|
|
|
25 |
|
|
|
|
|
|
|
|
|
|
|
|
|
|
|
20 |
|
|
|
|
|
|
|
|
|
|
|
|
|
|
|
15 |
|
|
|
|
|
|
|
|
|
|
|
|
|
|
|
10 |
|
|
|
|
|
|
|
|
|
|
|
|
|
|
|
5 |
|
|
|
|
|
|
|
|
|
|
|
|
|
|
|
0 |
|
|
|
|
|
|
|
|
|
|
|
|
|
|
|
1995 |
1996 |
1997 |
1998 |
1999 |
2000 |
2001 |
2002 |
2003 |
2004 |
2005 |
2006 |
2007 |
2008 |
2009 |
2010 |
Source: WTO STC Database. |
|
|
|
|
|
|
|
|
|
|
|
|
|
|
|
Because the number of “resolved” concerns is based on an assumption in the case of TBT, the descriptive statistics on TBT are to be interpreted with some caution. Moreover, no direct comparison can be made between SPS concerns (upper panel) and TBT concerns (lower panel).
The specific trade concerns data can also provide information on the amount of trade affected by TBT/SPS concerns. Firstly, Figure C.7 shows the average amount of trade per concern initiated. The figure shows that, on average, the import value of an initiated trade concern has been quite stable since 1995, with the exception of two peaks at the end of each decade. In the case of SPS concerns, the peaks occurred in 1997-98 and in 2008. As for TBT concerns, there was a peak in 1999-2000 and another smaller one in 2010.41
These peaks are due to the filing of concerns involving a wide set of HS2 lines between two or more major trading countries. In the case of the SPS peaks, the first is mainly due to two separate concerns, one on pharmaceutical products raised by the United States, Switzerland, Brazil, Canada, Australia and others against the European Union in 1997, and another on dairy products raised by the European Union against Poland in 1998. The SPS peak in 2008 is mainly due to a complaint by the United States and China, among other countries, against Japan on meat, dairy and most vegetable products.
For TBT concerns, the earlier peak is also a “double peak” spanning the years 1999 and 2000. In 1999, a TBT concern was raised against the European Union by a large set of countries including the United States, China and Japan, involving a wide range of sectors
inventoryA .C ofnon measures servicesand measures
tariff-
107

world trade report 2012
Figure C.6: Maintaining and raising countries in specific trade concerns, 1995-2010
(number of countries)
(a) SPS |
|
|
|
|
|
|
|
|
|
|
|
|
|
|
|
60 |
|
|
|
|
|
|
|
|
|
|
|
|
|
|
|
50 |
|
|
|
|
|
|
|
|
|
|
|
|
|
|
|
40 |
|
|
|
|
|
|
|
|
|
|
|
|
|
|
|
30 |
|
|
|
|
|
|
|
|
|
|
|
|
|
|
|
20 |
|
|
|
|
|
|
|
|
|
|
|
|
|
|
|
10 |
|
|
|
|
|
|
|
|
|
|
|
|
|
|
|
0 |
|
|
|
|
|
|
|
|
|
|
|
|
|
|
|
1995 |
1996 |
1997 |
1998 |
1999 |
2000 |
2001 |
2002 |
2003 |
2004 |
2005 |
2006 |
2007 |
2008 |
2009 |
2010 |
|
|
|
|
|
Maintaining countries |
|
Raising countries |
|
|
|
|
||||
(b) TBT |
|
|
|
|
|
|
|
|
|
|
|
|
|
|
|
60 |
|
|
|
|
|
|
|
|
|
|
|
|
|
|
|
50 |
|
|
|
|
|
|
|
|
|
|
|
|
|
|
|
40 |
|
|
|
|
|
|
|
|
|
|
|
|
|
|
|
30 |
|
|
|
|
|
|
|
|
|
|
|
|
|
|
|
20 |
|
|
|
|
|
|
|
|
|
|
|
|
|
|
|
10 |
|
|
|
|
|
|
|
|
|
|
|
|
|
|
|
0 |
|
|
|
|
|
|
|
|
|
|
|
|
|
|
|
1995 |
1996 |
1997 |
1998 |
1999 |
2000 |
2001 |
2002 |
2003 |
2004 |
2005 |
2006 |
2007 |
2008 |
2009 |
2010 |
|
|
|
|
|
Maintaining countries |
|
Raising countries |
|
|
|
|
||||
Source: WTO I-TIP database.
Note: In the TBT dataset, a concern is assumed to be “resolved” if not raised again for two or more years. A “raising” country is the one which complains about a TBT/SPS measure imposed by a “maintaining” country in the relevant WTO committee.
including miscellaneous chemical products, various metals, electrical machinery and toys. Another concern was raised in 2000 by the United States, Canada, Japan and others against the European Union on electrical machinery and instruments. Finally, a TBT peak in 2010 was mainly due to a concern raised by the European Union against the United States, involving a wide set of sectors, including chemicals and plastics.
Secondly, inventory-based measures of the incidence of non-tariff measures, namely frequency and coverage ratios, have been calculated (see Box C.1 for methodology). In this case, too, a specific trade concern in TBT is assumed to be “resolved” if, after its initiation, it is not raised again for two years; no direct comparison can be made between SPS concerns (see Figure C.8(a)) and TBT concerns (see Figure C.8(b)),
especially on the absolute amount of trade covered. The
108
general message is, however, that frequency and coverage ratios are increasing (although not evenly), indicating that SPS and TBT measures subject to specific trade concerns are affecting an increasing number of product lines and an increasing amount of trade.42
Evidence from disputes on trends in TBT/SPS measures is inconclusive. According to Santana and Jackson (2012), the number of disputes citing the SPS and TBT agreements fell between 1995 and 2011, but the drop was consistent with the overall decline in the number of disputes during this period (see Table C.4). Requests for consultations related to SPS measures fell from 18 in 1995-2000 to seven in 2007-11, but the share of SPS cases in the total number of disputes increased to 11 per cent from 9 per cent between these two periods. Disputes citing the TBT Agreement numbered 24 in the earlier period and just eight in the
II – Trade and public policies: A closer look at non-tariff measures in the 21st century
Figure C.7: Average value of initiated SPS and TBT concerns, 1995-2010
(US$ billion)
2 |
|
|
|
|
|
|
|
|
|
|
|
|
|
|
40 |
|
|
|
|
|
|
|
|
|
|
|
|
|
|
|
35 |
1.5 |
|
|
|
|
|
|
|
|
|
|
|
|
|
|
30 |
|
|
|
|
|
|
|
|
|
|
|
|
|
|
|
25 |
1 |
|
|
|
|
|
|
|
|
|
|
|
|
|
|
20 |
|
|
|
|
|
|
|
|
|
|
|
|
|
|
|
15 |
0.5 |
|
|
|
|
|
|
|
|
|
|
|
|
|
|
10 |
|
|
|
|
|
|
|
|
|
|
|
|
|
|
|
5 |
0 |
|
|
|
|
|
|
|
|
|
|
|
|
|
|
0 |
1995 |
1996 |
1997 |
1998 |
1999 |
2000 |
2001 |
2002 |
2003 |
2004 |
2005 |
2006 |
2007 |
2008 |
2009 |
2010 |
|
|
Average import value per new SPS concern |
|
Average import value per new TBT concern |
|
|
|||
|
|
(left axis) |
|
(right axis) |
|
|
|
|
|
Source: WTO STC Database.
Figure C.8: Coverage ratio and frequency index of STCs aggregated by year, 1995-2010
(a) SPS
0.1 |
|
|
|
|
|
|
|
|
|
|
|
|
|
|
|
0.09 |
|
|
|
|
|
|
|
|
|
|
|
|
|
|
|
0.08 |
|
|
|
|
|
|
|
|
|
|
|
|
|
|
|
0.07 |
|
|
|
|
|
|
|
|
|
|
|
|
|
|
|
0.06 |
|
|
|
|
|
|
|
|
|
|
|
|
|
|
|
0.05 |
|
|
|
|
|
|
|
|
|
|
|
|
|
|
|
0.04 |
|
|
|
|
|
|
|
|
|
|
|
|
|
|
|
0.03 |
|
|
|
|
|
|
|
|
|
|
|
|
|
|
|
0.02 |
|
|
|
|
|
|
|
|
|
|
|
|
|
|
|
0.01 |
|
|
|
|
|
|
|
|
|
|
|
|
|
|
|
0 |
|
|
|
|
|
|
|
|
|
|
|
|
|
|
|
1995 |
1996 |
1997 |
1998 |
1999 |
2000 |
2001 |
2002 |
2003 |
2004 |
2005 |
2006 |
2007 |
2008 |
2009 |
2010 |
|
|
|
|
|
Coverage ratio |
|
Frequency index |
|
|
|
|
|
|||
(b) TBT |
|
|
|
|
|
|
|
|
|
|
|
|
|
|
|
0.025 |
|
|
|
|
|
|
|
|
|
|
|
|
|
|
|
0.02 |
|
|
|
|
|
|
|
|
|
|
|
|
|
|
|
0.015 |
|
|
|
|
|
|
|
|
|
|
|
|
|
|
|
0.01 |
|
|
|
|
|
|
|
|
|
|
|
|
|
|
|
0.005 |
|
|
|
|
|
|
|
|
|
|
|
|
|
|
|
0 |
|
|
|
|
|
|
|
|
|
|
|
|
|
|
|
1995 |
1996 |
1997 |
1998 |
1999 |
2000 |
2001 |
2002 |
2003 |
2004 |
2005 |
2006 |
2007 |
2008 |
2009 |
2010 |
|
|
|
|
|
|
Coverage ratio |
|
Frequency index |
|
|
|
|
|
||
Source: WTO I-TIP database. |
|
|
|
|
|
|
|
|
|
|
|
|
|
|
|
Note: In the TBT dataset, a concern is assumed to be “resolved” if not raised again for two or more years. |
|
|
|
||||||||||||
inventoryA .C ofnon measures servicesand measures
tariff-
109

world trade report 2012
latter one, but their share in total disputes was roughly the same in both periods, at 12 per cent. The percentage of disputes mentioning TBT measures fell to 4.5 per cent during the 2001-06 period before
returning to 12 per cent, so while there are some signs of a recent rise in this area, there is no indication of a longer-term trend.
Box C.1: Methodology for constructing indices from UNCTAD TRAINS and STC databases
The UNCTAD TRAINS database, as described in Appendix C.1, contains information on non-tariff measures by country and sector for HS6 product lines (a six-digit sub-heading in the Harmonized System classification) and year. Following Bora et al. (2002), for a given country c in a given year t, the share of import lines that are subject to NTMs is defined as follows: = 
In the formula, i indexes HS6 products, Di is a dummy variable taking value equal to one if an NTM is in place and Mi is a dummy variable equal to one if there are imports of product i.43 The share of import values
affected by NTMs is defined as follows:
=  ! ! !! !
where Vi is the value of imports at the HS6 level and tariff line level and Di is as above.
Simple averages over countries for each of the years are used. Thus, each year’s share of import lines and share of trade value represents the average of a different sample of countries. However, the results with Latin American countries in Figure C.2 are based on a set of countries with information on the same years. Information on the countries to which the NTMs apply was not included. Therefore, the trade partner was chosen to be the world.
The STC Database contains bilateral information at the HS4 sector disaggregation (a four-digit heading in the Harmonized System classification level). The coverage ratio and the frequency index were computed using the following formulae:
|
!,!"!,! = |
! !"! !"! |
!,!,!,!"! |
!,!"!,! = |
!"! !"! !,!,!,!"! |
!,!,!,!"! |
|
! !"! !"! |
|
||
!"! !"! !,!,!,!"! |
|||
where c indexes maintaining countries, j indexes raising countries and t indexes time. In other words, CR is the share of trade under a complaint over total trade for country c, in sector HS2 (a two-digit chapter in the Harmonized System classification level) at time t. This is an inventory-based measure of the intensive margin of trade covered by NTMs. FI is the share of the number of product codes covered by a certain NTM over the total number of product codes for which import flows are positive. It is an inventory-based measure of the extensive margin of trade under NTMs. Note that the set of j countries is not the world, but rather the set of raising countries per specific trade concern. This is very different from the TRAINS data. Given this difference, it is not surprising that the shares of trade and lines covered computed from the TRAINS data is larger than the coverage ratios and frequency indexes computed from the STCs data.44
For the descriptive statistics used in Section C.2, we average CR and FI across sectors within maintaining country c and time t, and then over all maintaining countries in year t. The former average is weighted by the HS2 sector import share in total imports of c. The latter is a simple average. The end result is a time-varying coverage ratio and frequency index.45
It should be emphasized that these indexes are inventory-based measures that do not necessarily capture the trade restrictiveness of a measure, but just how much trade is affected by it (Section D.1 is concerned with the methods used to compute the trade restrictiveness of NTMs). When interpreting them, one has to take into account the issue of endogeneity. For the coverage ratio (or the share of import values affected), the problem is that the value of imports in a given product line is negatively affected by the NTMs imposed on it. For the frequency index (or the share of import lines affected), this endogeneity problem is attenuated, unless the measure eliminates trade altogether. However, this measure is less indicative of the overall and relative importance of the NTM.
110

II – Trade and public policies: A closer look at non-tariff measures in the 21st century
Table C.4: Agreements cited in disputes related to trade in goods, 1995-2011
(percentage and number)
|
1995-2000 |
2001-2006 |
2007-2011 |
1995-2011 |
|
|
|
|
|
Anti-dumping |
16.0 |
29.1 |
29.2 |
22.6 |
Agriculture |
19.1 |
14.9 |
13.8 |
16.8 |
Textiles and clothing |
7.7 |
0.7 |
0.0 |
4.1 |
Customs valuation |
4.6 |
2.2 |
4.6 |
3.8 |
GATT (adjusted)a |
55.7 |
59.0 |
53.8 |
56.5 |
Government procurement |
2.1 |
0.0 |
0.0 |
1.0 |
|
|
|
|
|
Import licensing |
13.4 |
6.0 |
1.5 |
8.9 |
|
|
|
|
|
Rules of origin |
1.5 |
1.5 |
3.1 |
1.8 |
|
|
|
|
|
Subsidies and countervailing measures |
19.6 |
25.4 |
24.6 |
22.4 |
|
|
|
|
|
Safeguards |
6.2 |
17.2 |
6.2 |
9.9 |
|
|
|
|
|
Sanitary and phytosanitary measures |
9.3 |
9.0 |
10.8 |
9.4 |
|
|
|
|
|
Technical barriers to trade |
12.4 |
6.0 |
12.3 |
10.2 |
|
|
|
|
|
Trade-related investment measures |
8.2 |
4.5 |
6.2 |
6.6 |
|
|
|
|
|
Total number of disputes in goods |
194 |
134 |
65 |
393 |
Source: WTO Secretariat estimates.
Note: Although there were 427 requests for consultations filed under the Dispute Settlement Understanding as of 31 December 2011, this table focuses on 393 disputes in goods, i.e. it excludes 25 disputes with claims mainly involving TRIPS and nine disputes with claims mainly involving the GATS.
aThis table follows the methodology of Santana and Jackson (2012) to eliminate duplicate citations of the GATT.
(b)Are TBT/SPS measures more prevalent than other types of non-tariff measures?
(i)Evidence from official sources
Recent analysis by the United Nations Conference on Trade and Development (UNCTAD) (2012), using newly collected data on non-tariff measures in 30 developing countries plus the European Union and Japan suggests a significant prevalence of TBT and SPS measures over other NTMs. Together, they cover more products and trade value than “hard measures”, such as price and quantity control measures. This analysis, using the new classification of NTMs discussed in Section C.1, includes separate subcategories allowing TBT and SPS measures to be distinguished. The former are more prevalent than the latter – a fact that is in line with the descriptive evidence on the number of measures notified to the WTO (see Figure C.3). In particular, the average country imposes TBT measures on about 30 per cent of products and trade and SPS measures on about 15 per cent of products and trade.46
(ii) Evidence from business surveys
The ITC business surveys provide further evidence of the predominance of TBT/SPS measures in non-tariff measures, or at least in those NTMs perceived as burdensome by firms in the 11 developing and leastdeveloped countries where surveys have been conducted. The data classification used in the surveys is similar but not identical to the multi-agency classification outlined in Table C.2 and Table C.3. TBT and SPS measures are not shown separately in the ITC surveys due to the difficulty of distinguishing these measures from survey responses, but taken together
they correspond to the sum of the categories “technical requirements” and “conformity assessment”. Reports of burdensome NTMs include both measures applied by importing countries and measures imposed by the home country. The former are referred to as “import-related measures” while the latter are classified as “export-related measures”.
Figure C.9 shows the breakdown of reported non-tariff measures by type of measure averaged over the 11 countries surveyed to date. Since some countries are larger than others, a simple average (i.e. the arithmetic mean) may give undue weight to smaller countries at the expense of larger ones. However, using a trade-weighted average (taking the value of each country’s exports in 2010 as weights) does not appear to have a major impact on shares.
The share of technical requirements in total non-tariff measures is somewhat smaller when the simple average is used (17 per cent) than when the tradeweighted average is used (23 per cent), but the reverse is true for conformity assessment (31 per cent compared with 24 per cent). The sum of these two categories is roughly the same in either case (around 48 per cent), which means that TBT/SPS measures comprise nearly half of all NTMs, including export-related measures. Their share in import-related measures is even higher at around 64 per cent, regardless of the weighting structure. Of all “challenging” NTMs reported by exporting companies, about 75 per cent are applied by partner countries and 25 per cent by home countries. Around 10 per cent of firms report a negative impact on their business from rules of origin, whereas other measures are seen as less challenging.
inventoryA .C ofnon measures servicesand measures
tariff-
111

world trade report 2012
Figure C.9: Burdensome NTMs by type of measure, 2010
(percentage)
Technical requirements 17% |
|
Simple average |
|
Export-related measures 25%
Other import- |
|
|
|
|
|
|
|
|
|
|
|
|
|
|||
|
|
|
|
|
|
|
|
|
|
|
||||||
related |
|
|
|
|
|
|
|
|
|
|||||||
measures 2% |
|
|
|
|
|
|
|
|
|
|||||||
Rules of origin |
|
|
|
|
|
|
|
|
|
|
|
|
|
|
||
|
|
|
|
|
|
|
|
|
|
|
|
|||||
10% |
|
|
|
|
|
|
|
|
|
|
|
|
|
|
|
|
Quantity control |
|
|
|
|
|
|
|
|
|
|
|
|
|
|||
|
|
|
|
|
|
|
|
|
|
|
|
|
||||
measures 4% |
|
|
|
|
|
|
|
|
|
|||||||
|
Para-tariff |
Pre-shipment |
|
Conformity |
|
|||||||||||
|
measures |
|
inspection |
|
assessment |
|
||||||||||
6% |
|
5% |
31% |
|
||||||||||||
|
|
|
|
|
|
|
|
|
|
Trade-weighted average |
||||||
Technical requirements 23% |
|
|
|
|
|
|||||||||||
|
|
|
|
|
||||||||||||
Export-related |
|
|
|
|
|
|
|
|
|
|
|
|||||
|
|
|
|
|
|
|
|
|
|
|||||||
measures 27% |
|
|
|
|
|
|
|
|
|
|||||||
|
|
|
|
|
|
|
|
|
|
|
|
|
|
|
|
|
Other import- |
|
|
related |
|
|
measures 4% |
|
|
Rules of origin |
|
|
9% |
|
|
Quantity control |
|
|
measures 4% |
|
|
Para-tariff |
Pre-shipment |
Conformity |
measures |
inspection |
assessment |
5% |
4% |
24% |
Source: ITC business surveys on NTMs.
Note: Surveys were conducted in 11 developing and leastdeveloped economies: Burkina Faso, Egypt, Jamaica, Kenya, Madagascar, Mauritius, Morocco, Paraguay, Peru, Rwanda and Uruguay. Minerals and arms are excluded from the survey.
The ITC data can be further broken down by subcategory of non-tariff measures. These are shown in Figure C.10 for TBT/SPS measures (i.e. technical requirements plus conformity assessment). Product certification, which is perceived as burdensome by 37 per cent of reporting firms, is the most frequently cited type of measure in this group. It is followed by product testing at 9 per cent, and inspection requirement at 8 per cent. Together, these three NTM sub-types are responsible for more than half of all firm
complaints about TBT/SPS measures.
112
Complying with product certification requirements in export markets can entail significant costs for exporting firms. Some recent numerical examples of these costs are summarized in Section D, Box D.5. These examples relate to costs confronting firms exporting from the United States, but product certification may pose an even greater challenge for exporters located in developing and least-developed economies, since they may have fewer financial and institutional resources to draw upon than firms in developed countries.
Problems relating to home country certification of exports are nearly as extensive for firms as certification in destination countries, as can be seen in Figure C.11. The export-related measures most frequently cited by firms are certification requirements (26 per cent), export inspection (23 per cent) and obtaining export licences/permits (13 per cent). Together, these three categories account for more than 60 per cent of firm complaints about export-related measures.
As noted in Section C.1, the ITC surveys are based on interviews with firms in a small number of developing economies, and as a result the responses do not represent the concerns and experiences of businesses in developed countries. The three largest developed economies (the United States, the European Union and Japan) all collect data and issue reports on trade barriers facing their exporters in foreign markets, but in general these figures are not publicly available in a format that is amenable to empirical analysis. This situation has been partly remedied by researchers at the US International Trade Commission, Martinez et al. (2009), whose CoRe NTM database merges business surveys from the United States and the European Union with information from WTO trade policy reviews using a single (idiosyncratic) data classification. Figure C.12 makes use of this database, but it excludes the WTO figures in order to focus solely on the concerns of developed economy exporters.
Data for the United States are sourced from the US National Trade Estimate (NTE) while figures for the European Union come from the EU’s Market Access Database. Strictly speaking, the US NTE is not a survey, but rather a report based on the findings of several US government agencies and embassies abroad, as well as from private firms. However, the figures should still provide important insight into the priorities of American exporters.
The top five problems facing US exporters are importrelated measures (24 per cent), investment measures (20 per cent), standards and testing (12 per cent), SPS measures (10 per cent) and intellectual property rights (9 per cent). The leading concerns of EU firms are SPS measures (35 per cent), standards and testing (16 per cent), anti-competitive practices (9 per cent), intellectual property rights (7 per cent) and import-
II – Trade and public policies: A closer look at non-tariff measures in the 21st century
Figure C.10: TBT/SPS import-related measures by sub-type, 2010
(percentage)
Product certification
Testing
Inspection requirement
Labelling
Fumigation
Origin of materials and parts
Tolerance limits for residues or contaminants
Product characteristics including quality, performance
Product registration
Packaging
Authorization requirement for health, safety, etc.
Restricted or prohibited use of substances in food
Prohibition for health, safety, etc.
Importer registration for health, safety, etc.
Product identity requirements
Hygienic practices during production
Restricted or prohibited use of substances(other than food)
Regulation on GMOs and other foreign species
Special authorization due to risk of food-borne disease
Others
37.3
 8.7
8.7
 7.9
7.9
 6.0
6.0
 4.4
4.4
 4.1
4.1
 3.6
3.6
 3.5
3.5
 2.9
2.9
 2.6
2.6
 2.5
2.5
 2.5
2.5
 1.5
1.5
 1.5
1.5
 1.2
1.2
 1.2
1.2
 1.2
1.2
 1.2
1.2
 1.0
1.0
5.3
0 |
5 |
10 |
15 |
20 |
25 |
30 |
35 |
40 |
Source: ITC business surveys on NTMs.
Note: Surveys were conducted in 11 developing and least-developed economies: Burkina Faso, Egypt, Jamaica, Kenya, Madagascar, Mauritius, Morocco, Paraguay, Peru, Rwanda and Uruguay. Minerals and arms are excluded from the survey.
related measures (6 per cent). The sum of “SPS measures” and “standards and testing” in Figure C.12 should be roughly equivalent to TBT/SPS measures as defined in Section A.1. TBT/SPS measures appear to be a major concern for the European Union, representing more than half (52 per cent) of all issues reported by EU exporters. However, the equivalent share for the United States is much lower, at 22 per cent. Reasons for this disparity are unclear, but it could be attributable to differences in methodology between the US NTE data and the EU’s Market Access Database.
An important difference between the ITC surveys and the US/EU reports is the relatively high importance attached to intellectual property rights by the large developed economies. According to the CoRe NTM data, intellectual property rights account for 9 per cent of complaints from US exporters and 7 per cent of complaints from EU firms. On the other hand, just 0.3 per cent of firms reporting burdensome NTMs in the ITC surveys cited intellectual property as a problem.
The data on disputes in Table C.4 show that requests for consultations citing the SPS and TBT agreements respectively represented 11 per cent and 12 per cent of all cases over the last five years. Although these shares are not exactly small, other agreements were cited more often, including GATT adjusted (54 per cent), antidumping (29 per cent), subsidies/countervailing measures (25 per cent) and the Agreement on Agriculture (14 per cent). This could lead one to conclude that firms’ complaints about TBT/SPS measures do not necessarily translate into government action at the level of the multilateral trading system. On the other hand, it could also be taken as evidence that the specific trade concern mechanism may be resolving complaints before they develop into fullyfledged trade disputes.
(c)Is there any difference in NTM use between developed and developing economies?47
The STC Database sheds light on the type of countries most involved in the mechanism. Figure C.13 presents
inventoryA .C ofnon measures servicesand measures
tariff-
113

world trade report 2012
Figure C.11: NTMs applied by home country on exports by sub-type, 2010
(percentage)
Certification required by |
|
|
|
|
|
|
|
|
|
|
|
|
|
|
|
|
|
|
26.1 |
|
the exporting country |
|
|
|
|
|
|
|
|
|
|
|
|
|
|
|
|
|
|
|
|
|
|
|
|
|
|
|
|
|
|
|
|
|
|
|
|
|
|
|
||
Export inspection |
|
|
|
|
|
|
|
|
|
|
|
|
|
|
23.1 |
|
|
|
||
|
|
|
|
|
|
|
|
|
|
|
|
|
|
|
|
|||||
|
|
|
|
|
|
|
|
|
|
|
|
|
|
|
|
|
|
|
|
|
Licensing or permit to export |
|
|
|
|
|
|
|
|
|
|
12.6 |
|
|
|
|
|
|
|
|
|
|
|
|
|
|
|
|
|
|
|
|
|
|
|
|
|
|
||||
|
|
|
|
|
|
|
|
|
|
|
|
|
|
|
|
|
|
|
|
|
Export taxes and charges |
|
|
|
|
|
|
|
|
10.0 |
|
|
|
|
|
|
|
|
|
||
|
|
|
|
|
|
|
|
|
|
|
|
|
|
|
|
|
||||
|
|
|
|
|
|
|
|
|
|
|
|
|
|
|
|
|
|
|
|
|
Other export related measures |
|
|
|
|
|
|
8.6 |
|
|
|
|
|
|
|
|
|
|
|
||
|
|
|
|
|
|
|
|
|
|
|
|
|
|
|
||||||
|
|
|
|
|
|
|
|
|
|
|
|
|
|
|
|
|
|
|
|
|
Other technical export measures |
|
|
|
|
|
7.3 |
|
|
|
|
|
|
|
|
|
|
|
|
||
|
|
|
|
|
|
|
|
|
|
|
|
|
|
|||||||
|
|
|
|
|
|
|
|
|
|
|
|
|
|
|
|
|
|
|
|
|
Export registration |
|
|
|
|
5.5 |
|
|
|
|
|
|
|
|
|
|
|
|
|
|
|
|
|
|
|
|
|
|
|
|
|
|
|
|
||||||||
|
|
|
|
|
|
|
|
|
|
|
|
|
|
|
|
|
|
|
|
|
Export subsidies |
|
|
3.4 |
|
|
|
|
|
|
|
|
|
|
|
|
|
|
|
|
|
|
|
|
|
|
|
|
|
|
|
|
|
|
|
|
|
|
|
|||
|
|
|
|
|
|
|
|
|
|
|
|
|
|
|
|
|
|
|
|
|
Export quotas |
|
1.9 |
|
|
|
|
|
|
|
|
|
|
|
|
|
|
|
|
||
|
|
|
|
|
|
|
|
|
|
|
|
|
|
|
|
|
||||
|
|
|
|
|
|
|
|
|
|
|
|
|
|
|
|
|
|
|
|
|
Export prohibitions |
0.5 |
|
|
|
|
|
|
|
|
|
|
|
|
|
|
|
|
|
|
|
|
|
|
|
|
|
|
|
|
|
|
|
|
|
|
|
|
|
|||
|
|
|
|
|
|
|
|
|
|
|
|
|
|
|
|
|
|
|
|
|
Measures on re-export |
0.5 |
|
|
|
|
|
|
|
|
|
|
|
|
|
|
|
|
|
|
|
|
|
|
|
|
|
|
|
|
|
|
|
|
|
|
|
|
|
|||
|
|
|
|
|
|
|
|
|
|
|
|
|
|
|
|
|
|
|
|
|
Other export quantitative restrictions |
0.4 |
|
|
|
|
|
|
|
|
|
|
|
|
|
|
|
|
|
|
|
|
|
|
|
|
|
|
|
|
|
|
|
|
|
|
|
|
|
|||
|
|
|
|
|
|
|
|
|
|
|
|
|
|
|
|
|
|
|
|
|
Export price control measures |
0.1 |
|
|
|
|
|
|
|
|
|
|
|
|
|
|
|
|
|
|
|
|
|
|
|
|
|
|
|
|
|
|
|
|
|
|
|
|
|
|||
|
|
|
|
|
|
|
|
|
|
|
|
|
|
|
|
|
|
|
|
|
0 |
5 |
10 |
15 |
20 |
25 |
30 |
||||||||||||||
Source: ITC business surveys on NTMs.
Note: Surveys were conducted in 11 developing and least-developed economies: Burkina Faso, Egypt, Jamaica, Kenya, Madagascar, Mauritius, Morocco, Paraguay, Peru, Rwanda and Uruguay. Minerals and arms are excluded from the survey.
Figure C.12: Non-tariff measures facing US and EU exporters, 2009
(percentage)
United States |
|
|
|
|
|
|
|
|
|
|
|
|
|
|
|
|
|
|
|
|
|
|
European Union |
|
|
|
|
|
|
|
|
|
|
|
|
|
|
|
|
|
|
|
||||||
|
|
|
|
|
|
|
|
|
|
|
|
|
|
|
|
|
|
|
|
|
|
|
|
|
|
|
|
|
|
|
|
|
|
|
|
|
|
|
|
|
|
|
|
|
|
|
|
|
Import-related |
|
|
|
|
|
|
|
|
|
|
|
|
|
|
|
|
|
|
|
|
24 |
|
|
SPS measures |
|
|
|
|
|
|
|
|
|
|
|
|
|
|
|
|
|
35 |
|
|||||
|
|
|
|
|
|
|
|
|
|
|
|
|
|
|
|
|
|
|
|
|
|
|
|
|
|
|
|
|
|
|
|
|
|
|
|
|
|
|||||||||||
|
|
|
|
|
|
|
|
|
|
|
|
|
|
|
|
|
|
|
|
|
|
|
|
|
|
|
|
|
|
|
|
|
|
|
|
|
|
|
|
|
|
|
|
|
|
|
|
|
Investment- |
|
|
|
|
|
|
|
|
|
|
|
|
|
|
|
|
|
20 |
|
|
|
|
|
|
Standards, |
|
|
|
|
|
|
|
|
|
|
|
16 |
|
|
|
|
|
|
|
|
|
|
|
related |
|
|
|
|
|
|
|
|
|
|
|
|
|
|
|
|
|
|
|
|
|
|
testing, etc. |
|
|
|
|
|
|
|
|
|
|
|
|
|
|
|
|
|
|
|
|
|||||
|
|
|
|
|
|
|
|
|
|
|
|
|
|
|
|
|
|
|
|
|
|
|
|
|
|
|
|
|
|
|
|
|
|
|
|
|
|
|
|
|
|
|
|
|
||||
Standards, |
|
|
|
|
|
|
|
|
|
|
|
|
|
12 |
|
|
|
|
|
|
|
|
|
|
Anti-competitive |
|
|
|
|
|
|
|
9 |
|
|
|
|
|
|
|
|
|
|
|
|
|
||
testing, etc. |
|
|
|
|
|
|
|
|
|
|
|
|
|
|
|
|
|
|
|
|
|
|
|
practices |
|
|
|
|
|
|
|
|
|
|
|
|
|
|
|
|
|
|
|
|
||||
|
|
|
|
|
|
|
|
|
|
|
|
|
|
|
|
|
|
|
|
|
|
|
|
|
|
|
|
|
|
|
|
|
|
|
|
|
|
|
|
|
|
|
|
|
||||
SPS measures |
|
|
|
|
|
|
|
|
|
10 |
|
|
|
|
|
|
|
|
|
|
|
|
Intellectual |
|
|
|
|
7 |
|
|
|
|
|
|
|
|
|
|
|
|
|
|
|
|||||
|
|
|
|
|
|
|
|
|
|
|
|
|
|
|
|
|
|
|
|
|
property |
|
|
|
|
|
|
|
|
|
|
|
|
|
|
|
|
|
|
|
|
|||||||
|
|
|
|
|
|
|
|
|
|
|
|
|
|
|
|
|
|
|
|
|
|
|
|
|
|
|
|
|
|
|
|
|
|
|
|
|
|
|
|
|
|
|
|
|
|
|
||
Intellectual |
|
|
|
|
|
|
|
|
|
9 |
|
|
|
|
|
|
|
|
|
|
|
|
|
Import-related |
|
|
|
6 |
|
|
|
|
|
|
|
|
|
|
|
|
|
|
|
|
||||
property |
|
|
|
|
|
|
|
|
|
|
|
|
|
|
|
|
|
|
|
|
|
|
|
|
|
|
|
|
|
|
|
|
|
|
|
|
|
|
|
|
|
|
||||||
|
|
|
|
|
|
|
|
|
|
|
|
|
|
|
|
|
|
|
|
|
|
|
|
|
|
|
|
|
|
|
|
|
|
|
|
|
|
|
|
|
|
|
|
|
|
|
||
Government |
|
|
|
|
|
|
|
7 |
|
|
|
|
|
|
|
|
|
|
|
|
|
|
|
Taxes |
|
|
|
6 |
|
|
|
|
|
|
|
|
|
|
|
|
|
|
|
|
||||
procurement |
|
|
|
|
|
|
|
|
|
|
|
|
|
|
|
|
|
|
|
|
|
|
|
|
|
|
|
|
|
|
|
|
|
|
|
|
|
|
|
|
|
|||||||
|
|
|
|
|
|
|
|
|
|
|
|
|
|
|
|
|
|
|
|
|
|
|
|
|
|
|
|
|
|
|
|
|
|
|
|
|
|
|
|
|
|
|
|
|
|
|
||
Customs |
|
|
|
|
|
|
|
5 |
|
|
|
|
|
|
|
|
|
|
|
|
|
|
|
|
Customs |
|
|
|
6 |
|
|
|
|
|
|
|
|
|
|
|
|
|
|
|
|
|||
procedures |
|
|
|
|
|
|
|
|
|
|
|
|
|
|
|
|
|
|
|
|
|
|
procedures |
|
|
|
|
|
|
|
|
|
|
|
|
|
|
|
|
|
|
|
||||||
|
|
|
|
|
|
|
|
|
|
|
|
|
|
|
|
|
|
|
|
|
|
|
|
|
|
|
|
|
|
|
|
|
|
|
|
|
|
|
|
|
|
|
|
|
||||
Anti-competitive |
|
|
|
|
|
|
|
5 |
|
|
|
|
|
|
|
|
|
|
|
|
|
|
|
|
Investment-related |
|
|
5 |
|
|
|
|
|
|
|
|
|
|
|
|
|
|
|
|
||||
practices |
|
|
|
|
|
|
|
|
|
|
|
|
|
|
|
|
|
|
|
|
|
|
|
|
|
|
|
|
|
|
|
|
|
|
|
|
|
|
|
|
||||||||
|
|
|
|
|
|
|
|
|
|
|
|
|
|
|
|
|
|
|
|
|
|
|
|
|
|
|
|
|
|
|
|
|
|
|
|
|
|
|
|
|
|
|
|
|
|
|
||
|
|
|
|
|
|
|
|
|
|
|
|
|
|
|
|
|
|
|
|
|
|
|
|
|
|
|
|
|
|
|
|
|
|
|
|
|
|
|
|
|
|
|
|
|
|
|
|
|
Export-related |
|
|
|
|
|
4 |
|
|
|
|
|
|
|
|
|
|
|
|
|
|
|
|
|
|
Export-related |
|
|
4 |
|
|
|
|
|
|
|
|
|
|
|
|
|
|
|
|
||||
|
|
|
|
|
|
|
|
|
|
|
|
|
|
|
|
|
|
|
|
|
|
|
|
|
|
|
|
|
|
|
|
|
|
|
|
|
|
|||||||||||
|
|
|
|
|
|
|
|
|
|
|
|
|
|
|
|
|
|
|
|
|
|
|
|
|
|
|
|
|
|
|
|
|
|
|
|
|
|
|
|
|
|
|
|
|
|
|
|
|
Corruption |
|
|
|
2 |
|
|
|
|
|
|
|
|
|
|
|
|
|
|
|
|
|
|
|
|
Government |
|
|
4 |
|
|
|
|
|
|
|
|
|
|
|
|
|
|
|
|
||||
|
|
|
|
|
|
|
|
|
|
|
|
|
|
|
|
|
|
|
|
|
|
|
procurement |
|
|
|
|
|
|
|
|
|
|
|
|
|
|
|
|
|
|
|
||||||
|
|
|
|
|
|
|
|
|
|
|
|
|
|
|
|
|
|
|
|
|
|
|
|
|
|
|
|
|
|
|
|
|
|
|
|
|
|
|
|
|
|
|
|
|
|
|
||
State-trading |
|
|
1 |
|
|
|
|
|
|
|
|
|
|
|
|
|
|
|
|
|
|
|
|
State-trading |
0 |
|
|
|
|
|
|
|
|
|
|
|
|
|
|
|
|
|
|
|
|
|||
|
|
|
|
|
|
|
|
|
|
|
|
|
|
|
|
|
|
|
|
|
|
|
|
|
|
|
|
|
|
|
|
|
|
|
|
|
|
|
|
|
||||||||
|
|
|
|
|
|
|
|
|
|
|
|
|
|
|
|
|
|
|
|
|
|
|
|
|
|
|
|
|
|
|
|
|
|
|
|
|
|
|
|
|
|
|
|
|
|
|
|
|
Taxes |
|
|
1 |
|
|
|
|
|
|
|
|
|
|
|
|
|
|
|
|
|
|
|
|
Corruption |
0 |
|
|
|
|
|
|
|
|
|
|
|
|
|
|
|
|
|
|
|
|
|||
|
|
|
|
|
|
|
|
|
|
|
|
|
|
|
|
|
|
|
|
|
|
|
|
|
|
|
|
|
|
|
|
|
|
|
|
|
|
|
|
|||||||||
|
|
|
|
|
|
|
|
|
|
|
|
|
|
|
|
|
|
|
|
|
|
|
|
|
|
|
|
|
|
|
|
|
|
|
|
|
|
|
|
|
|
|
|
|
|
|
|
|
0 |
|
5 |
|
10 |
|
15 |
20 |
25 |
30 |
0 |
5 |
10 |
15 |
20 |
25 |
30 |
35 |
40 |
||||||||||||||||||||||||||||||
Source: Martinez et al. (2009).
the number of “maintaining” and “raising” countries by income group, calculated as their share in the total number of countries in the respective income group.48 The results are clear-cut: developed countries participate more in the specific trade concerns mechanism than developing countries. Moreover,
econometric analysis shows that the amount of trade covered by concerns (coverage ratio and frequency index) is higher when the maintaining country is developed than when the maintaining country is developing, both for SPS and for TBT measures subject to specific trade concerns.49 However, the
114

II – Trade and public policies: A closer look at non-tariff measures in the 21st century
Figure C.13: Number of STC “maintaining” and “raising” countries as a share of the total number of countries by level of development, 1995-2010
(percentage)
(a) SPS (maintaining)
0.9 |
|
|
0.8 |
|
|
0.7 |
|
|
0.6 |
|
|
0.5 |
|
|
0.4 |
|
|
0.3 |
|
|
0.2 |
|
|
0.1 |
|
|
0 |
|
|
1995-2000 |
2000-2005 |
2005-2010 |
 Developed
  Developing
(b) SPS (raising) |
|
|
|
1 |
|
|
|
0.9 |
|
|
|
0.8 |
|
|
|
0.7 |
|
|
|
0.6 |
|
|
|
0.5 |
|
|
|
0.4 |
|
|
|
0.3 |
|
|
|
0.2 |
|
|
|
0.1 |
|
|
|
0 |
|
|
|
1995-2000 |
2000-2005 |
2005-2010 |
|
|
Developed |
Developing |
|
(c) TBT (maintaining)
0.6 |
|
|
0.5 |
|
|
0.4 |
|
|
0.3 |
|
|
0.2 |
|
|
0.1 |
|
|
0 |
|
|
1995-2000 |
2000-2005 |
2005-2010 |
 Developed
  Developing
(d) TBT (raising) |
|
|
|
1 |
|
|
|
0.9 |
|
|
|
0.8 |
|
|
|
0.7 |
|
|
|
0.6 |
|
|
|
0.5 |
|
|
|
0.4 |
|
|
|
0.3 |
|
|
|
0.2 |
|
|
|
0.1 |
|
|
|
0 |
|
|
|
1995-2000 |
2000-2005 |
2005-2010 |
|
|
Developed |
Developing |
|
Source: WTO STC Database.
Note: In the TBT dataset, a concern is assumed to be “resolved” if not raised again for two or more years. A “raising” country is the one which complains about a TBT/SPS measure imposed by a “maintaining” country in the relevant WTO committee.
inventoryA .C ofnon measures servicesand measures
tariff-
participation of developing countries has steadily increased over the years, not only as raising countries but also as maintaining countries.
The ITC business surveys also find greater use of TBT/SPS measures by developed economies. Figure C.14 shows the share of TBT/SPS measures (i.e. technical requirements plus conformity assessment) in import-related non-tariff measures, broken down by level of development. According to this figure, around three-quarters of burdensome NTMs reported by firms relate to TPT/SPS measures when the importing country is developed, whereas this share falls to around half when the importing country is developing.
Other survey-based evidence suggests that intraregional trade between African countries may be subject to a very different set of non-tariff measures. In support of efforts to establish a tri-partite free trade area between the Common Market for Eastern and Southern Africa (COMESA), the East African Community (EAC) and the Southern African Development Community (SADC), an online reporting system has been set up to register complaints about
NTMs and to seek resolution through a consultation process. Kalenga (2012) reviews complaints submitted to the online system between 2008 and 2011 and finds that administrative procedures are the most common source of problems for traders, while TBT/SPS measures play a minor role (see Table C.5). “Customs and administrative entry procedures” were cited in 41 per cent of complaints and “Other procedural problems” were mentioned in another 24 per cent of cases, for a combined total of 65 per cent. SPS and TBT measures were only responsible for 7 per cent and 5 per cent of complaints, respectively, for a total of 12 per cent. This combined share is the same as the share for “Specific limitations”, a category that includes quantitative restrictions and prohibitions. It is difficult to draw strong conclusions from such a small and possibly non-representative sample, but the data do suggest that TBT/SPS measures are much less widely used than other measures between African countries.
(d)Does the incidence of NTMs vary across sectors?
As discussed in Section B, there are good reasons to
expect the use of non-tariff measures to vary
115

world trade report 2012
Figure C.14: Burdensome NTMs applied by partner countries by level of development, 2010
(percentage)
100 |
|
|
90 |
|
|
25.6 |
|
|
80 |
|
|
70 |
50.6 |
|
|
||
60 |
|
|
50 |
|
|
40 |
|
|
74.4 |
|
|
30 |
49.4 |
|
20 |
||
|
||
10 |
|
|
0 |
|
|
Developed |
Developing |
|
TBT/SPS |
All other measures |
Source: ITC business surveys on NTMs.
Note: Surveys were conducted in 11 developing and leastdeveloped economies: Burkina Faso, Egypt, Jamaica, Kenya, Madagascar, Mauritius, Morocco, Paraguay, Peru, Rwanda and Uruguay. Minerals and arms are excluded from the survey.
significantly across sectors. Indeed, NTMs appear to affect certain sectors disproportionately, but the extent of the impact is sensitive to the way that sectors are defined. Unfortunately, there is considerable scope for confusion due to the existence of multiple competing statistical definitions. For example, at least three definitions of agricultural products are widely used: the definition from the WTO Agreement on Agriculture (AOA), the definition that appears in the WTO’s statistical publications based on the Standard International Trade Classification (SITC), and the first 24 chapters of the Harmonized System (HS) trade nomenclature.
The AOA definition is the narrowest as it reflects negotiating concerns rather than analytical requirements. The SITC-based WTO definition is the
broadest, but it is poorly suited to empirical research since tariffs are generally defined in terms of the HS classification. Chapters 1 to 24 of the HS classification represent a reasonable compromise between an intuitive understanding of what constitutes agricultural products and analytical tractability. For this reason, it is adopted as our standard definition, with nonagricultural products defined negatively as all other products. This should not be confused with nonagricultural products as used in on-agricultural market access (NAMA) negotiations, which are defined as all non-AOA products. The main difference between these definitions is the treatment of fish and fish products, which are taken to be agricultural products in this report but are treated as non-agricultural products in AOA/NAMA. Neither the AOA nor the HS definition includes wood, which may be highly relevant to the SPS Agreement since wood products have been known to harbour invasive species that can be highly damaging to the importing country.50
Using the STC Database, one can get a sense of the type of sectors most affected by specific trade concerns. A first distinction is between the agriculture and non-agricultural sectors. Concerns about SPS measures overwhelmingly affect the agriculture sector (251 of the 267 specific trade concerns for which an HS sector could be identified, that is 94 per cent).51 For TBT measures, out of the 283 specific trade concerns for which an HS sector could be identified, 82 (29 per cent) are in agriculture and 184 (65 per cent) in other sectors.52 However, econometric analysis shows that the coverage ratio and the frequency index of TBT measures subject to specific trade concerns are higher in agricultural sectors than non-agricultural ones.53
For both SPS and TBT measures, frequency indexes and coverage ratios are lower in sectors characterized by a higher incidence of intermediate products.54 As argued in Section B, the theory of trade agreements under offshoring predicts that, in the presence of trade
Table C.5: Complaints about NTMs in COMESA-EAC-SADC, 2008-11 |
|
|
(number and percentage) |
|
|
|
Number of |
Share in total |
|
complaints |
|
|
|
|
|
|
|
1: Government participation in trade and restrictive practices tolerated by governments |
37 |
10 |
|
|
|
2: Customs and administrative procedures |
151 |
41 |
|
|
|
3: Technical barriers to trade (TBT) |
19 |
5 |
|
|
|
4: Sanitary and phytosanitary (SPS) measures |
24 |
7 |
|
|
|
5: Specific limitations |
43 |
12 |
|
|
|
6: Charges on imports |
7 |
2 |
|
|
|
7: Other procedural problems |
87 |
24 |
|
|
|
Total |
368 |
100 |
|
|
|
Source: COMESA-EAC-SADC online NTM complaint system, Kalenga (2012).
116

II – Trade and public policies: A closer look at non-tariff measures in the 21st century
in intermediate inputs and bilateral price bargaining between foreign suppliers and domestic buyers, the level of the behind-the-border non-tax regulatory policies applied to foreign exports is set higher than would be efficient, because of rent-shifting (i.e. shifting profits from the foreign to the domestic producer) (Staiger, 2012).55 The regressions of the incidence of TBT/SPS measures on the sectoral share of intermediate products do not constitute a rigorous test of the theory of trade agreements under offshoring. Such a test would require detailed data on the intensity of intermediate products and the amount of bilateral bargaining. However, the result that the amount of trade covered by specific trade concerns is lower in intermediate-intensive sectors seems to indicate that motivations other than rent-shifting may drive the use of TBT/SPS measures in these sectors (see Section E.4 for a detailed discussion).
Evidence that agricultural products are disproportionately affected by non-tariff measures is echoed in the ITC business surveys and illustrated by Figure C.15, which shows the incidence of burdensome NTMs by sector of the reporting firms.56 In total, about 53 per cent of businesses said they were negatively affected by NTMs or related obstacles to trade, but this share was higher for businesses in the agricultural sector (60 per cent) and lower among manufacturing firms (51 per cent). These shares were calculated by taking the simple average over the 11 available countries in the ITC surveys, but the contrast between agriculture and manufacturing is somewhat stronger when averages are weighted by exports in each sector. In this case, the incidence of NTMs in agriculture was 63 per cent, whereas it was only 45 per cent for manufacturing.
Not only is the incidence of non-tariff measures higher in the agricultural sector, but different types of
Figure C.15: Incidence of NTMs by sector, 2010
(percentage)
70 |
|
|
60.1 62.5 |
|
60 |
|
|
|
|
53.4 |
51.2 |
|
50.8 |
|
50 |
|
|||
|
|
|
45.1 |
|
|
|
|
|
|
40 |
|
|
|
|
30 |
|
|
|
|
20 |
|
|
|
|
10 |
|
|
|
|
0 |
|
|
|
|
|
Total |
Agriculture |
Manufacturing |
|
Simple average |
Trade weighted average |
|
|
Source: ITC business surveys on NTMs.
Note: Surveys were conducted in 11 developing and leastdeveloped economies: Burkina Faso, Egypt, Jamaica, Kenya, Madagascar, Mauritius, Morocco, Paraguay, Peru, Rwanda and Uruguay. Minerals and arms are excluded from the survey.
measures are also used compared with the manufacturing sector. Figure C.16 shows the distribution of NTMs by type of measure in agriculture and manufacturing. Exporters of agricultural products report more problems related to TBT/SPS measures (i.e. technical requirements plus conformity assessment) than exporters of manufactured goods (59 per cent for the former, 34 per cent for the latter). On the other hand, pre-shipment inspection, para-tariff measures57 and rules of origin (i.e. laws, regulations and administrative procedures which determine a product’s country of origin) are comparatively more
Figure C.16: Type of NTM by sector, 2010
(percentage)
Agriculture
Technical requirements 24%
Exportmeasures
Other import-related measures 1%
Rules of origin 6%
Quantity control measures 3%
Para-tariff |
|
|
|
|
|
|
|
|
|
|
|
|
|
|
|
|
|
||
measures 4% |
|
|
|
|
|
Conformity |
|
||
|
|
|
|
|
|
|
|
||
Pre-shipment |
|
assessment |
|
||||||
inspection 3% |
|
36% |
|
||||||
|
|
|
|
|
|
|
Manufacturing |
||
Technical requirements 10% |
|
|
|
|
|||||
|
|
|
|
||||||
Export-related |
|
|
|
|
|
|
|
|
|
|
|
|
|
||||||
measures |
|
|
|
||||||
|
|
|
|||||||
Other import-related measures 2%
Rules of origin 14%
Finance measures 2%
Quantity control
measures 5% Para-tariff measures 8% Pre-shipment inspection 8%
Conformity assessment 24%
Source: ITC business surveys on NTMs.
Note: Surveys were conducted in 11 developing and leastdeveloped economies: Burkina Faso, Egypt, Jamaica, Kenya, Madagascar, Mauritius, Morocco, Paraguay, Peru, Rwanda and Uruguay. Minerals and arms are excluded from the survey.
inventoryA .C ofnon measures servicesand measures
tariff-
117

world trade report 2012
challenging for exporters of non-agricultural products. Export-related measures seem to present fewer problems for agricultural exporters than for manufacturers, since the share of these measures in all reported NTM cases is 4 percentage points lower in the agricultural sector (23 per cent) than in manufacturing (27 per cent).
Data on disputes from Santana and Jackson (2012) also point to a higher incidence of TBT/SPS measures in agricultural products (AOA definition) than in non-
agricultural products (see Table C.6). SPS and TBT measures were both cited in 28 per cent of disputes during the 2007-11 period, whereas disputes involving non-agricultural products only mentioned the TBT Agreement 3 per cent of the time and the SPS Agreement not at all. This 28 per cent share in citations was greater than for any other agreement other than the General Agreement on Tariffs and Trade (GATT), which was mentioned in 60 per cent of cases after adjustment to eliminate duplicate citations. TBT/SPS citations in agriculture-related disputes have
Table C.6: Agreements cited in disputes related to trade in agricultural and non-agricultural productsa
(percentage and number)
|
1995-2000 |
2001-2006 |
2007-2011 |
1995-2011 |
|
|
|
|
|
|
Agricultural products (AoA definition) |
|
|
|
|
|
|
|
|
Anti-dumping |
12.3 |
11.1 |
12.0 |
11.8 |
|
|
|
|
|
Agriculture |
45.6 |
31.5 |
24.0 |
36.0 |
|
|
|
|
|
Textiles and clothing |
1.8 |
0.0 |
0.0 |
0.7 |
|
|
|
|
|
Customs valuation |
7.0 |
1.9 |
8.0 |
5.1 |
|
|
|
|
|
General Agreement on Tariffs and Trade (GATT) |
59.6 |
61.1 |
60.0 |
60.3 |
|
|
|
|
|
Import licensing |
24.6 |
9.3 |
0.0 |
14.0 |
|
|
|
|
|
Rules of origin |
1.8 |
0.0 |
8.0 |
2.2 |
|
|
|
|
|
Subsidies and countervailing measures |
7.0 |
20.4 |
16.0 |
14.0 |
|
|
|
|
|
Safeguards |
8.8 |
18.5 |
0.0 |
11.0 |
|
|
|
|
|
Sanitary and phytosanitary measures |
17.5 |
20.4 |
28.0 |
20.6 |
|
|
|
|
|
Technical barriers to trade |
17.5 |
7.4 |
28.0 |
15.4 |
|
|
|
|
|
Trade-related investment measures |
7.0 |
5.6 |
0.0 |
5.1 |
|
|
|
|
|
Total number of agriculture disputes |
57 |
54 |
25 |
136 |
|
|
|
|
|
|
Non-agricultural products (NAMA) |
|
|
|
|
|
|
|
|
Anti-dumping |
22.0 |
42.6 |
47.1 |
33.2 |
|
|
|
|
|
Agriculture |
0.0 |
1.5 |
0.0 |
0.5 |
|
|
|
|
|
Textiles and clothing |
12.0 |
1.5 |
0.0 |
6.4 |
|
|
|
|
|
Customs valuation |
2.0 |
0.0 |
0.0 |
1.0 |
|
|
|
|
|
GATT (adjusted) b |
47.0 |
54.4 |
41.2 |
48.5 |
Government procurement |
2.0 |
0.0 |
0.0 |
1.0 |
|
|
|
|
|
Import licensing |
2.0 |
2.9 |
2.9 |
2.5 |
|
|
|
|
|
Rules of origin |
2.0 |
2.9 |
0.0 |
2.0 |
|
|
|
|
|
Subsidies and countervailing measures |
25.0 |
30.9 |
20.6 |
26.2 |
|
|
|
|
|
Safeguards |
7.0 |
19.1 |
11.8 |
119.0 |
|
|
|
|
|
Sanitary and phytosanitary measures |
6.0 |
0.0 |
0.0 |
3.0 |
|
|
|
|
|
Technical barriers to trade |
13.0 |
4.4 |
2.9 |
8.4 |
|
|
|
|
|
Trade-related investment measures |
12.0 |
4.4 |
5.9 |
8.4 |
|
|
|
|
|
Total number of non-agriculture disputes |
100 |
68 |
34 |
202 |
Source: WTO Secretariat estimates.
Note: Although there were 427 requests for consultations filed under the Dispute Settlement Understanding as of 31 December 2011, this table focuses on 393 disputes in goods, i.e. it excludes 25 disputes with claims mainly involving TRIPS and nine disputes with claims mainly involving the GATS.
aThe breakdown by agriculture/non-agriculture is based on Santana and Jackson (2012). The table excludes 55 disputes involving “generic or mixed” products.
bThis table follows the methodology of Santana and Jackson (2012) to eliminate duplicate citations of the GATT.
118
II – Trade and public policies: A closer look at non-tariff measures in the 21st century
also increased over time, rising from 18 per cent in 1995-2001 to 28 per cent in 2007-11.
(e)What kinds of procedural obstacles are associated with NTMs?
Non-tariff measures pose many challenges for exporting firms, but more often than not it is the manner of implementation rather than the measure itself that causes problems for businesses. As noted in Section C.1, these implementation issues are referred to as “procedural obstacles” in the new multiagency data classification on NTMs. For example, a country could have very high standards for imported goods, making it difficult for exporters to comply with these standards. On the other hand, exporters that managed to comply with the regulations might still have problems demonstrating their compliance, or else might face long delays before their goods are admitted into the importing country. In the first case, an exporter could perceive the NTM itself to be the main impediment to trade, whereas in the second case they might view the procedural obstacle as the source of their difficulty.
In practice, data on procedural obstacles can only be collected through surveys such as the ITC business surveys. Figure C.17 shows shares of reported nontariff measures in the ITC surveys with and without procedural obstacles associated with them. The average share of procedural obstacles is 77 per cent if we take the simple average over the 11 countries where surveys have been conducted. The use of a trade-weighted average reduces this share slightly to 72 per cent.
The types of procedural obstacles that businesses report are shown in Figure C.18. The most commonly mentioned obstacle is “time constraints”, including delays related to regulations and short deadlines
for |
submitting |
documentation. This |
accounts |
for |
35 |
per cent |
of reported obstacles, |
followed |
by |
“high/informal payments” at 22 per cent, and “administrative burdens” at 17 per cent. There are smaller shares for other reported procedural obstacles.
The incidence of procedural obstacles varies widely across different types of non-tariff measures (see Figure C.19). For example, nearly 80 per cent of firms reporting burdensome conformity assessment measures also encountered procedural obstacles. On the other hand, the incidence of procedural obstacles in technical requirements was just 55 per cent. Procedural obstacles were reported less frequently for government procurement restrictions (0 per cent), subsidies (also 0 per cent) and price control measures (25 per cent), including anti-dumping and countervailing measures. They occurred most frequently in measures related to intellectual property (100 per cent) and export-related measures (88 per cent).
(f)How have NTMs evolved since the global financial crisis?
The sharp declines in global trade and output that followed the financial crisis in 2008-09 raised fears of a re-run of the 1930s, when protectionism exacerbated and prolonged the Great Depression. Efforts by the WTO and others to monitor trade policy developments in the aftermath of the crisis initially found that most countries had managed in 2009-10 to avoid the worst
Figure C.17: Share of NTMs with and without procedural obstacles, 2010
(percentage)
100 |
|
90 |
|
76.5 |
71.7 |
80 |
|
70 |
|
60 |
|
50 |
|
40 |
|
30 |
|
20 |
|
23.5 |
28.3 |
10 |
|
0 |
|
Simple average |
Trade-weighted average |
 NTM only
  NTM with PO
Source: ITC business surveys on NTMs.
Note: Surveys were conducted in 11 developing and leastdeveloped economies: Burkina Faso, Egypt, Jamaica, Kenya, Madagascar, Mauritius, Morocco, Paraguay, Peru, Rwanda and Uruguay. Minerals and arms are excluded from the survey.
Figure C.18: Shares of reported procedural obstacles by type, 2010
(percentage)
Unspecified 4% |
|
|
|
|
Technical requirements |
||||||
|
|
|
|
|
|||||||
Other 2% |
|
|
|
|
|
17% |
|
||||
Recognition, |
|
|
|
|
|
|
|
|
Information or |
||
|
|
|
|
|
|
|
transparency |
||||
accreditation 1% |
|
|
|
|
issues 5% |
||||||
Lack of |
|
|
|
|
|
|
|
|
|
||
|
|
|
|
|
|
|
|
|
|
|
|
|
|
|
|
|
|
|
|
|
|
|
|
|
|
|
|
|
|
|
|||||
facilities 8% |
|
|
|
|
|
||||||
|
|
|
|
|
|
|
|
|
|
|
|
Informal or unusually high payment 22%
Discriminatory
Time constraints 35% behaviour 6%
Source: ITC business surveys on NTMs.
Note: Surveys were conducted in 11 developing and leastdeveloped economies: Burkina Faso, Egypt, Jamaica, Kenya, Madagascar, Mauritius, Morocco, Paraguay, Peru, Rwanda and Uruguay. Minerals and arms are excluded from the survey.
inventoryA .C ofnon measures servicesand measures
tariff-
119

world trade report 2012
Figure C.19: Shares of NTMs with and without procedural obstacles by type of NTM, 2010
(percentage)
Technical requirements |
|
|
|
|
|
|
|
|
|
|
|
|
|
|
|
|
|
|
|
|
|
|
|
|
44.7 |
|
|
|
|
|
|
|
55.3 |
|
|
|
|
|
|
||||
|
|
|
|
|
|
|
|
|
|
|
|
|
|
|
|
|
|
|
|
|
|
Conformity assessment |
|
|
|
|
|
|
|
|
|
|
|
|
|
|
|
|
|
|
|
|
|
20.5 |
|
|
|
|
|
|
|
|
79.5 |
|
|
|
|
|
|
|
|
||||
|
|
|
|
|
|
|
|
|
|
|
|
|
|
|
|
|
|
|
|
|
|
Pre-shipment inspection |
28.9 |
|
|
|
|
|
|
|
71.1 |
|
|
|
|
|
|
|
|
||||
|
|
|
|
|
|
|
|
|
|
|
|
|
|
|
|
|
|
|
|
||
Para-tariff measures |
32.9 |
|
|
|
|
|
|
67.1 |
|
|
|
|
|
|
|
||||||
|
|
|
|
|
|
|
|
|
|
|
|
|
|
|
|
|
|
|
|
|
|
Quantity control measures |
28.2 |
|
|
|
|
|
|
|
71.8 |
|
|
|
|
|
|
|
|
||||
|
|
|
|
|
|
|
|
|
|
|
|
|
|
|
|
|
|
|
|
|
|
Finance measures |
27.5 |
|
|
|
|
|
|
|
72.5 |
|
|
|
|
|
|
|
|
||||
|
|
|
|
|
|
|
|
|
|
|
|
|
|
|
|
|
|
|
|
|
|
Price control measures |
|
|
|
|
|
|
|
|
|
|
|
|
|
|
|
|
|
|
|
|
|
|
|
|
|
|
|
75.0 |
|
|
|
|
|
|
|
|
25.0 |
|
|
||||
|
|
|
|
|
|
|
|
|
|
|
|
|
|
|
|
|
|
|
|
|
|
Anti-competitive measures |
19.4 |
|
|
|
|
|
|
|
|
80.6 |
|
|
|
|
|
|
|
|
|||
|
|
|
|
|
|
|
|
|
|
|
|
|
|
|
|
|
|
|
|
|
|
Subsidies |
|
|
|
|
|
|
|
|
100.0 |
|
|
|
|
|
|
|
|
|
|
||
|
|
|
|
|
|
|
|
|
|
|
|
|
|
|
|
|
|
|
|
|
|
Government procurement |
|
|
|
|
|
|
|
|
100.0 |
|
|
|
|
|
|
|
|
|
|
||
|
|
|
|
|
|
|
|
|
|
|
|
|
|
|
|
|
|
|
|
|
|
Intellectual property |
|
|
|
|
|
|
|
|
|
|
|
|
|
|
|
|
|
|
|
|
|
|
|
|
|
|
|
|
|
100.0 |
|
|
|
|
|
|
|
|
|
|
|||
|
|
|
|
|
|
|
|
|
|
|
|
|
|
|
|
|
|
|
|
|
|
Rules of origin |
|
|
|
|
|
|
|
|
|
|
|
|
|
|
|
|
|
|
|
|
|
18.8 |
|
|
|
|
|
|
|
|
81.2 |
|
|
|
|
|
|
|
|
||||
|
|
|
|
|
|
|
|
|
|
|
|
|
|
|
|
|
|
|
|
|
|
Export-related measures |
|
|
|
|
|
|
|
|
|
|
|
|
|
|
|
|
|
|
|
|
|
12.5 |
|
|
|
|
|
|
|
|
|
87.5 |
|
|
|
|
|
|
|
|
|||
|
|
|
|
|
|
|
|
|
|
|
|
|
|
|
|
|
|
|
|
|
|
0 |
10 |
|
20 |
30 |
40 |
50 |
60 |
70 |
80 |
90 |
100 |
||||||||||
 NTM only
  NTM with PO
Source: ITC business surveys on NTMs.
Note: Surveys were conducted in 11 developing and least-developed economies: Burkina Faso, Egypt, Jamaica, Kenya, Madagascar, Mauritius, Morocco, Paraguay, Peru, Rwanda and Uruguay. Minerals and arms are excluded from the survey.
forms of protectionism, but developments in 2011 point to increasing trade friction and a rise in the number of restrictive trade measures. To the extent that trade policy has become more restrictive recently, it appears that most of the increase is due to non-tariff measures.
Table C.7 summarizes evidence from WTO monitoring reports since 2008. The number of new restrictive measures rose from 53 in 2008 to 346 in 2009 at the height of the crisis. New restrictive measures then fell back to 306 in 2010 but increased again to 344 in the first 10 months of 2011. The number of liberalizing measures was slightly greater than the number of restrictive ones in 2010, which suggests little or no change in the overall level of protectionism that year. However, there was a net increase in the number of restrictive measures in 2011, as liberalizing actions fell to 304 from 323 in the previous year, while restrictive ones rose to 344 from 306.
Only 8 per cent of restrictive measures introduced in 2008 were tariffs, but this share rose to 16 per cent in 2009, then to 20 per cent in 2010 before falling back to 19 per cent in the first ten months of 2011. Table C.7 excludes TBT and SPS measures, so the tariff share is somewhat exaggerated. SPS and TBT measures are intentionally not tracked in WTO monitoring reports in order to avoid having to make any judgment as to whether such measures are justified on public policy
grounds.
120
In the aftermath of the crisis, countries immediately resorted to trade “remedies”, such as anti-dumping actions and countervailing duties, as evidenced by a sharp increase in the number of restrictive measures from 38 in 2008 to 196 in 2009, but this later fell to 132 in 2010 and to 104 in 2011. In 2010, the number of restrictive trade remedies was roughly equal to the number of liberalizing measures, bringing their net contribution to the stock of restrictive trade measures close to zero, while in 2011 liberalizing actions outnumbered restrictive ones.
One notable feature of Table C.7 is the spike in the number of restrictive non-tariff measures from 30 in 2010 to 81 in 2011. At the same time, the number of liberalizing NTMs fell from 23 to 13. The recent increase in restrictive measures is attributable to a number of developments, including stricter import controls and licensing requirements in some countries, as well as import prohibitions imposed on some Japanese goods following the Fukushima nuclear accident in March 2011. Some of the main countries imposing the new measures in 2011 were Indonesia, India and Argentina.
Evidence from the WTO’s monitoring reports leads us to conclude that the use of non-tariff measures has risen relative to tariffs since the financial crisis, although there are exceptions for individual countries. In every year since 2008, new restrictive non-tariff measures have outnumbered liberalizing actions. Meanwhile, the number of liberalizing tariff measures
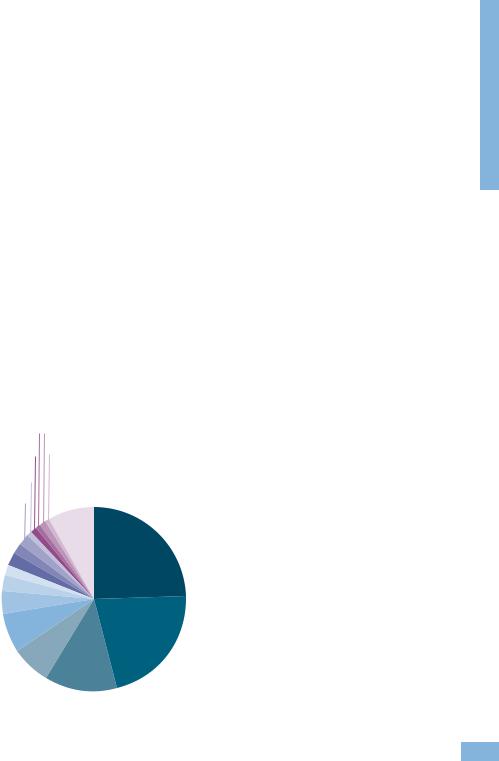
II – Trade and public policies: A closer look at non-tariff measures in the 21st century
Table C.7: Trade and trade-related measures, 2008-2011 |
|
|
|
|
|
|
|
|
||||||||||||||||||||||
(number of new measures) |
|
|
|
|
|
|
|
|
|
|
|
|
|
|
|
|
|
|
|
|
|
|
|
|
|
|
|
|
|
|
|
2008a |
|
|
|
|
|
|
|
2009 |
|
|
2010 |
|
|
2011b |
|
|
|||||||||||||
|
Restrictive |
Liberalizing |
|
|
Restrictive Liberalizing |
Restrictive |
Liberalizing |
Restrictive Liberalizing |
|
|||||||||||||||||||||
|
|
|
|
|
|
|
|
|
|
|
|
|
|
|
|
|
|
|
|
|
|
|
|
|
|
|
|
|
|
|
Trade Remedy |
38 |
30 |
|
|
|
|
|
|
|
|
196 |
|
|
|
|
127 |
|
132 |
134 |
|
|
104 |
118 |
|
||||||
|
|
|
|
|
|
|
|
|
|
|
|
|
|
|
|
|
|
|
|
|
|
|
|
|
|
|
|
|
|
|
Anti-dumping |
31 |
29 |
|
|
|
|
|
|
|
|
133 |
|
|
|
|
95 |
|
97 |
106 |
|
|
79 |
107 |
|
||||||
|
|
|
|
|
|
|
|
|
|
|
|
|
|
|
|
|
|
|
|
|
|
|
|
|
|
|
|
|
|
|
Countervailing |
2 |
1 |
|
|
|
|
|
|
|
|
23 |
|
|
|
|
12 |
|
11 |
8 |
|
|
12 |
6 |
|
||||||
|
|
|
|
|
|
|
|
|
|
|
|
|
|
|
|
|
|
|
|
|
|
|
|
|
|
|
|
|
|
|
Safeguards |
5 |
0 |
|
|
|
|
|
|
|
|
40 |
|
|
|
|
20 |
|
24 |
20 |
|
|
13 |
5 |
|
||||||
|
|
|
|
|
|
|
|
|
|
|
|
|
|
|
|
|
|
|
|
|
|
|
|
|
|
|
|
|
|
|
Border |
10 |
12 |
|
|
|
|
|
|
|
|
117 |
|
|
|
|
68 |
|
98 |
145 |
|
|
154 |
137 |
|
||||||
|
|
|
|
|
|
|
|
|
|
|
|
|
|
|
|
|
|
|
|
|
|
|
|
|
|
|
|
|
|
|
Tariff |
4 |
11 |
|
|
|
|
|
|
|
|
57 |
|
|
|
|
43 |
|
61 |
122 |
|
|
66 |
124 |
|
||||||
|
|
|
|
|
|
|
|
|
|
|
|
|
|
|
|
|
|
|
|
|
|
|
|
|
|
|
|
|
|
|
Tax |
0 |
0 |
|
|
|
|
|
|
|
|
0 |
|
|
|
|
0 |
|
7 |
0 |
|
|
7 |
0 |
|
||||||
|
|
|
|
|
|
|
|
|
|
|
|
|
|
|
|
|
|
|
|
|
|
|
|
|
|
|
|
|
|
|
Non-tariff |
|
|
|
|
|
|
|
|
|
|
|
|
|
|
|
|
|
|
|
|
|
|
|
|
|
|
|
|
|
|
barrierc |
6 |
1 |
|
|
|
|
|
|
|
|
60 |
|
|
|
|
25 |
|
30 |
23 |
|
|
81 |
13 |
|
||||||
Export |
2 |
3 |
|
|
|
|
|
|
|
|
13 |
|
|
|
|
10 |
|
47 |
19 |
|
|
66 |
35 |
|
||||||
|
|
|
|
|
|
|
|
|
|
|
|
|
|
|
|
|
|
|
|
|
|
|
|
|
|
|
|
|
|
|
Duty |
2 |
3 |
|
|
|
|
|
|
|
|
4 |
|
|
|
|
6 |
|
19 |
3 |
|
|
15 |
7 |
|
||||||
|
|
|
|
|
|
|
|
|
|
|
|
|
|
|
|
|
|
|
|
|
|
|
|
|
|
|
|
|
|
|
Quota |
0 |
0 |
|
|
|
|
|
|
|
|
0 |
|
|
|
|
0 |
|
3 |
3 |
|
|
12 |
6 |
|
||||||
|
|
|
|
|
|
|
|
|
|
|
|
|
|
|
|
|
|
|
|
|
|
|
|
|
|
|
|
|
|
|
Ban |
0 |
0 |
|
|
|
|
|
|
|
|
1 |
|
|
|
|
1 |
|
14 |
9 |
|
|
23 |
14 |
|
||||||
|
|
|
|
|
|
|
|
|
|
|
|
|
|
|
|
|
|
|
|
|
|
|
|
|
|
|
|
|
|
|
Other |
0 |
0 |
|
|
|
|
|
|
|
|
8 |
|
|
|
|
3 |
|
11 |
4 |
|
|
16 |
8 |
|
||||||
|
|
|
|
|
|
|
|
|
|
|
|
|
|
|
|
|
|
|
|
|
|
|
|
|
|
|
|
|
|
|
Other |
3 |
1 |
|
|
|
|
|
|
|
|
20 |
|
|
|
|
12 |
|
29 |
25 |
|
|
20 |
14 |
|
||||||
|
|
|
|
|
|
|
|
|
|
|
|
|
|
|
|
|
|
|
|
|
|
|
|
|
|
|
|
|
|
|
Total |
53 |
46 |
|
|
|
|
|
|
|
|
346 |
|
|
|
|
217 |
|
306 |
323 |
|
|
344 |
304 |
|
||||||
|
|
|
|
|
|
|
|
|
|
|
|
|
|
|
|
|
|
|
|
|
|
|
|
|
|
|
|
|
||
aCovers the period from October to December 2008. |
|
|
|
|
|
|
|
|
|
|
|
|
|
|
|
|||||||||||||||
bUp to mid-October 2011. |
|
|
|
|
|
|
|
|
|
|
|
|
|
|
|
|
|
|
|
|
|
|
|
|
|
|
|
|
|
|
cExcluding SPS and TBT measures. |
|
|
|
|
|
|
|
|
|
|
|
|
|
|
|
|
|
|
|
|
|
|||||||||
Source: WTO Secretariat Monitoring Reports. |
|
|
|
|
|
|
|
|
|
|
|
|
|
|
|
|
|
|
|
|
|
|||||||||
has been greater than the number of restrictive tariff |
findings of WTO monitoring reports. According to |
|
||||||||||||||||||||||||||||
measures in every period except 2009. Regarding the |
the Ninth GTA Report, tariffs |
accounted |
for just |
|
||||||||||||||||||||||||||
relative importance of tariffs and NTMs, data from |
13 per cent of all new, clearly restrictive trade |
|
||||||||||||||||||||||||||||
the Global Trade Alert are largely consistent with the |
measures introduced since 2009 (see Figure C.20).58 |
|
||||||||||||||||||||||||||||
|
|
|
|
|
|
|
|
|
|
|
|
|
|
|
|
|
|
|
|
|
||||||||||
Figure C.20: Composition of new restrictive trade measures, 2008-2011 |
|
|
|
|||||||||||||||||||||||||||
(percentage) |
|
|
|
|
|
|
|
|
|
|
|
|
|
|
|
|
|
|
|
|
|
|
|
|
|
|
|
|
|
|
|
Local content public procurement 1% |
Consumption subsidy 1% |
|
|
|
|
|
|
|
|
||||||||||||||||||||
|
|
SPS measures 1% |
TBT measures 1% |
|
|
|
|
|
|
|
|
|||||||||||||||||||
|
Quota (including tariff rate quotas) 1% |
|
|
|
Other 8% |
|
Bail out/state aid 25% |
|
|
|
||||||||||||||||||||
|
|
|
|
|
|
|
|
|||||||||||||||||||||||
|
|
|
|
|
|
|
|
|
|
|
|
|||||||||||||||||||
|
|
Trade finance 2% |
|
|
|
|
|
|
|
|
|
|
|
|
|
|
|
|||||||||||||
|
Import ban 2% |
|
|
|
|
|
|
|
|
|
|
|
|
|
|
|
|
|
|
|
|
|
|
|||||||
|
|
|
|
|
|
|
|
|
|
|
|
|
|
|
|
|
|
|
|
|
|
|
|
|||||||
|
Export subsidy 2% |
|
|
|
|
|
|
|
|
|
|
|
|
|
|
|
|
|
|
|
|
|
|
|
|
|
||||
|
|
|
|
|
|
|
|
|
|
|
|
|
|
|
|
|
|
|
|
|
|
|
||||||||
Investment measure 2% |
|
|
|
|
|
|
|
|
|
|
|
|
|
|
|
|
|
|
|
|
|
|
|
|
|
|
|
|
||
|
|
|
|
|
|
|
|
|
|
|
|
|
|
|
|
|
|
|
|
|
|
|
|
|
|
|
||||
|
|
|
|
|
|
|
|
|
|
|
|
|
|
|
|
|
|
|
|
|
|
|
|
|
|
|
||||
Public procurement 3% |
|
|
|
|
|
|
|
|
|
|
|
|
|
|
|
|
|
|
|
|
|
|
||||||||
|
|
|
|
|
|
|
|
|
|
|
|
|
|
|
|
|
|
|
|
|
|
|||||||||
|
Migration measure 4% |
|
|
|
|
|
|
|
|
|
|
|
|
|
|
|
|
|
|
|
|
|
|
|||||||
|
|
|
|
|
|
|
|
|
|
|
|
|
|
|
|
|
|
|
|
|
|
|
||||||||
|
Export taxes/restriction 7% |
|
|
|
|
|
|
|
|
|
|
|
|
|
|
|
|
|
|
|
|
|
||||||||
|
|
|
|
|
|
|
|
|
|
|
|
|
|
|
|
|
|
|
|
|
|
|||||||||
|
|
|
|
|
|
|
|
|
|
|
|
|
|
|
|
|
|
|
|
|
|
|||||||||
|
|
|
|
|
|
|
|
|
|
|
|
|
|
|
|
|
|
|
|
|
|
|||||||||
|
Non-tariff barrier n.e.s. 7% |
|
|
|
|
|
|
|
|
|
|
Trade defence (anti-dumping, |
|
|
||||||||||||||||
|
|
|
|
|
|
|
|
|
|
|
|
|||||||||||||||||||
|
|
|
|
|
|
|
|
|
|
Tariffs 13% |
|
|
|
|
|
|
|
|
|
|||||||||||
|
|
|
|
|
|
|
|
|
|
|
|
|
|
|
|
|
countervailing duties, safeguards) 22% |
|
|
|||||||||||
|
|
|
|
|
|
|
|
|
|
|
|
|
|
|
|
|||||||||||||||
Source: Evenett (2011). |
|
|
|
|
|
|
|
|
|
|
|
|
|
|
|
|
|
|
|
|
|
|
|
|
|
|
|
|
|
|
|
|
|
|
|
|
|
|
|
|
|
|
|
|
|
|
|
|
|
|
|
|
|
|
|
|
|
|
|
|
|
inventoryA .C ofnon measures servicesand measures
tariff-
121