


world trade report 2012
I. World trade in 2011
World trade growth decelerated sharply in 2011 as the global economy struggled under the influence of natural disasters, financial uncertainty and civil conflict. A slowdown in trade had been expected after the strong rebound of 2010 but the earthquake in Japan and flooding in Thailand shook global supply chains, and fears of sovereign default in the euro area weighed heavily in the closing months of the year. The civil war in Libya also reduced oil supplies and contributed to sharply higher prices. All of these factors combined to produce below average growth in trade in 2011.
16

I – World Trade in 2011
Introduction .A
Contents
A |
Introduction |
18 |
B State of the world economy and trade in 2011 |
20 |
|
C |
Appendix figures and tables |
26 |
17
world trade report 2012
A. Introduction
The volume of world merchandise trade rose 5.0 per cent in 2011, accompanied by global output growth of 2.4 per cent. This marked a significant slowdown from 2010, when trade advanced 13.8 per cent and output expanded by 3.8 per cent (see Figure 1.1).1
Slower growth in both trade and output had been anticipated for 2011, but multiple economic shocks held back economic activity and trade during the year. The earthquake, tsunami and nuclear incident that hit Japan in March sharply depressed the country's exports in the second quarter, while flooding in Thailand reduced the supply of key parts and components in the fourth quarter and further distorted global production networks. Turmoil in North African countries took a toll on the region's exports, especially in Libya, where oil production and exports plunged. Finally, negative gross domestic product (GDP) growth in the European Union reduced demand for imported goods in the fourth quarter as the euro sovereign debt crisis came to a head.
The sluggish pace of economic growth in 2011 reduced import demand in the largest economies and resulted in global export growth below the WTO's forecast of 5.8 per cent. Japan's output contracted in the fourth quarter after recording just one-quarter of expansion on the year in the third quarter. Even China’s dynamic economy appeared to be slowing towards the end of the year as its fourth quarter GDP growth slipped to an annualized rate of 7.8 per cent after averaging around 9.5 per cent over the first three quarters, according to data from China’s National Bureau of Statistics. Economic indicators improved in the United States in the closing months of 2011 as output growth accelerated to 3.0 per cent annualized in the fourth
quarter and unemployment fell to 8.3 per cent in December according to data from the OECD, but this only partly made up for earlier setbacks.
Developed economies exceeded expectations with export growth of 4.7 per cent in 2011 while developing economies (for the purposes of the analysis, this includes the Commonwealth of Independent States, or CIS) did worse than expected, recording an increase of just 5.4 per cent. In fact, shipments from developing economies other than China grew at a slightly slower pace than exports from developed economies (including disaster-struck Japan). The relatively strong performance of developed economies was driven by a robust 7.2 per cent increase in exports from the United States, as well as a 5.0 per cent expansion in exports from the European Union. Meanwhile, Japan's 0.5 per cent drop in exports detracted from the average for developed economies overall.
Several adverse developments disproportionately affected developing economies, including the interruption of oil supplies from Libya that caused African exports to tumble 8 per cent in 2011, and the severe flooding that hit Thailand in the fourth quarter. The Japanese earthquake and tsunami also disrupted global supply chains, which penalized exports from developing countries such as China, as reduced shipments of components hindered production of goods for export (see quarterly volume developments for selected economies in Appendix Figure 1).
Significant exchange rate fluctuations occurred during 2011, which shifted the competitive positions of some major traders and prompted policy responses (e.g. in Switzerland and Brazil). Fluctuations were driven in
Figure 1.1: Growth in volume of world merchandise trade and GDP, 2000-11
(annual percentage change)
15 |
|
|
|
|
|
Average export growth |
|
|
|
||
|
|
|
|
|
|
|
|
|
|||
|
|
|
|
|
|
|
1991-2011 |
|
|
|
|
10 |
|
|
|
|
|
|
|
|
|
|
|
5 |
|
|
|
|
|
|
|
|
|
|
|
0 |
|
|
|
|
|
|
|
|
|
|
|
|
|
|
|
|
|
Average GDP growth |
|
|
|
||
-5 |
|
|
|
|
|
1991-2011 |
|
|
|
|
|
|
|
|
|
|
|
|
|
|
|
|
|
-10 |
|
|
|
|
|
|
|
|
|
|
|
-15 |
|
|
|
|
|
|
|
|
|
|
|
2000 |
2001 |
2002 |
2003 |
2004 |
2005 |
2006 |
2007 |
2008 |
2009 |
2010 |
2011 |
 Exports
  GDP
GDP
Source: WTO Secretariat.
18
large part by attitudes towards risk related to the euro sovereign debt crisis. The value of the US dollar fell 4.6 per cent in nominal terms against a broad basket of currencies according to data from the Federal Reserve, and 4.9 per cent in real terms according to data from the International Monetary Fund, making US goods generally less expensive for export. Nominal US dollar depreciation also would have inflated the dollar values of some international transactions.
The developments outlined above refer to trade in real (i.e. volume) terms, but nominal flows (i.e. in currency terms) for both merchandise and commercial services were similarly affected by recent economic shocks.
In 2011, the dollar value of world merchandise trade advanced 19 per cent to US$ 18.2 trillion, surpassing the previous peak of US$ 16.1 trillion in 2008. Much of the growth was due to higher commodity prices, but monthly trade flows were mostly flat or declining in many major traders over the course of the year (see monthly nominal developments in Appendix Figure 2).
The share of developing economies and the CIS in the world total also rose to 47 per cent on the export side and 42 per cent on the import side, the highest levels ever recorded in a data series extending back to 1948.
The value of world commercial services exports increased by 11 per cent in 2011 to US$ 4.2 trillion, with strong differences in annual growth rates for
I – World Trade in 2011
particular countries and regions. African exports were hit hard by the turmoil in Arab countries, recording zero growth as Egypt’s exports of travel services plunged more than 30 per cent. Quarterly data on services jointly prepared by the WTO and the United Nations Conference on Trade and Development (UNCTAD) also showed a sharp slowdown in the fourth quarter, coinciding with the heightened level of financial market turmoil surrounding the euro debt crisis.
The 5.0 per cent growth of world merchandise trade in 2011 was below the pre-crisis average of 6.0 per cent for 1990–2008, and was even below the average of the last 20 years, including the period of the trade collapse (5.4 per cent). As a result, trade volume of world trade was even further away from its pre-crisis trend at the end of 2011 than it was a year earlier. In fact, this gap should continue to increase as long as the rate of trade expansion falls short of earlier levels (see Figure 1.2).
Eliminating this divergence would require faster than average growth at some point in the future. Conceivably, this could happen after governments, businesses and households in developed countries reduce their debt burdens to more manageable levels, but this process of deleveraging (reducing reliance on debt) and fiscal consolidation (reducing budget deficits) is likely to take years. In the meantime, the world may have to resign itself to a long period of slower-than-average growth in international trade.
Figure 1.2: Volume of world merchandise exports, 1990-2011
(indices, 1990=100)
400 |
|
|
|
|
|
|
|
|
|
|
|
|
|
|
|
|
|
|
|
|
|
350 |
|
|
|
|
|
|
|
|
|
|
|
|
|
|
|
|
|
|
|
|
|
300 |
|
|
|
|
|
|
|
|
|
|
|
|
|
|
|
|
|
|
|
|
|
250 |
|
|
|
|
|
|
|
|
|
|
|
|
|
|
|
|
|
|
|
|
|
200 |
|
|
|
|
|
|
|
|
|
|
|
|
|
|
|
|
|
|
|
|
|
150 |
|
|
|
|
|
|
|
|
|
|
|
|
|
|
|
|
|
|
|
|
|
100 |
|
|
|
|
|
|
|
|
|
|
|
|
|
|
|
|
|
|
|
|
|
50 |
|
|
|
|
|
|
|
|
|
|
|
|
|
|
|
|
|
|
|
|
|
1990 |
1991 |
1992 |
1993 |
1994 |
1995 |
1996 |
1997 |
1998 |
1999 |
2000 |
2001 |
2002 |
2003 |
2004 |
2005 |
2006 |
2007 |
2008 |
2009 |
2010 |
2011 |
|
|
|
|
|
|
|
Export volume |
|
Trend (1990-2008) |
|
|
|
|
|
|
|
|||||
Source: WTO Secretariat.
Endnote
Introduction .A
1 Note that merchandise trade volume figures refer to growth in real terms, i.e. adjusted to account for changes in the
prices of exports and imports.
19

world trade report 2012
B.State of the world economy and trade in 2011
1.Economic growth
The rate of world output growth fell to 2.4 per cent in 2011 from 3.8 per cent in the previous year, weighed down by the on-going sovereign debt crisis in Europe, supply chain disruptions from natural disasters in Japan and Thailand, and turmoil in Arab countries. This pace of expansion was well below the 3.2 per cent average over the 20 years leading up to the financial crisis in 2008 (see Table 1.1).
Japan’s 0.5 per cent contraction in output, brought on by the catastrophic earthquake in March 2011, contributed to the lacklustre 1.5 per cent growth of developed economies in 2011. Growth of GDP (total production in the country) in the United States was slightly faster than the average of all developed economies at 1.7 per cent, while the EU’s rate was in line with the average at 1.5 per cent.
The fastest growing regions were the Middle East at 4.9 per cent, followed by the Commonwealth of Independent States at 4.6 per cent and South and Central America at 4.5 per cent. Africa, with GDP growth of 2.3 per cent, might have grown even faster if
not for the uprisings that occurred in Libya, Tunisia, Egypt and elsewhere.
Once again, China’s GDP growth outpaced the rest of the world at 9.2 per cent, but this rate was no better than what the country achieved at the peak of the global financial crisis in 2009. In contrast to this performance, the newly industrialized economies of Hong Kong, China, of the Republic of Korea, of Singapore and of Chinese Taipei together grew at less than half the rate of China (4.2 per cent). Developing economies and the CIS together recorded a 5.7 per cent increase in 2011.
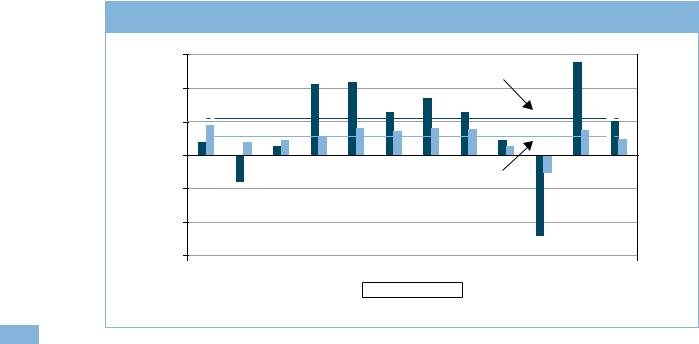
Aggregate quarterly figures for world GDP growth are not readily available, but such growth likely slowed towards the end of 2011 in the face of headwinds from the European sovereign debt crisis. Output of the euro area contracted at a 1.3 per cent annual rate in the fourth quarter, marking the first quarter of negative growth since the currency bloc emerged from recession in 2009 (see Figure 1.3). At the same time, China’s economy slowed and Japan remained mired in recession. Growth picked up in the United States in the fourth quarter as unemployment eased, but this was likely outweighed by developments elsewhere.
Table 1.1: GDP and merchandise trade by region, 2009-11 |
|
|
|
|
|
|
|
|||||
(annual percentage change) |
|
|
|
|
|
|
|
|
|
|
|
|
|
|
GDP |
|
|
|
|
Exports |
|
|
|
Imports |
|
|
|
|
|
|
|
|
|
|
|
|
|
|
|
2009 |
2010 |
2011 |
|
|
2009 |
2010 |
2011 |
2009 |
2010 |
2011 |
|
|
|
|
|
|
|
|
|
|
|
|
|
|
World |
-2.6 |
3.8 |
2.4 |
|
|
-12.0 |
13.8 |
5.0 |
-12.9 |
13.7 |
4.9 |
|
|
|
|
|
|
|
|
|
|
|
|
|
|
North America |
-3.6 |
3.2 |
1.9 |
|
|
-14.8 |
14.9 |
6.2 |
-16.6 |
15.7 |
4.7 |
|
|
|
|
|
|
|
|
|
|
|
|
|
|
United States |
-3.5 |
3.0 |
1.7 |
|
|
-14.0 |
15.4 |
7.2 |
-16.4 |
14.8 |
3.7 |
|
|
|
|
|
|
|
|
|
|
|
|
|
|
South and Central Americaa |
-0.3 |
6.1 |
4.5 |
|
|
-8.1 |
5.6 |
5.3 |
|
-16.5 |
22.9 |
10.4 |
Europe |
-4.1 |
2.2 |
1.7 |
|
|
-14.1 |
10.9 |
5.0 |
-14.1 |
9.7 |
2.4 |
|
|
|
|
|
|
|
|
|
|
|
|
|
|
European Union (27) |
-4.3 |
2.1 |
1.5 |
|
|
-14.5 |
11.5 |
5.2 |
-14.1 |
9.5 |
2.0 |
|
|
|
|
|
|
|
|
|
|
|
|
|
|
Commonwealth of Independent |
-6.9 |
4.7 |
4.6 |
|
|
-4.8 |
6.0 |
1.8 |
-28.0 |
18.6 |
16.7 |
|
States (CIS) |
|
|
||||||||||
|
|
|
|
|
|
|
|
|
|
|
|
|
|
|
|
|
|
|
|
|
|
|
|
|
|
Africa |
2.2 |
4.6 |
2.3 |
|
|
-3.7 |
3.0 |
-8.3 |
-5.1 |
7.3 |
5.0 |
|
|
|
|
|
|
|
|
|
|
|
|
|
|
Middle East |
1.0 |
4.5 |
4.9 |
|
|
-4.6 |
6.5 |
5.4 |
-7.7 |
7.5 |
5.3 |
|
|
|
|
|
|
|
|
|
|
|
|
|
|
Asia |
-0.1 |
6.4 |
3.5 |
|
|
-11.4 |
22.7 |
6.6 |
-7.7 |
18.2 |
6.4 |
|
|
|
|
|
|
|
|
|
|
|
|
|
|
China |
9.2 |
10.4 |
9.2 |
|
|
-10.5 |
28.4 |
9.3 |
2.9 |
22.1 |
9.7 |
|
|
|
|
|
|
|
|
|
|
|
|
|
|
Japan |
-6.3 |
4.0 |
-0.5 |
|
|
-24.9 |
27.5 |
-0.5 |
-12.2 |
10.1 |
1.9 |
|
|
|
|
|
|
|
|
|
|
|
|
|
|
India |
6.8 |
10.1 |
7.8 |
|
|
-6.0 |
22.0 |
16.1 |
3.6 |
22.7 |
6.6 |
|
|
|
|
|
|
|
|
|
|
|
|
|
|
Newly industrialized economies (4)b |
-0.6 |
8.0 |
4.2 |
|
|
-5.7 |
20.9 |
6.0 |
|
-11.4 |
17.9 |
2.0 |
Memo: Developed economies |
-4.1 |
2.9 |
1.5 |
|
|
-15.1 |
13.0 |
4.7 |
-14.4 |
10.9 |
2.8 |
|
|
|
|
|
|
|
|
|
|
|
|
|
|
Memo: Developing and CIS |
2.2 |
7.2 |
5.7 |
|
|
-7.4 |
14.9 |
5.4 |
-10.5 |
18.1 |
7.9 |
|
|
|
|
|
|
|
|
|
|
|
|
|
|
a Includes the Caribbean.
b Hong Kong, China; Republic of Korea; Singapore; and Chinese Taipei.
Source: WTO Secretariat.
20

I – World Trade in 2011
Figure 1.3: Real GDP growth and trade of euro area economies, 2008-11
(annualized percentage change over previous quarter)
6.0 |
|
|
|
|
|
|
|
|
|
|
|
|
|
|
60 |
4.0 |
|
|
|
|
|
|
|
|
|
|
|
|
|
|
40 |
2.0 |
|
|
|
|
|
|
|
|
|
|
|
|
|
|
20 |
0.0 |
|
|
|
|
|
|
|
|
|
|
|
|
|
|
0 |
-2.0 |
|
|
|
|
|
|
|
|
|
|
|
|
|
|
-20 |
-4.0 |
|
|
|
|
|
|
|
|
|
|
|
|
|
|
-40 |
-6.0 |
|
|
|
|
|
|
|
|
|
|
|
|
|
|
-60 |
-8.0 |
|
|
|
|
|
|
|
|
|
|
|
|
|
|
-80 |
-10.0 |
|
|
|
|
|
|
|
|
|
|
|
|
|
|
-100 |
-12.0 |
|
|
|
|
|
|
|
|
|
|
|
|
|
|
-120 |
2008Q1 |
2008Q2 |
2008Q3 |
2008Q4 |
2009Q1 |
2009Q2 |
2009Q3 |
2009Q4 |
2010Q1 |
2010Q2 |
2010Q3 |
2010Q4 |
2011Q1 |
2011Q2 |
2011Q3 |
2011Q4 |
|
|
|
GDP |
Imports of goods and services |
Exports of goods and services |
|
|
||||||||
Source: OECD Quarterly National Accounts.
2.Merchandise trade in volume (i.e. real) terms
World merchandise trade volume grew 5.0 per cent in 2011, and Asia’s 6.6 per cent increase led all regions (see Table 1.1). One of the more significant developments in 2011 was the 8.3 per cent contraction in the volume of Africa’s exports. This was largely due to the civil war in Libya, which reduced the country’s oil shipments by an estimated 75 per cent. Japan’s exports also fell by the same 0.5 per cent as the country’s GDP, while shipments from the CIS advanced just 1.8 per cent.
Although Africa recorded a respectable 5.0 per cent increase in imports, other resource-exporting regions
performed better. Imports of the CIS grew faster than those of any other region at 16.7 per cent, followed by South and Central America’s at 10.4 per cent. Meanwhile, Japan’s import growth was the slowest of any major economy or region in 2011 at 1.9 per cent.
India had the fastest export growth among major traders in 2011, with shipments rising 16.1 per cent. Meanwhile, China had the second-fastest export growth of any major economy at 9.3 per cent.
The combination of low export volume growth and high import volume growth seen in the Commonwealth of Independent States in 2011 can be attributed to the 32 per cent rise in energy prices for the year, which boosted export earnings and allowed more foreign goods to be imported (see Table 1.2).
Table 1.2: World prices of selected primary products, 2000-11 |
|
|
|
||
(annual percentage change and US$ per barrel) |
|
|
|
|
|
|
2009 |
2010 |
2011 |
2000-11 |
2005-11 |
|
|
|
|
|
|
All commodities |
-30 |
26 |
26 |
12 |
14 |
|
|
|
|
|
|
Metals |
-19 |
48 |
14 |
15 |
18 |
|
|
|
|
|
|
Beveragesa |
-15 |
11 |
20 |
8 |
11 |
Food |
2 |
14 |
17 |
10 |
13 |
|
|
|
|
|
|
Agricultural raw materials |
-17 |
33 |
23 |
5 |
9 |
|
|
|
|
|
|
Energy |
-37 |
26 |
32 |
15 |
15 |
|
|
|
|
|
|
Memo: Crude oil price in US$/barrelb |
62 |
79 |
104 |
56 |
76 |
a Comprising coffee, cocoa beans and tea.
b Average of Brent, Dubai, and West Texas Intermediate.
Source: IMF International Financial Statistics.
State .ofB theworldeconomy and trade 2011in
21

world trade report 2012
Appendix Figure 1 shows seasonally adjusted quarterly merchandise trade volumes for selected economies, revealing some of the dynamics of changes that occurred in 2011. The decline in extraEU imports (i.e. imports from outside the European Union) measured -3.8 per cent in the fourth quarter, equivalent to 14.4 per cent at an annualized rate. Such a rate of decline is unlikely to go on for very long, but it helps to explain the weakness of exports of other economies at the time. Imports of the United States were flat rather than falling during 2011, but both the United States and the European Union saw their exports rise over the course of the year.
The other major development was the slump in Chinese imports that occurred around the time of the Japanese earthquake in the second quarter of 2011. Between the first and second quarters, China’s imports dropped 6.1 per cent, equivalent to 27 per cent annually, but in subsequent quarters trade rose 4.2 per cent (18 per cent annualized) and 7.3 per cent (32 per cent annualized). This is consistent with a strong but relatively short-lived direct impact from the disaster, although other indirect influences might be just as important. It also demonstrated the strong insertion of China in Asian value chains.
Although not shown in the charts, the volume of Thailand’s exports plunged 8.5 per cent in the fourth quarter due to flooding that significantly affected exports of intermediate goods, further disturbing global production networks.
3.Merchandise and commercial services trade in value (i.e. dollar) terms
The total dollar value of world merchandise exports jumped 19 per cent to US$ 18.2 trillion in 2011 (see Table 1.3).1 This increase was nearly as large as the 22 per cent rise in 2010 and was driven in large part by higher primary commodity prices.
Commercial services exports also grew 11 per cent in 2011 to US$ 4.1 trillion. The share of commercial services in total goods plus commercial services trade (on a balance of payments basis) was 18.6 per cent, the smallest such share since 1990.
Transport services recorded the slowest growth of any sub-category of services (8 per cent), followed by other commercial services (11 per cent) and travel (12 per cent).
The slow growth of transport services is perhaps not surprising considering the close relationship between this category of services and trade in goods, which stagnated in the second half of 2011. An oversupply of new container ships may have also depressed revenues in the shipping sector.
Appendix tables 1 to 6 provide detailed information on nominal merchandise and commercial services trade flows by region and for selected economies. They also include tables of leading exporters and importers with and without intra-EU trade (i.e. trade between EU members). Some noteworthy developments for merchandise trade and commercial services are summarized below.
(a) Merchandise trade
The dollar value of North America’s merchandise exports rose 16 per cent in 2011 to US$ 2.28 trillion (equal to 12.8 per cent of the world total), while imports grew 15 per cent to US$ 3.09 trillion (17.2 per cent) (see Appendix Table 1).
South and Central America’s exports advanced 27 per cent to US$ 749 billion (4.2 per cent of the world total), buoyed by stronger primary commodity prices. At the same time, the region’s imports increased by 24 per cent to US$ 727 billion (4.0 per cent).
Europe’s nominal exports grew 17 per cent to US$ 6.60 trillion, or 37.1 per cent of the world total. The region’s imports were also up 17 per cent to US$ 6.85 trillion (38.1 per cent).
Table 1.3: World exports of merchandise and commercial services, 2005-11
(US$ billion and annual percentage change)
|
Value |
|
|
|
2011 |
|
|
Merchandise |
18,217 |
|
|
|
|
Commercial services |
4,149 |
|
|
Transport |
855 |
|
|
Travel |
1,063 |
|
|
Other commercial services |
2,228 |
Annual percentage change
2009 |
2010 |
2011 |
2005-11 |
|
|
|
|
-22 |
22 |
19 |
10 |
|
|
|
|
|
|
|
|
-11 |
10 |
11 |
9 |
|
|
|
|
-23 |
15 |
8 |
7 |
|
|
|
|
-9 |
9 |
12 |
7 |
|
|
|
|
-7 |
8 |
11 |
10 |
Source: WTO Secretariat for merchandise and WTO and UNCTAD Secretariats for commercial services.
22

Exports of the Commonwealth of Independent States jumped 34 per cent to US$ 788 billion, supported by rising energy prices. Imports also increased by 30 per cent to US$ 540 billion. Shares of CIS exports and imports in world trade were 4.4 per cent and 3.0 per cent, respectively.
Africa’s exports were up 17 per cent to US$ 597 billion (3.4 per cent of the world total) while imports rose 18 per cent to US$ 555 billion (3.1 per cent).
Exports from the Middle East surged 37 per cent in dollar terms to US$ 1.23 trillion (or 6.9 per cent of the world total) as a result of rising oil prices. In contrast to this, imports only increased by 16 per cent to US$ 6.65 billion (3.7 per cent).
Finally, Asia’s exports were up 18 per cent in 2011 to US$ 5.53 trillion (31.1 per cent of the world total) while imports advanced 23 per cent to US$ 5.57 trillion (30.9 per cent).
The top five merchandise exporters in 2011 were China (US$ 1.90 trillion, or 10.4 per cent of world exports), the United States (US$ 1.48 trillion, 8.1 per cent), Germany (US$ 1.47 trillion, 8.1 per cent), Japan (US$ 823 billion,
4.5per cent) and the Netherlands (US$ 660 billion,
3.6per cent). The leading importers were the United States (US$ 2.27 trillion, 12.3 per cent of world imports),
China (US$ 1.74 trillion, 9.5 per cent), Germany (US$ 1.25 trillion, 6.8 per cent), Japan (US$ 854 billion, 4.6 per cent) and France (US$ 715 billion, 4 per cent) (see Appendix Table 3).
If we ignore trade between European Union member countries and treat the EU as a single entity, the top exporters were the European Union (US$ 2.13 trillion, or 14.9 per cent of the world total), China (13.3 per cent), the United States (10.3 per cent), Japan (5.7 per cent) and the Republic of Korea (US$ 555 billion, or 3.9 per cent). The leading importers, excluding trade between EU countries, were the European Union (US$ 2.34 trillion or 16.2 per cent of world imports), the United States (15.6 per cent), China (12.0 per cent), Japan (5.9 per cent) and the Republic of Korea (US$ 425 billion, or 3.6 per cent) (see Appendix Table 4).
There were few significant moves up or down in the world rankings in 2011. The Russian Federation went from being the 12th largest exporter of merchandise in 2010 to being the ninth in 2011 (including EU members).
(b) Commercial services trade
The region with the fastest growth in commercial services exports in 2011 was the CIS, with 20 per cent growth in the dollar value of its exports. Africa had the slowest export growth of any region at zero per cent. All other regions recorded double-digit growth between 10 and 14 per cent. The slow growth of African exports was largely due to the turmoil in North African countries.
I – World Trade in 2011
Egypt and Tunisia were especially hard hit as their commercial services exports fell 20 per cent and 19 per cent, respectively. However, Sub-Saharan Africa's exports increased in line with the world average of 11 per cent (see Appendix Table 2).
Meanwhile, African services imports rose 9 per cent, slightly less than the world average of 10 per cent. In contrast to exports, there was not as much of a divergence between Northern Africa and Sub-Saharan Africa on the import side, as the former grew 7.0 per cent and the latter 9.5 per cent. The region with the fastest growth in services imports was the CIS at 21 per cent, followed closely by South and Central America at 18 per cent. Other regions recorded growth rates for commercial services imports between 8 and 14 per cent.
The top five exporters of commercial services in 2011 were the United States (US$ 578 billion, or 14 per cent of the world total), the United Kingdom (US$ 274 billion, 7 per cent), Germany (US$ 253 billion, 6 per cent), China (US$ 182 billion, 4 per cent) and France (US$ 161 billion, 4 per cent). The United Kingdom replaced Germany as the world’s second-largest exporter of services compared with last year's tables, but this was mainly due to a large upward revision in official statistics on UK exports of other business services and financial services, which together make up roughly half of all UK commercial services exports (see Appendix Table 5).
The top five importers of commercial services were the United States (US$ 391 billion, or 10 per cent of the world total), Germany (US$ 284 billion, 7 per cent), China (US$ 236 billion, 6.1 per cent), the United Kingdom (US$ 171 billion, 4 per cent) and Japan (US$ 165 billion, 4.3 per cent). There were no changes in the ranking of the top importers.
The above figures include intra-EU commercial services trade, i.e. services trade between European Union member countries. If this trade is excluded from the world total and the European Union is treated as a single entity, the EU becomes the top exporter of commercial services (US$ 789 billion, 24.8 per cent of the world total), followed by the United States (US$ 578 billion, 18.2 per cent ), China (US$ 182 billion, 5.7 per cent), India (US$ 148 billion, 4.7 per cent) and Japan (US$ 143 billion, 4.5 per cent). The European Union also becomes the leading importer (US$ 639 billion, 21.1 per cent of the world total), followed by the United States (US$ 391 billion, 12.9 per cent), China (US$ 236 billion, 7.8 per cent), Japan (US$ 165 billion, 5.4 per cent) and India (US$ 130 billion, 4.3 per cent) (see Appendix Table 6).
4. Sectoral developments
Prices for traded manufactured goods have tended to be more stable than those of primary products, both
State .ofB theworldeconomy and trade 2011in
23

world trade report 2012
before and after the economic crisis. As a result, movements in nominal trade flows reflect changes in quantities reasonably well. With this in mind, Figure 1.4 shows year-on-year growth in the quarterly value of world trade in several classes of manufactured goods.
All types of manufactured goods saw year-on-year growth fall towards zero over the course of 2011. For example, world trade in automotive products slid from 44 per cent in the first quarter of 2010 to 10 per cent in the fourth quarter of 2011. Office and telecom equipment went from positive to negative, as year-on- year growth rates fell from around plus 14 per cent in the first quarter to minus 2 per cent in the fourth quarter.
5. Exchange rates
The Japanese yen and the Swiss franc both recorded significant nominal appreciations against the US dollar in 2011. The yen was up 10 per cent year-on-year, partly due to the safe haven role of the currency during times of uncertainty. Meanwhile, the franc jumped 17 per cent, prompting interventions by the Swiss National Bank in currency markets to force down the value of the currency, especially against the euro. The Brazilian real was also up 5.4 per cent against the dollar, and the Chinese yuan and Korean won rose 4.7 per cent and 4.3 per cent, respectively. Despite the sovereign debt crisis in Europe, the euro appreciated 5 per cent against the dollar (see Figure 1.5).
Figure 1.4: Quarterly world exports of manufactured goods by product, 2008Q1-2011Q4
(year-on-year percentage change)
60 |
|
|
|
|
|
|
|
|
|
|
|
|
|
|
|
40 |
|
|
|
|
|
|
|
|
|
|
|
|
|
|
|
20 |
|
|
|
|
|
|
|
|
|
|
|
|
|
|
|
0 |
|
|
|
|
|
|
|
|
|
|
|
|
|
|
|
-20 |
|
|
|
|
|
|
|
|
|
|
|
|
|
|
|
-40 |
|
|
|
|
|
|
|
|
|
|
|
|
|
|
|
-60 |
|
|
|
|
|
|
|
|
|
|
|
|
|
|
|
2008Q1 |
2008Q2 |
2008Q3 |
2008Q4 |
2009Q1 |
2009Q2 |
2009Q3 |
2009Q4 |
2010Q1 |
2010Q2 |
2010Q3 |
2010Q4 |
2011Q1 |
2011Q2 |
2011Q3 |
2011Q4 |
|
|
|
|
Iron and steel |
|
|
Chemicals |
|
Automotive products |
|||
|
|
|
|
|
|
|||||||
|
|
Office and telecom equipment |
|
|
Industrial machinery |
|
Textiles and clothing |
|||||
|
|
|
|
|
||||||||
|
|
|
|
|
|
|
|
|
|
|
|
|
Source: WTO Secretariat estimates based on mirror data for available reporters in the Global Trade Atlas database of Global Trade Information Systems.
Figure 1.5: Nominal dollar exchange rates, January 2005 – February 2012
(indices of US dollars per unit of national currency, 2000=100)
175 |
|
|
|
|
|
|
|
|
|
|
|
|
175 |
|
|
|
|
|
|
|
|
|
|
|
|
150 |
|
|
|
|
|
|
|
|
|
|
|
|
150 |
|
|
|
|
|
|
|
|
|
|
|
|
125 |
|
|
|
|
|
|
|
|
|
|
|
|
125 |
|
|
|
|
|
|
|
|
|
|
|
|
100 |
|
|
|
|
|
|
|
|
|
|
|
|
100 |
|
|
|
|
|
|
|
|
|
|
|
|
75 |
|
|
|
|
|
|
|
|
|
|
|
|
75 |
|
|
|
|
|
|
|
|
|
|
|
|
50 |
|
|
|
|
|
|
|
|
|
|
|
|
50 |
|
|
|
|
|
|
|
|
|
|
|
|
Jan. 05 |
Aug. 05 |
Mar. 06 |
Oct. 06 |
May 07 |
Dec. 07 |
Jul. 08 |
Feb. 09 |
Sept. 09 |
Apr. 10 |
Nov. 10 |
June 11 |
Jan. 12 |
Jan. 05 |
Aug. 05 |
Mar. 06 |
Oct. 06 |
May 07 |
Dec. 07 |
Jul. 08 |
Feb. 09 |
Sept. 09 |
Apr. 10 |
Nov. 10 |
June 11 |
Jan. 12 |
|
|
|
|
Euro |
|
|
|
Japan yen |
|
|
|
|
|
China yuan |
|
|
|
Korea won |
|
|
|
|
|
|
|
|
|
|
|||||||||
|
|
UK pound |
|
|
Switzerland franc |
|
|
|
|
|
Brazil real |
|
|
|
India rupee |
|||
|
|
|
|
|
|
|
|
|||||||||||
|
|
|
|
|
|
|
|
|
|
|
|
|
|
|
|
|
|
|
Source: Federal Reserve Bank of St. Louis.
24

Nominal exchange rates such as these may overor under-state the competitive effects of exchange rate movements. As a result, “real effective” rates that average the exchange value of a currency against many trading partners while adjusting for differences in inflation rates may provide a better indication of the competitiveness of a country’s exports.
Real effective exchange rates supplied by the International Monetary Fund show that the US dollar’s depreciation in 2011 was even stronger in real effective terms (-4.9 per cent) than in nominal terms. On the other hand, the average appreciation of other major currencies was over-stated. The Japanese yen only appreciated 1.7 per cent in real terms while the Chinese yuan rose 2.7 per cent. Brazil’s currency registered a strong increase of 4.7 per cent in real effective terms, while the euro’s rise of 1.8 per cent was relatively small.
I – World Trade in 2011
Endnote
1World exports of goods measured on a balance of payments basis were up 20 per cent in 2011.
State .ofB theworldeconomy and trade 2011in
25