

Patients and methods
The study comprised 40 burn patients admitted to the Burn Unit of Tanta University Hospital (Egypt) with burns exceeding 15% total body surface area (TBSA); an acute fluid resuscitation regimen was started.
Exclusion criteria
Burns in less than 15% TBSA
Patients with electrical or chemical burns
Patients with inhalation injuries
Patients with serum creatinine above 2 mg/dl
Fluid regimens
Group 1 (LR group) - patients in group 1 received LR solution, according to the Parkland formula5 (4 ml/kg/% BSA burned), aiming at a urinary output of 0.5-1 ml/kg/h.
Group II (Haes group) - patients in group II received Haes-Steril 10%, with a maximum daily dose of 20 ml/kg body weight, until a urinary output of 0.5-1 ml/kg/h was achieved.
Adequacy of resuscitation
All patients included in the study were subjected to the following procedures in order to guide fluid resuscitation:
Clinical assessment to ensure patency of airways. The TBSA burned was calculated using the rule of nine.6 A central venous catheter and an indwelling urinary catheter were applied.
Estimation of central venous pressure (CVP).
Using the estimated CVP, cardiac output (COP) was determined using COP curves.
The cardiac index (CI) was calculated by the following formulae: TBSA (m2) = weight0.425 x height0.725 x 0.00718 CI (l/min/m2) = COP/TBSA
VO2 was determined using curves illustrating the relationship between CI and VO2.
Estimation of endothelin-1 (ET-1)8 and serum lactate9 levels.
Estimation of serum urea,10 and creatinine and creatinine clearance rate.11
The studied variables were evaluated on admission of the patients, and were considered the pre-infusion values. Thereafter these variables were re-evaluated 6, 12, and 24 h after initiation of fluid therapy.
Statistical analysis
Data were presented as means + SD. The statistical analysis of demographic data (age, sex distribution, TBSA, percentage burned TBSA) was performed using one-factor analysis of variance. Both groups were compared for changes occurring in the studied variables using the two-tailed t-test. Pearson’s correlation coefficient (r) was used to correlate some of the studied variables. The level of significance was set at a p value <0.05.12 Computations were performed using the statistical software package SPSS 7 for Windows (SPSS Inc., Chicago, Illinois, USA).
Results
The study comprised 40 patients with burns in more than 15% TBSA. These were allocated to two study groups: the first group received LR solution according to the Parkland formula, while the second group received Haes-Steril 10% as acute resuscitation therapy aimed at producing a urine output of 0.5-1 ml/kg/h.
An analysis of the demographic data revealed a non-significant (p > 0.05) difference between the two groups with regard to age, sex distribution, TBSA, and percentage of burned BSA (Table I).
|
Data LR group Haes group p Age (yr) 38.4 ± 12.8 (19-62) 37.8 ± 13.1 (18-59) > 0.05 TBSA (%) 1.87 ± 0.155 1.83 ± 0.152 > 0.05 % burned BSA 29 ± 8.4 (16-45) 29.5 ± 8.2 (17-47) > 0.05 Sex (m:f) 9.11 6.14 > 0.05 Values are mean ± SD, with ranges in parentheses p > 0. 05 = statistically nonsignificant difference
Table I- Demographic data patients in the groups studied
|
During the study period, heart rate (HR) decreased by 18.5% in the LR-group and by 19.8% in patients in the Haes group; however, HR showed a non-significant difference (p > 0.05) between the two groups. The mean arterial blood pressure (mABP) increased by 6.7% in patients in the LR-group and by 9.9% in patients in the Haes group. The percentage increase in mABP in patients in the LR group showed a non-significant difference (p > 0.05) compared with that in Haes-group patients. CVP increased in LR-group patients by 25% and in the Haes group by 42.3%; there was a significant increase (p <0.05) in CVP values in the Haes group compared with values in the LR group (Fig. 1). A comparison of CVP measurements in the two groups showed a significant increase (p <0.05) in values in the Haes group compared with those in the LR group 6 and 24 h after initiation of fluid therapy. COP showed an 11% increase during the study period in LR patients, while in Haes-group patients COP increased by 23%. A comparison of the changes in COP in the two groups showed a significant increase (p < 0.05) in Haes-group patients (Fig. 2). However, COP showed a significant increase (p < 0.05) in the Haes-group only 12 h after initiation of fluid therapy. With regard to CI, this increased by 13% in LR-group patients and by 23% in Haes-group patients (Fig. 3). An analysis of the differences in CI showed a significant increase (p < 0.05) in CI in Haes-group patients compared with that in LR-group patients 6 and 24 h post-infusion. Oxygen consumption (VO2) increased by 35.9% in LR patients and by 41.1% in Haes-group patients 24 h after initiation of fluid therapy (Fig. 4). During the study period there was a significant increase (p < 0.05) in VO2 in Haes-group patients compared with VO2 in the LR group (Table II).
|
Fig. 1 - Changes in central venous pressure (mm/Hg) in groups studied (pre- and post-infusion).
|

|
Fig. 2 - Changes in cardiac output (1/min) in groups studied (pre- and post-infusion).
|

|
Fig. 3 - Changes in cardiac index (1/min/m2) in groups studied (pre- and post-infusion).
|

|
Fig. 4 - Changes in oxygen consumption in groups studied (pre- and post-infusion).
|

|
Parameter Pre-infusion 6 h post-infusion 12 h post-infusion 24 h post-infusion Percentage change HR (beat/min) LR group 121.5 ± 7.1 111.8 ± 7.1 106.3 ± 8.4 103.5 ± 11.3 18.05 Haes group 123.3 ± 6.3 114.5 ± 6 104.8 ± 7.3 95.0 ± 5.8 19.08 mABP (mmHg) LR group 81.1 ± 7.2 85.7 ± 3.5 85.8 ± 3.8 85.8 ± 4.5 6.07 Haes group 78.9 ± 5.3 80.5 ± 4.1 84.3 ± 3.9 86.4 ± 4 9.09 CVP (mmhg) LR group 5.6 ± 0.9 6.97 ± 1.11 5.9 ± 0.9 8.1 ± 1.29 25.00.00 Haes group 5.7 ± 0.8 8.23 ± 1.16S 6.5 ± 0.92 9.5 ± 1.33S 42.3S COP (l/min) LR group 5.8 ± 0.47 5.86 ± 0.5 6.28 ± 0.86 7.39 ± 0.82 13.00 Haes group 5.6 ± 0.5 5.73 ± 0.5 6.83 ± 0.98 8.1 ± 0.97S 23.00 CI (l/min/m2) LR group 3.09 ± 0.05 3.37 ± 0.4 3.14 ± 0.06 3.96 ± 0.3 13.00 Haes group 3.06 ± 0.13 3.72 ± 0.42S 3.13 ± 0.06 4.2 ± 0.41S 23.0S VO2 (l/min) LR group 0.73 ± 0.03 0.78 ± 0.03 0.82 ± 0.05 1.0 ± 0.4 35.09.00 Haes group 0.74 ± 0.03 0.82 ± 0.05S 0.88 ± 0.06S 1.04 ± 0.09S 41.01.00 S = statistically significant difference
Table II- Changes in heart rate (HR), mean arterial blood pressure (mABC), central venous pressure (CVP), cardiac output (COP), and cardiac index (CI) in patients according to group
|
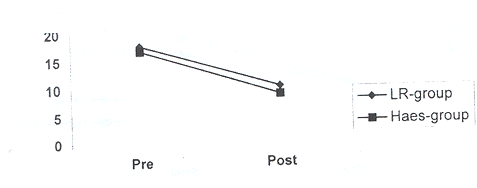
The plasma ET-1 level decreased by 39.6% in LR patients and by 44.5% in Haes-group patients, with a non-significant decrease (p > 0.05) in the plasma ET-1 level in the Haes group compared with its level in the LR group (Fig. 5). The plasma ET-1 level showed a non-significant difference (p > 0.05) between the two groups during the study period, except at 12 h after initiation of infusion therapy, when the difference was significant (p <0.05). The plasma ET-1 level showed a negative significant correlation with CI in both groups (r="-0.65" and 0.652, p="0.002," respectively). Estimation of the serum lactate level showed a 34.2% decrease in patients receiving LR solution and a 32.3% decrease in patients receiving Haes-Steril. Comparing treatment with serum lactate prior to initiation of infusion therapy, however, there was a non-significant difference (p> 0.05) in serum lactate levels, throughout the study period, between the groups (Fig. 6). There was a negative significant correlation between serum lactate and both CI and VO2 in both the LR group (r = -0.52 and -0.683, p = 0.019 and 0.001, respectively) and in the Haes group (r = -0.505 and -0.612, p = 0.023 and 0.004, respectively). Serum urea decreased by 19.4% in LR patients and by 23.1% in Haes patients; however, there was a non-significant difference (p > 0.05) between the two groups as regards serum urea. Serum creatinine showed a significant decrease (p <0.05) during the study period in Haes-group patients compared with levels in the LR group (Table III). The creatinine clearance rate significantly increased (p < 0.05) in Haes-group patients (mean, 122.16 ± 36.06; range, 62.3-186.5 ml/min) compared with that in the LR group (mean, 101 ± 27.4; range, 49.3-129 ml/min) (Table IV). A positive significant correlation was found between CI and the creatinine clearance rate in the two groups (r="0.518" and 0.571, p="0.019" and 0.011).
|
Fig. 5 - Changes in plasma endothelin-1 (ng/ml) levels in groups studied (pre- and post-infusion).
|
|
Parameter Pre-infusion 6 h post-infusion 12 h post-infusion 24 h post-infusion Percentage change Plasma ET-1 (ng/dl) LR group 17.6 ± 3.8 12.95 ± 1.88 9.95 ± 2.04 10.1 ± 1.74 -39.6 Haes group 16.6 ± 3.9 12.6 ± 3.5 10.65 ± 2.5 8.7 ± 1.45S -44.5 S. lactate (mg/dl) LR group 16.3 ± 4.4 14 ± 3 11.7 ± 1.98 9.8 ± 2.4 -34.2 Haes group 16.4 ± 3.95 14.4 ± 2.8 12.1 ± 2.34 10.6 ± 2.44 -32.3 S. urea (mg/dl) LR group 34 ± 4.2 31 ± 4.5 26 ± 3.7 24.4 ± 2.8 -19.4 Haes group 38 ± 5.3 34.5 ± 5 26.5 ± 3.7 26 ± 3.5 -23.1 S. creatinine (mg/dl) LR group 1.2 ± 0.21 1.1 ± 0.2 1 ± 0.2 0.9 ± 0.11 -15.9 Haes group 1.1 ± 0.12S 1 ± 0.13S 0.9 ± 0.1S 0.8 ± 0.11S -15.5 S = statistically significant difference
Table III- Changes in plasma endothelin-1, serum lactate, serum urea, and serum creatinine occurring in patients in patients according to group
|
|
Fig. 6 - Changes in serum lactate (mg/dl) in groups studied (pre- and post-infusion).
|

Urine output in Haes-group patients showed a significant increase (p <0.05) as total output both per 24 h (mean, 1865 ± 281 ml/24 h; range, 1400-2300 ml/24 h) and per min (mean, 1.04 ± 0.16 ml/kg/h; range, 0.7-1.31 ml/kg/h) compared with that of LR patients per 24 h (mean, 1650 ± 303 ml/24 h; range, 1070-2200 ml/24 h) and as output in ml/kg/h (mean, 0.91 ± 0.22 ml/kg/h; range, 0.6-1.32 ml/kg/h) (Fig. 7). During the first six hours after initiation of fluid therapy, urine output significantly increased (p <0.05) in the Haes group compared with that in the LR group. However, during the remaining study period, the difference in outputs by patients in the two groups was non-significant (p> 0.05) (Table IV).
|
Fig. 7 - Urine output (ml/kg/h) of patients in groups studied.
|

|
Parameter / Group LR group Haes group ml/period ml/kg/h ml/period ml/kg/h Urine Output 6 h Post infusion 413.8 ± 69.4 (300-500) 0.91 ± 0.22 (0.54-1.4) 497.8 ± 88S (350-700) 1.11 ± 0.19S (0.84-1.5) 12 h Post infusion 521 ± 109 (300-500) 1.15 ± 0.28 (0.67-1.7) 587 ± 116 (400-750) 1.31 ± 0.27 (0.84-1.8) 24 h Post infusion 712.4 ± 133 (500-950) 0.79 ± 0.2 (0.48-1.2) 780 ± 121.2 (600-1050) 0.87 ± 0.15 (0.6-1.16) Total amount/24 h 1650 ± 303 (1070-2200) 0.91 ± 0.22 (0.6-1.32) 1865 ± 281S (1400-2300) 1.04 ± 0.16S (0.7-1.31) Creatinine clearance rate (ml/min) 101 ± 27.4 (49.3-129) 122.16 ± 36.06S (62.3-186.5) S = statistically significant difference
Table IV- Changes in urine output and creatinine clearance rate in patients according to group
|