

88418872
.pdf2013 |
|
|
Li, Maggitti, Smith, Tesluk, and Katila |
|
|
|
|
|
903 |
|||||
higher value indicates greater diversity in the in- |
tion,” “persist until I found all the information |
|||||||||||||
formation sources different TMT members use. We |
pertaining to this problem,” “take as much time as |
|||||||||||||
validated this variable by finding it significantly |
needed to identify all available information,” and |
|||||||||||||
correlated (r .21, p .05) with a measure of TMT |
“exhaustively search and study every possibility.” |
|||||||||||||
functional diversity, measured as the range of func- |
|
We conducted a confirmatory factor analysis |
||||||||||||
tional areas in which TMT members have experi- |
(CFA) with the two search intensity constructs |
|||||||||||||
ence and information, such as marketing, finance, |
(search effort and search persistence). The CFA re- |
|||||||||||||
R&D. We found this measure to be correlated to our |
sults (CFI .90, RMSEA .06, SRMR .08) indi- |
|||||||||||||
measure of terrain source diversity. |
|
|
|
cate that the measurement model fit the data |
||||||||||
Search effort. The two search intensity variables |
reasonably well, therefore confirming the unidi- |
|||||||||||||
(i.e., effort and persistence) were measured on a |
mensionality of each search process construct in |
|||||||||||||
scale ranging from 1, “strongly disagree,” to 5, |
the model (Gerbing & Anderson, 1988; Hu & |
|||||||||||||
“strongly agree.” Search effort, the extent to which |
Bentler, 1999). All the standardized factor loadings |
|||||||||||||
the members of a TMT devote time and energy to |
in the model were above the commonly accepted |
|||||||||||||
search rather than to other activities, was assessed |
value of .40 and significantly loaded on their re- |
|||||||||||||
with four items ( .81), including “I would invest |
spective factors. Two search intensity variables dis- |
|||||||||||||
a great deal of personal effort into gathering poten- |
tinctly emerged, providing convergent validity con- |
|||||||||||||
tially valuable information,” “I would devote a |
firmation for the search intensity factors |
|||||||||||||
large percentage of my time to searching for infor- |
(Anderson, 1987; Bagozzi & Phillips, 1982). Dis- |
|||||||||||||
mation,” “When searching for information, I would |
criminant validity can be confirmed when pairwise |
|||||||||||||
make looking for new information a top priority for |
construct correlations are significantly different |
|||||||||||||
how I would spend my time,” and “I would go out |
from 1 (Gerbing & Anderson, 1988). Table 1 shows |
|||||||||||||
of my way to find information sources that may |
that the construct measures met this requirement. |
|||||||||||||
have relevant information.” Higher values of search |
We also adopted a more stringent criterion of dis- |
|||||||||||||
effort reflect more effortful search. |
|
|
|
criminant validity requiring the average variance |
||||||||||
Search persistence. Search persistence is de- |
extracted for each construct to be greater than the |
|||||||||||||
fined as the extent to which, on average, members |
squared correlation between a pair of constructs |
|||||||||||||
of a TMT continue to gather information despite |
(Fornell & Larcker, 1981). The average variance ex- |
|||||||||||||
the number of alternatives that have been found, in |
tracted for search effort (.58) and search persistence |
|||||||||||||
order to be exhaustive in determining optimal out- |
(.53) are above the cutoff suggested by Fornell and |
|||||||||||||
come. A four-item scale ( .75) was used, with |
Larcker (1981) and bigger than the squared correla- |
|||||||||||||
higher values reflecting greater TMT search persis- |
tion (.21), indicating good discriminant validity. |
|||||||||||||
tence. Items included “[When searching for infor- |
Search effort ( .81) and search persistence ( |
|||||||||||||
mation, I would] continue searching until I was |
.75) have high reliability, indicating a high internal |
|||||||||||||
satisfied that I had identified all relevant informa- |
consistency. The composite reliability of search ef- |
|||||||||||||
|
|
|
|
|
TABLE 1 |
|
|
|
|
|
|
|
|
|
|
|
Means, Standard Deviations, and Correlationsa |
|
|
|
|
|
|||||||
|
Variable |
Mean |
s.d. |
1 |
2 |
3 |
4 |
5 |
6 |
7 |
8 |
9 |
10 |
11 |
|
|
|
|
|
|
|
|
|
|
|
|
|
|
|
1. |
New product introductions |
1.67 |
2.42 |
|
|
|
|
|
|
|
|
|
|
|
2. |
New product introductions |
3.84 |
5.47 |
.76 |
|
|
|
|
|
|
|
|
|
|
3. |
Terrain unfamiliarity |
61.89 |
11.45 |
.00 |
.04 |
|
|
|
|
|
|
|
|
|
4. |
Terrain distance |
65.14 |
10.65 |
.01 |
.01 |
.41 |
|
|
|
|
|
|
|
|
5. |
Terrain source diversity |
0.87 |
0.03 |
.21 |
.12 |
.16 |
.18 |
|
|
|
|
|
|
|
6. |
Search effort |
3.73 |
0.36 |
.25 |
.14 |
.16 |
.39 |
.02 |
|
|
|
|
|
|
7. |
Search persistence |
3.17 |
0.47 |
.05 |
.06 |
.08 |
.15 |
.06 |
.46 |
|
|
|
|
|
8. |
Team size |
3.43 |
1.16 |
.10 |
.07 |
.11 |
.04 |
.29 |
.25 |
.04 |
|
|
|
|
9. |
Team heterogeneity |
0.64 |
0.13 |
.06 |
.05 |
.02 |
.03 |
.07 |
.29 |
.02 |
.34 |
|
|
|
10. |
Firm sizeb |
1.94 |
4.45 |
.13 |
.28 |
.06 |
.14 |
.09 |
.07 |
.10 |
.03 |
.13 |
|
|
11. |
R&D intensityb |
2.15 |
2.44 |
.03 |
.01 |
.14 |
.15 |
.05 |
.20 |
.08 |
.22 |
.14 |
.29 |
|
12. |
Slackb |
0.28 |
0.57 |
.19 |
.08 |
.08 |
.11 |
.04 |
.01 |
.22 |
.21 |
.33 |
.19 |
.09 |
an 61.
bLogged value.
904 |
Academy of Management Journal |
June |
fort (.85) and search persistence (.81) are above the cutoff suggested by Bagozzi and Yi (1988) and provided further evidence of internal consistency.
Because items were assessed at the individual level, we aggregated these variables to the team level by calculating the average value of each variable. To evaluate appropriate aggregation (George & James, 1993), we employed both within-group agreement (rwg), which is used to assess consistency among members of a group (James, Demaree, & Wolf, 1993), and the intraclass correlation coefficient (ICC), which represents the degree to which variance in individual responses is a function of organization membership (Shrout & Fleiss, 1979). In all cases, aggregation appeared justifiable given the following: rwg values above .70, indicating agreement; ICC1 values above the threshold value of .12 often cited as sufficient for testing hypotheses based on team-aggregated measures (Bliese & Halverson, 1998); and ICC2 values above .50, providing evidence that the group means are reliable and that group-level relationships will be detected (Bliese, 2000).
Control Variables
Team size. Top management team size has been argued to “parsimoniously represent a team’s structural and compositional context” (Amason & Sapienza, 1997: 32). Larger teams have been argued to contain greater diversity of opinions and interests and therefore to promote innovation, but also to have more problems with conflict and information exchange. We measured team size as the number of executives on a team, as provided by a firm’s CEO during her/his interview.
Team heterogeneity. Because top management team heterogeneity may bring more creativity to problem solving and product development, even though the results of prior work have been mixed (Ancona & Caldwell, 1992: 321; Bantel & Jackson, 1989), we controlled for functional diversity in a team. We measured functional heterogeneity using Blau’s (1977) heterogeneity index: 1 t ft2, where f is the proportion of top managers in the f th functional category and t is the number of functions. Functional data were collected from CEOs and include operations/engineering, R&D, marketing/ sales, finance/accounting, HR/personnel, administrative/legal, and other functions.
Firm size. We included firm size as a control because numerous studies have found a relationship between organizational size and innovation
(e.g., Bantel & Jackson, 1989; Damanpour, 1991; Kimberly & Evanisko, 1981). We measured firm size as the logged value of the number of employees as reported by the CEO during the interview.
R&D intensity. Because prior studies have often utilized R&D intensity as a proxy for a firm’s search activities and inputs into innovation efforts (e.g., Greve, 2003; Katila, 2002; Katila & Ahuja, 2002), we controlled for it. We measured R&D intensity by the ratio of a firm’s R&D expense to its sales. R&D expense and sales data were collected through COMPUSTAT. Missing R&D expense data for 18 firms were obtained from the CEO interviews. Data from the CEO interviews were positively and significantly correlated with the data from COMPUSTAT (r .84, p .001).
Slack. Previous literature suggests that organizational slack is an important predictor of innovation (Cyert & March, 1963; Thompson, 1967) because firms with more slack have more financial resources, employees, and possibly more advanced technologies. Following prior research (Bromiley, 1991; Chen, 2008; Greve, 2003; Iyer & Miller, 2008), we used the equity/debt ratio divided by 1,000 to measure organizational slack. Higher values of the ratio indicate higher levels of slack. The data were collected from COMPUSTAT.
Analysis
We used negative binomial regression analyses to test our hypotheses because our count-based dependent variable (sum of new product introductions) was not normally distributed, violating a key assumption of generalized least squares (GLS) regression analysis and overdispersed, meaning the variance of the counts exceeds their means (Derfus et al., 2008). A likelihood-ratio test of overdispersion also indicated that negative binomial regression was an appropriate choice. Negative binomial regression overcomes distribution problems and estimates an additional parameter that corrects for overdispersion (Frome, Kutner, & Beauchamp, 1973). We first entered the control variables to assess the baseline model and then included the main predictor variables followed by the interaction terms. We mean-centered the independent variables before creating the interaction terms.
RESULTS
Table 1 shows the descriptive statistics and correlations for all variables. The correlations among

2013 |
Li, Maggitti, Smith, Tesluk, and Katila |
905 |
the independent variables are relatively low. We also tested for multicollinearity but found that it did not pose a threat to the results that we report.
Table 2 shows the regression results used of our tests of hypotheses. We used new product introductions in 2006 as the dependent variable
in models 1–3 to test our hypotheses, one full year after the collection of the search data. Model 1 includes the control variables and is used as a baseline model. Models 4 – 6 are similar, but the dependent variable is averaged over three years (2006 – 08).
TABLE 2
Negative Binomial Regression Predicting Number of New Productsa
|
|
|
|
|
New Product Introductions, |
||
|
New Product Introductions, 2006 |
|
|
2006–08 Average |
|
||
|
|
|
|
|
|
|
|
Variables |
Model 1 |
Model 2 |
Model 3 |
|
Model 4 |
Model 5 |
Model 6 |
|
|
|
|
|
|
|
|
Search selection |
|
|
|
|
|
|
|
Terrain unfamiliarity |
|
0.03* |
0.003 |
|
|
0.02† |
0.02 |
|
|
(0.02) |
(0.02) |
|
|
(0.02) |
(0.03) |
Terrain distance |
|
0.04† |
0.002 |
|
|
0.04* |
0.02 |
|
|
(0.03) |
(0.03) |
|
|
(0.02) |
(0.03) |
Terrain source diversity |
|
23.46** |
50.08*** |
|
|
9.13† |
13.18 |
|
|
(9.44) |
(12.66) |
|
|
(6.91) |
(11.54) |
Search intensity |
|
|
|
|
|
|
|
Search effort |
|
2.82*** |
4.66*** |
|
|
2.05*** |
2.31*** |
|
|
(0.68) |
(0.82) |
|
|
(0.56) |
(0.65) |
Search persistence |
|
0.64* |
1.67*** |
|
|
0.76* |
1.04* |
|
|
(0.36) |
(0.51) |
|
|
(0.38) |
(0.51) |
Search selection search intensity |
|
|
|
|
|
|
|
Unfamiliarity search effort |
|
|
0.10† |
|
|
|
0.02 |
|
|
|
(0.06) |
|
|
|
(0.07) |
Distance search effort |
|
|
0.23** |
|
|
|
0.19** |
|
|
|
(0.09) |
|
|
|
(0.06) |
Source diversity search effort |
|
|
144.34*** |
|
|
|
59.99* |
|
|
|
(32.62) |
|
|
|
(23.70) |
Unfamiliarity search persistence |
|
0.01 |
|
|
|
0.003 |
|
|
|
|
(0.03) |
|
|
|
(0.05) |
Distance search persistence |
|
|
0.12† |
|
|
|
0.07 |
|
|
|
(0.07) |
|
|
|
(0.06) |
Source diversity search persistence |
|
76.78** |
|
|
|
26.69 |
|
|
|
|
(24.69) |
|
|
|
(17.53) |
Control variables |
|
|
|
|
|
|
|
Team size |
0.84 |
1.29 |
0.47 |
0.34 |
0.85 |
0.60 |
|
|
(0.69) |
(0.88) |
(0.70) |
(0.60) |
(0.59) |
(0.55) |
|
Team heterogeneity |
0.35 |
1.53 |
1.68* |
0.72 |
1.78* |
1.78* |
|
|
(1.29) |
(1.04) |
(0.76) |
(0.89) |
(0.81) |
(0.72) |
|
Firm size |
0.05 |
0.11** |
0.11** |
0.07* |
0.12** |
0.11** |
|
|
(0.04) |
(0.04) |
(0.03) |
(0.03) |
(0.03) |
(0.03) |
|
R&D intensity |
0.08 |
0.09 |
0.09 |
0.08 |
0.08 |
0.08 |
|
|
(0.08) |
(0.07) |
(0.08) |
(0.07) |
(0.06) |
(0.07) |
|
Slack |
0.59† |
1.05** |
0.95** |
0.48 |
0.76** |
0.56* |
|
|
(0.35) |
(0.27) |
(0.25) |
(0.32) |
(0.23) |
(0.23) |
|
Constant |
0.83 |
1.10 |
0.48 |
0.001 |
0.46 |
0.12 |
|
|
(1.30) |
(1.34) |
(0.93) |
(0.97) |
(0.83) |
(0.79) |
|
Pseudo log-likelihood |
102.34 |
93.2 |
82.56 |
|
92.23 |
84.97 |
80.41 |
Wald 2 |
4.42 |
43.15 |
83.79 |
6.18 |
34.7 |
74.67 |
|
df |
5 |
10 |
16 |
5 |
10 |
16 |
|
an 61. Robust standard errors are in parentheses. One-tailed test for main effects; two-tailed test for interaction effects.
†p .10
*p .05
**p . 01
***p .001
906 |
Academy of Management Journal |
June |
In Hypothesis 1, we argue that unfamiliar (1a), distant (1b), and diverse (1c) search selection result in more new product introductions. To test Hypothesis 1, we examined the coefficients of search selection in model 2. We find all three coefficients of search selection are positive, and terrain unfamiliarity (1a) is significant ( 0.03, p .05); terrain distance (1b) is moderately significant ( 0.04, p .10); and terrain source diversity (1c) is significant ( 23.46, p .01). Together, these results confirm that unfamiliar, distant, and diverse search selection lead to more new product introductions. Similarly, we test Hypothesis 2 by examining the coefficients of search intensity in model 2 and find that search persistence (2b) is positive and significant ( 0.64, p .05), but search effort (2a) is negative and significant ( 2.82, p .001). These results show that search persistence can result in more new product introduction, yet search effort decreases the number of new product introductions.
In Hypothesis 3, we predicted that search intensity positively moderates the relationship between search selection and new product introductions. To test Hypotheses 3a through 3f, we included the interaction of each selection variable and each intensity variable in model 3 of Table 2 and found significant results for three of the six interactions: terrain distance and search effort ( 0.23, p
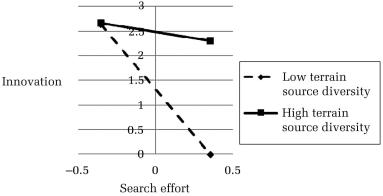
.01); terrain source diversity and search effort ( 144.34, p .001); terrain source diversity and search persistence ( 76.78, p .01). All three of these interactions are plotted and shown in Figures 2, 3, and 4. In summary, the plots run contrary to our expectations stated in Hypotheses 3b, 3c, and 3f, and we did not have significant findings for
Hypotheses 3a, 3d, and 3e. We return to these interesting results in the discussion section.
We conducted several additional analyses to check the robustness of our results. First, as shown in models 4–6 of Table 2, the results are similar when we use the average yearly new product introductions from 2006 to 2008 as our dependent variable, except that the interaction of terrain source diversity and search persistence becomes insignificant. Second, since new product introductions may be influenced by unobserved firm heterogeneity, we adopted a presample approach (Blundell, Griffith, & Van Reenen, 1995). In the presample approach, unobserved heterogeneity is modeled as an additional covariate in the model. This covariate is constructed of the dependent variable values in the periods immediately preceding the study period. We used the mean of new product introductions in years 2003 and 2004 to construct a presample variable, and the results were consistent with those reported earlier. In addition, we controlled for unobserved heterogeneity by adding the lagged values of the dependent variable, in our case new product introductions in 2005, as a control (Heckman & Borjas, 1980; Helfat, 1994). The results of these regressions again were similar to our original findings—that is, the significant main effects and three significant interaction effects of interest remain significant. Next, since patent data are frequently used to represent firm search (e.g., Katila & Ahuja, 2002) and thus can serve as an instrument to capture unobserved heterogeneity affecting firm innovations, we replaced the lagged values of the dependent variables with each firm’s number of patents in 2005. Again, these results were broadly similar to those that we originally reported. Third,
FIGURE 2
Interaction of Terrain Source Diversity and Search Effort
2013 |
Li, Maggitti, Smith, Tesluk, and Katila |
907 |
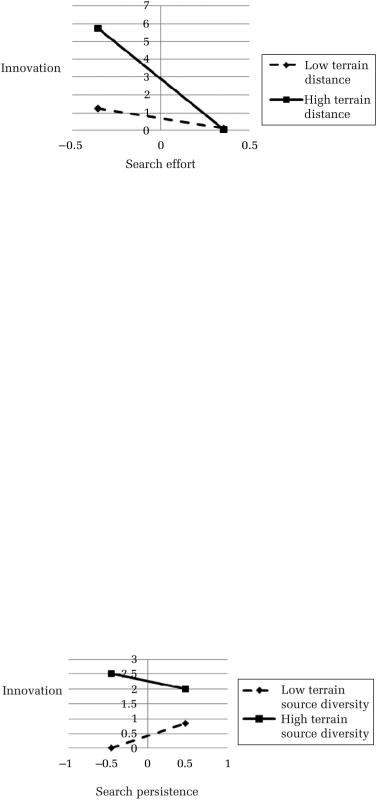
FIGURE 3
Interaction of Terrain Distance and Search Effort
we ran all original regressions using Poisson models and found virtually identical results. We also ran Poisson regression with presample, lagged dependent variables, and patent data separately finding significant main effects (except search persistence) and three interaction effects graphed remain significant.
DISCUSSION
We developed theory to investigate TMT search for new information and knowledge, long recognized as an important function of managers (Thompson, 1967). Drawing on cognitive attention theory, we advanced hypotheses about the relationship between TMT search and new product innovation. The theory explains how TMT members’ choices about search selection and search intensity influence their firm’s capability to detect, develop, and deploy new products in markets. Overall, we find that both the selection and intensity of search significantly affect the number of new product introductions. We further find that search intensity and search selection work together to affect new
product introductions, although in unexpected ways. This finding suggests that achieving high levels of innovation requires TMTs to find an appropriate fit of selection and intensity of search.
Building on and extending theories of attention and cognitive processing, this research enhances understanding of managerial search by employing the notion of human attention to study how TMTs search. Using attention theory, we highlight cognitive logics underlying managerial search by identifying two separate attention components: Search selection and search intensity. By focusing on two dimensions of search, we extend understanding of the concept of search to include search intensity as an important component. In doing so, we provide a more complete conceptualization of managerial search than has been recognized in prior innovation studies. In addition, we provide empirical evidence to support the importance of search intensity and its joint effect with search selection, thus advancing the literature on top management information processing and innovation (Yadav et al., 2007). Further, by investigating search as an individual process functioning at the TMT level, we
FIGURE 4
Interaction of Terrain Source Diversity and Search Persistence
908 |
Academy of Management Journal |
June |
provide a micro foundation for other more out- come-based or end-state indicators of search such as patent citations (Katila & Chen, 2008; Rosenkopf & Nerkar, 2001), international expansion decisions (Vermeulen & Barkema, 2001), and types of acquisitions (Baum et al., 2000).
With respect to our specific results, as predicted, each search selection dimension—terrain unfamiliarity, distance (marginal), and source diversity— has a significantly positive relationship with new product introductions. These findings support our argument that the identification of novel knowledge and information is the key ingredient to the introduction of new products. Our unique insight was that because unfamiliar, distant, and diverse searches are more likely to contain novel, vivid, and salient information and knowledge, they are more likely to capture the attention of top management as they search their environment.
Our results also highlight the significant effect of search intensity on new product introductions. This is potentially important because prior research has focused on search selection to the exclusion of its intensity. Controlling for variation in search selection, our results suggest that engaging in a persistent search process can increase the number of new products. To a large extent, this finding resonates with arguments in the decision making literature demonstrating that processes are important to decision outcomes (Fredrickson, 1984; Nutt, 1986). Although some prior literature has argued that managers use “satisficing” information-gather- ing approaches (Cyert & March, 1963), our findings, in contrast, suggest that a persistent search process can influence managers’ cognitive capacities in noticing, interpreting, and making sense of new information and knowledge that may, in turn, increase number of new products. The result also implies that development of new products requires discovery of a greater amount or in-depth information achieved through increased search persistence. Although post hoc analysis showed no support for the presence of mediation between search selection and intensity, future research can explore the interrelatedness of search selection and persistence. Specifically, it would be interesting to examine if search persistence motivates search selection, or vice versa.
Interestingly, and opposite to our hypothesis, we found that when TMTs engage in effortful search, fewer new products get introduced. The rationale behind our original hypothesis is that putting more energy and hard work into the search process allo-
cates more cognitive capacity to search and hence increases the new information and knowledge searchers process and in turn increases new product introductions. One potential explanation for this unexpected finding may be related to our conceptualization of search effort as the extent to which the members of a TMT devote energy and cognitive resources to search versus other activities. Perhaps high levels of search effort indicate overinvestment of TMT members’ limited cognitive and time resources in information gathering at the expense of other important top management functions related to new products (e.g., building organizational capabilities for pursuing new innovations). Although we described the TMT role in new product development as a complex processes including detection, development, and deployment (Yadav et al., 2007) and drew connections between those mechanisms and search, activities other than search are also likely to influence the detection, development, and deployment process. For example, prior research has demonstrated the positive influence of planning, implementation, and team coordination (Brown & Eisenhardt, 1995; Cooper, 1979; Cooper & Kleinschmidt, 1987; Nutt, 1986). Thus, perhaps when TMT members are overcommitted to information search, they may not be able to undertake sufficient predevelopment planning (Dwyer & Mellor, 1991) or they may weaken the effort they place on directly managing the new product deployment or development process (Cooper & Kleinschmidt, 1987). Additionally, since TMT attention is a scarce firm resource, TMT attention to search competes with these other important activities, which may also require TMT attention (Hambrick & Abrahamson, 1995; Hambrick & Mason, 1984; Smith & Tushman, 2005). Interesting potential exists for future research to explore the allocation of TMT attention across a range of activities, including whether and how extensive search effort for new information and knowledge comes at the expense of other important new product activities.
Another possible explanation for the negative influence of effort might be related to TMT delegation of search to others in their organization. Perhaps TMTs delegate the search intensity task to others once potential new knowledge and information is identified. This possibility seems to fit the negative correlation between search effort and R&D intensity (see Table 1). That is, R&D may be utilized in a bid to ensure that the TMT is not overly consumed with the effort involved in search. From this per-
2013 |
Li, Maggitti, Smith, Tesluk, and Katila |
909 |
spective, low effort is not what is causing innovation; it is that the responsibility for effort may be delegated away from a TMT and to another group in its firm. Hence, we think future research that explores how TMTs expand and delegate their initial search effort to include others in the process would be an interesting avenue for future research. Specifically, it would be appealing to explore the relationship between the search effort of top managers and other scientists and R&D employees.
Our study makes another important contribution by examining the joint effect of search selection and search intensity. Given the importance of search selection in prior innovation research (e.g., Katila & Ahuja, 2002), as well the main selection effects we find, it is import to understand how search selection and search intensity are linked to one another. Even though, contrary to our expectations, Figures 2–4 reveal an important fit explanation with respect to these relationships. First, while we noted a negative direct effect of search effort, it appears particularly problematic to expend additional energy when search selection is narrow and distant. Specifically, the bottom-right quadrant of Figure 2 suggests that TMTs that exert energy to search for information and knowledge in tightly defined domains do so with damage to new product introductions. In fact, the upper-right quadrant of the Figure 2 reveals that high effort fits far better with a diverse search location. Since we argue that searches low in diversity contain less novel information and knowledge, it may be that the marginal benefit of spending additional energy attending to such terrains is low and the opportunity cost of that effort is large. That is, the more attention focused on homogenous terrains, the more other activities related to the detection, development, and deployment of new products may be left undone, not carried out in proper manner, or suffer due to lack of direct attention.
With respect to the interaction of terrain distance and search effort in Figure 3, we note the particularly detrimental impact of high effort in distant terrains shown in the lower-right quadrant. In keeping with the previous interaction between terrain source diversity and search effort, we believe this finding suggests that high levels of energy and hard work used by TMTs undertaking distant searches are exerted at the risk of wasting that effort, relative to other tasks or attention to other activities that may also be important to new product introductions. It may be that when TMT members are less familiar with the information in dis-
tant terrains, they need to exert additional attentional effort to gain an understanding and make sense of that information. That is to say, TMT members may need to divert their attention from other important activities when they search in distant terrains. Again the fit between terrain distance and search effort appears important. We speculate that the two preceding search effort interactions suggest a cohesive story with respect to the relationship between search selection and search effort. In both cases, the benefit of spending additional attentional capacity is decreased when the level of novel information and knowledge is low or because the interpretation of information requires too much attentional capacity. Perhaps when TMTs allocate more attentional capacity in such terrains, less attentional capacity and time are available for other important activities useful in the detection, development, and deployment of new products. These two interaction effects beg for additional research between search selection and intensity and especially on the role of attention allocation.
The interaction between terrain source diversity and search persistence is also interesting. Though the direct effect of search persistence on new products is positive, the upper-left quadrant of Figure 4 reveals that when a highly diverse terrain is selected, high search persistence is not desirable. On the other hand, TMTs undertaking narrow search enjoy a benefit through more persistence. We believe this is again about fit between search selection and intensity. In our study, search persistence refers to the extent to which TMT members attempt to be exhaustive in seeking new knowledge and information. Thus, it seems that attempting to search exhaustively in vastly diverse locales is an overwhelming task, and trying to accomplish both has a negative impact on TMT ability to perform in other ways. From this perspective, the findings may again have to do with the impact of selection versus intensity and fit between the two. That is, just as we speculated when discussing interactions with search effort, future research examining the tradeoffs that might occur between search persistence and selection could be important.
Taken together, our search effort and persistence interaction findings highlight the importance of understanding limited attentional capacity and efficiency and especially raise questions about how TMTs should allocate their limited attention to different tasks and activities. High search effort and perhaps accompanying low search efficiency may impede managers from taking advantage of novel
910 |
Academy of Management Journal |
June |
information and knowledge identified through diverse and distant terrains. Therefore, putting less effort and persistence into searching locations in which information is likely to be particularly salient and easily noticed can perhaps free cognitive and intellectual capacities of top managers to enable them to attend to other important organizational responsibilities. These findings have two major implications for new product development and attention theory. First, new product introduction is a complex process including a variety of important activities related to their detection, development, and deployment. It may be that these activities all compete for TMT attentional capacity. Overallocation of TMT attentional capacity to one activity may inevitably reduce time and energy spent directly undertaking other activities as well as reducing attentional capacity toward those activities. The resulting outcome may ultimately have a negative impact on new product introduction. Although novel information and knowledge appear important for new product development, TMTs may need to effectively manage and allocate their attention to multiple activities. Second, it may be that the marginal benefits of attention intensity differ based on the context. Specifically, the marginal benefits may be reduced when searches contain little novel information and knowledge and thus extra attention fails to result in any residual benefit. Ultimately, both of these implications suggest top managers should carefully manage their attention intensity when carrying out search for new information and knowledge. Specifically, top managers should recognize the importance of the fit between search terrains and search intensity and their relationship to new products.
In summary, our search selection and intensity interaction results provide very interesting avenues for future research. While the current research has focused on how TMT search selection and intensity individually and jointly affect the development of new products, future research might examine the predictors of variation in TMT search. For example, the upper echelons literature has suggested that TMT demographic background predicts attention patterns of executives (Cho & Hambrick, 2006). In this regard, Table 1 suggests that team size and functional diversity are correlated with search effort and that team size is related to terrain source diversity. These correlations suggest that the study of TMT demography may offer insights into the predictors of executive search and/or act as moderators to search outcomes. TMT psychological attri-
butes and characteristics may also prove impactful in search and could represent rich future research potential.
Furthermore, Ocasio (1997) theorized that organizational variables such as culture, context, and economic resources will predict organizational attentional focus. Given the importance attributed to search in the organization literature, we think it would be very important to study these and other organizational predictors of search and how these organizational variables moderate search outcomes.
While the current study offers a number of insights, like all research, it carries limitations. First, we focus on search in the context of TMTs, where the concept has been described as fundamental (Mintzberg, Raisinghani, & Theoret, 1976). Interestingly, our research on search suggests that search intensity is a characteristic of TMTs and is linear. It would be interesting to explore whether this holds and if firms intentionally develop search protocols for their executives to follow and whether such protocols are desirable or not. In addition, it is quite possible that the relationship between TMT search and new products would be found to vary if one were to study search selection and intensity among scientists or other R&D personnel in firms’ technical cores. We made a significant effort to control for other firm-level sources of new products in our empirical models, such as firm size, slack, and R&D intensity, and our results are robust; however, future research needs to better articulate how TMTs work with others in their firms, including research scientists and R&D employees, who are also likely to have an effect on new product development.
Second, our sample focused on high-technology firms. While this sample is particularly appropriate for studying innovative outcomes, it may be that the role of executive search would vary in different industries and with different outcome measures. Therefore, it is interesting to envision how future research may extend the study of search to other industries and study the effect of executive search on other important outcomes.
Primary data obtained directly from CEOs and other top managers are difficult to obtain and not frequently used in studies of this type. While they therefore represent a significant strength of our study, this methodology results in a relatively small sample size. On average, the public firms in our sample also have fewer assets, employees, and lower sales than the original 358 public firms we
2013 |
Li, Maggitti, Smith, Tesluk, and Katila |
911 |
contacted. Thus, the implications of our study may generalize more to smaller public firms. While it may be difficult to obtain larger samples of executives to study search selection and intensity in the same manner as the present research, it is possible that future research can utilize other creative ways of inferring the search of executives from archival data such as their written accounts, documents, and public announcements.
By conceptualizing managerial search as search selection and search intensity, we provide a more complete picture of TMT search, advancing the search literature linking TMTs to innovation. Our research suggests that in order to increase the number of new products in high-technology industries, TMT members might consider conducting search in unfamiliar, distant, and diverse terrains and employ a persistent yet less effortful and perhaps more efficient processes. By empirically linking search selection and search intensity to firm new products, we have demonstrated that, along with search selection, search intensity is also important in affecting firm new products. Finally, by examining the joint effect of search selection and search intensity, we demonstrate that these notions of search are complex and in need of additional research.
REFERENCES
Acs, Z. J., Anselin, L., & Varga, A. 2002. Patents and innovation counts as measures of regional production of new knowledge. Research Policy, 31: 1069– 1085.
Ahuja, G., & Katila, R. 2004. Where do resources come from? The role of idiosyncratic situations. Strategic Management Journal, 25: 887–907.
Ahuja, G., Lampert, C. M., & Tandon, V. 2008. Moving beyond Schumpeter: Management research on the determinants of technological innovation. In A. P. Brief & J. P. Walsh (Eds.), Academy of Management annals, vol. 2: 1–98. Essex, UK: Routledge.
Alexander, E. R. 1979. The design of alternatives in organizational contexts: A pilot study. Administrative Science Quarterly, 24: 382–404.
Amason, A. C., & Sapienza, H. J. 1997. The effects of top management team size and interaction norms on cognitive and affective conflict. Journal of Management, 23: 495–516.
Ancona, D. G., & Caldwell, D. F. 1992. Demography and design: Predictors of new product team performance.
Organization Science, 3: 321–341.
Anderson, J. C. 1987. An approach for confirmatory measurement and structural equation modeling of organizational properties. Management Science, 33: 525– 541.
Argote, L. 1999. Organizational learning: Creating, retaining, and transferring knowledge. Boston: Kluwer Academic.
Bagozzi, R. P., & Phillips, L. W. 1982. Representing and testing organizational theories: A holistic construal.
Administrative Science Quarterly, 27: 459–489.
Bagozzi, R., & Yi, Y. 1988. On the evaluation of structural equation models. Journal of the Academy of Marketing Science, 16: 74–94.
Bantel, K. A., & Jackson, S. E. 1989. Top management and innovations in banking: Does the composition of the top team make a difference? Strategic Management Journal, 10: 107–124.
Baum, J. A. C., Li, S. X., & Usher, J. M. 2000. Making the next move: How experiential and vicarious learning shape the locations of chains’ acquisitions. Administrative Science Quarterly, 45: 766–801.
Beal, R. M. 2000. Competing effectively: Environmental scanning, competitive strategy, and organizational performance in small manufacturing firms. Journal of Small Business Management, 38: 27–47.
Berlyne, D. E. 1954. A theory of human curiosity. British Journal of Psychology, 45: 180–191.
Blau, P. M. 1977. Inequality and heterogeneity: A primitive theory of social structure. New York: Free Press.
Bliese, P. D. 2000. Within-group agreement, non-inde- pendence, and reliability: Implications for data aggregation and analysis. In K. J. Klein & S. W. J. Kozlowski (Eds.), Multilevel theory, research, and methods on organizations: 349–381. San Francisco: Jossey-Bass.
Bliese, P. D., & Halverson, R. R. 1998. Group consensus and psychological well-being: A large field study.
Journal of Applied Social Psychology, 28: 563–580.
Blundell, R., Griffith, R., & Van Reenen, J. 1995. Dynamic count data models of technological innovation. Economic Journal, 105: 333–344.
Bromiley, P. 1991. Testing a causal model of corporate risk taking and performance. Academy of Management Journal, 34: 37–59.
Brown, S. L., & Eisenhardt, K. M. 1995. Product development: Past research, present findings, and future directions. Academy of Management Review, 20: 343–378.
Burgelman, R. A. 1991. Intraorganizational ecology of strategy making and organizational adaptation: The-
912 |
Academy of Management Journal |
June |
ory and field research. Organization Science, 2: 239–262.
Chen, W.-R. 2008. Determinants of firms’ backwardand forward-looking R&D search behavior. Organization Science, 19: 609–622.
Child, J. 1972. Organization structure and strategies of control: A replication of the Aston study. Administrative Science Quarterly, 17: 163–177.
Cho, T. S., & Hambrick, D. C. 2006. Attention as the mediator between top management team characteristics and strategic change: The case of airline deregulation. Organization Science, 17: 453–469.
Choudhury, V., & Sampler, J. L. 1997. Information specificity and environmental scanning: An economic perspective. MIS Quarterly, 21: 25–53.
Cohen, W. 1995. Empirical studies of innovative activity. In P. Stoneman (Ed.), Handbook of the economics of innovations and technological change: 182–264. Oxford, UK: Blackwell.
Collins, C. J., & Smith, K. G. 2006. Knowledge exchange and combination: The role of human resource practices in the performance of high-technology firms.
Academy of Management Journal, 49: 544–560.
Cooper, R. G. 1979. The dimensions of industrial new product success and failure. Journal of Marketing, 93–103.
Cooper, R. G., & Kleinschmidt, E. J. 1987. New products: What separates winners from losers? Journal of Product Innovation Management, 4(3): 169–184.
Crocker, J., & McGraw, K. M. 1984. What’s good for the goose is not good for the gander. American Behavioral Scientist, 27: 357–369.
Cyert, R. M., & March, J. G. 1963. A behavioral theory of the firm. Englewood Cliffs, NJ: Prentice Hall.
Daft, R. L., Sormunen, J., & Parks, D. 1988. Chief executive scanning, environmental characteristics, and company performance: An empirical study. Strategic Management Journal, 9: 123–139.
Daft, R. L., & Weick, K. E. 1984. Toward a model of organizations as interpretation systems. Academy of Management Review, 9: 284–295.
Damanpour, F. 1991. Organizational innovation: A metaanalysis of effects of determinants and moderators.
Academy of Management Journal, 34: 555–590.
Dean, J. W., Jr., & Sharfman, M. P. 1996. Does decision process matter? A study of strategic decision-making effectiveness. Academy of Management Journal,
39: 368–396.
Dearborn, D. C., & Simon, H. A. 1958. Selective perception: A note on the departmental identifications of executives. Sociometry, 21(2): 140–144.
Derfus, P. J., Maggitti, P. G., Grimm, C. M., & Smith, K. G. 2008. The Red Queen effect: Competitive actions and firm performance. Academy of Management Journal, 51: 61–80.
Dollinger, M. J. 1984. Environmental boundary spanning and information processing effects on organizational performance. Academy of Management Journal,
27: 351–368.
Driver, J. 2001. A selective review of selective attention research from the past century. British Journal of Psychology, 92: 53–79.
Dutton, J. E., Ashford, S. J., O’Neill, R. M., & Lawrence, K. A. 2001. Moves that matter: Issue selling and organizational change. Academy of Management Journal, 44: 716–736.
Dwyer, L., & Mellor, R. 1991. Organizational environment, new product process activities, and project outcomes. Journal of Product Innovation Management, 8(1): 39–48.
Finke, R. A., Ward, T. B., & Smith, S. M. 1992. Creative cognition: Theory, research, and applications.
Cambridge, MA: MIT Press.
Fiske, S. T., & Taylor, S. E. 2008. Social cognition: From brains to culture. New York: McGraw Hill.
Fornell, C., & Larcker, D. F. 1981. Evaluating structural equation models with unobservable variables and measurement error. Journal of Marketing Research,
18: 39–50.
Forsyth, B. H., & Lessler, J. 1991. Cognitive laboratory methods: A taxonomy. In P. Biemer, R. Groves, L. Lyberg, N. Mathiowetz, & S. Sudman (Eds.), Measurement errors in surveys: 393–418. New York: Wiley.
Fredrickson, J. W. 1984. The comprehensiveness of strategic decision processes: Extension, observations, future directions. Academy of Management Journal,
27: 445–466.
Frome, E. L., Kutner, M. H., & Beauchamp, J. J. 1973. Regression analysis of Poisson-distributed data.
Journal of the American Statistical Association,
68: 935–940.
Gardner, M. P. 1983. Advertising effects on attributes recalled and criteria used for brand evaluations.
Journal of Consumer Research, 10: 310–318.
Gavetti, G., & Levinthal, D. 2000. Looking forward and looking backward: Cognitive and experiential