Cadence / DSD2 / Конспект -Введение в Cadence DSD2 / Конспект -Введение в Cadence DSD2 / Лекция2 / intro_tutorial
.pdf
5 Send the Results to Matlab Environment
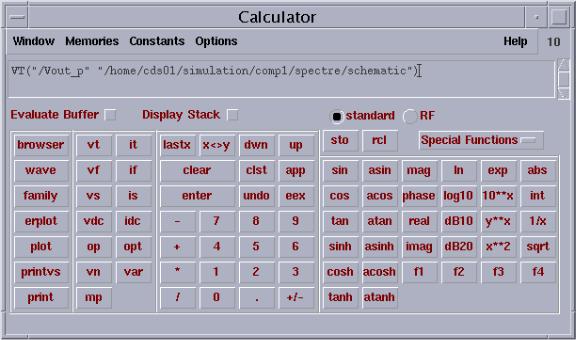
Step 1: In Analog Artist Simulation Waveform Window, select Tools Calculator. A Calculator form appears, shown in Fig. 23.
Fig. 23. Calculator form.
Step 2: Click “wave” button in the left column, then back to the Waveform Window, click on the wave you want to print out.
Step 3: Once the waveform is selected, click on “printvs” button in the left column. This will open a form asking for the range of values you want. You can either fill it out for plotting a range of data, or leave it blank for printing all the data and click “OK”.
Step 4: A Results Display window will open with your values in tabular format. Select File Print…and print the data to a file (<file_name>) you nominate.
Step 5: You can ftp this ASCII file to PC or, and any one you like for post-processing.
Step 6: For example, in Matlab, you can type “load <file_name> -ASCII” command to read the data into workspace, and you can do post-processing for the data.
- 20 -
6 Conclusion
A short tutorial on how to use Cadence software is presented. We try to include the basic UNIX commands, how to set the UNIX environment for Cadence design tool, and a practical example of simulating a simple Inverter in this short tutorial, and it is helpful for beginners to start their jobs at a short time.
References
[1]Cadence Design Systems, Inc., Analog Artist Mixed-Signal Simulation and Analysis, 1999.
[2]N. H. E. Weste and K. Eshraghian, Principles of CMOS VLSI Design: A System Perspective, Addison-Wesley, 2nd edition, 1993.
- 21 -
