

Диплом ИМЭ, ССК / Диплом / diplom / Приложения / HANDBOOK_DOD-Systems-Engineering-Guide-2001-01
.pdfChapter 6 |
Design Synthesis |
CHAPTER 6
DESIGN SYNTHESIS
6.1 DESIGN DEVELOPMENT
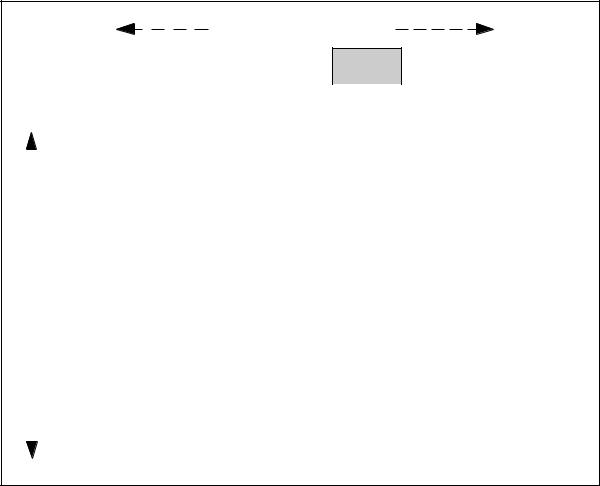
Design Synthesis is the process by which concepts or designs are developed based on the functional descriptions that are the products of Functional Analysis and Allocation. Design synthesis is a creative activity that develops a physical architecture (a set of product, system, and/or software elements) capable of performing the required functions within the limits of the performance parameters prescribed. Since there may be several hardware and/ or software architectures developed to satisfy a given set of functional and performance requirements, synthesis sets the stage for trade studies to select the best among the candidate architectures. The objective of design synthesis is to combine
and restructure hardware and software components in such a way as to achieve a design solution capable of satisfying the stated requirements. During concept development, synthesis produces system concepts and establishes basic relationships among the subsystems. During preliminary and detailed design, subsystem and component descriptions are elaborated, and detailed interfaces between all system components are defined.
The physical architecture forms the basis for design definition documentation, such as, specifications, baselines, and work breakdown structures (WBS). Figure 6-1 gives an overview of the basic parameters of the synthesis process.
• Outputs:
– Physical Architecture (Product Elements and Software Code)
– Decision Database
• Inputs:
– Functional Architecture
• Enablers:
– IPTs, Decision Database, Automated Tools, Models
• Controls:
– Constraints; GFE, COTS, & Reusable S/W; System concept & subsystem choices; organizational procedures
• Activities:
– Allocate functions and constraints to system elements
– Synthesize system element alternatives
Inputs
– Assess technology alternatives
–Define physical interfaces
–Define system product WBS
–Develop life cycle techniques and procedures
–Integrate system elements
–Select preferred concept/design
Controls
Design |
|
|
Outputs |
Synthesis |
|
|
|
|
|
|
|
|
|
|
|
Enablers
Figure 6-1. Design Synthesis
57
Systems Engineering Fundamentals |
Chapter 6 |
Characteristics
Physical architecture is a traditional term. Despite the name, it includes software elements as well as hardware elements. Among the characteristics of the physical architecture (the primary output of Design Synthesis) are the following:
•The correlation with functional analysis requires that each physical or software component meets at least one (or part of one) functional requirement, though any component can meet more than one requirement,
•The architecture is justified by trade studies and effectiveness analyses,
•A product WBS is developed from the physical architecture,
•Metrics are developed to track progress among KPPs, and
•All supporting information is documented in a database.
to the relationship of internal elements within one module to internal elements within another module. High connectivity is undesirable in that it creates complex interfaces that may impede design, development, and testing.
Design Loop
The design loop involves revisiting the functional architecture to verify that the physical architecture developed is consistent with the functional and performance requirements. It is a mapping between the functional and physical architectures. Figure 6-2 shows an example of a simple physical architecture and how it relates to the functional architecture. During design synthesis, re-evaluation of the functional analysis may be caused by the discovery of design issues that require re-examination of the initial decomposition, performance allocation, or even the higher-level requirements. These issues might include identification of a promising physical solution or open-system opportunities that have different functional characteristics than those foreseen by the initial functional architecture requirements.
Modular Designs
Modular designs are formed by grouping components that perform a single independent function or single logical task; have single entry and exit points; and are separately testable. Grouping related functions facilitates the search for modular design solutions and furthermore increases the possibility that open-systems approaches can be used in the product architecture.
Desirable attributes of the modular units include low coupling, high cohesion, and low connectivity. Coupling between modules is a measure of their interdependence, or the amount of information shared between two modules. Decoupling modules eases development risks and makes later modifications easier to implement. Cohesion (also called binding) is the similarity of tasks performed within the module. High cohesion is desirable because it allows for use of identical or like (family or series) components, or for use of a single component to perform multiple functions. Connectivity refers
6.2 SYNTHESIS TOOLS
During synthesis, various analytical, engineering, and modeling tools are used to support and document the design effort. Analytical devices such as trade studies support decisions to optimize physical solutions. Requirements Allocation Sheets (RAS) provide traceability to the functional and performance requirements. Simple descriptions like the Concept Decription Sheet (CDS) help visualize and communicate the system concept. Logic models, such as the Schematic Block Diagram (SBD), establish the design and the interrelationships within the system.
Automated engineering management tools such as Computer-Aided Design (CAD), Computer- Aided-Systems Engineering (CASE), and the Computer-Aided-Engineering (CAE) can help organize, coordinate and document the design effort. CAD generates detailed documentation describing the product design including SBDs, detailed
58
Chapter 6 |
Design Synthesis |
PHYSICAL ARCHITECTURE
Aircraft
|
|
|
|
|
|
|
|
|
|
|
|
|
|
|
|
|
|
|
|
|
|
|
|
|
|
|
|
|
|
|
|
|
|
|
|
|
|
|
|
|
|
|
|
Air |
|
Engine |
|
Communi- |
|
Nav |
|
Fire |
|
||||||
|
|
|
|
Frame |
|
|
cations |
|
System |
|
Control |
|
|||||||
|
|
|
|
|
|
|
|
|
|
|
|
||||||||
|
|
|
|
|
|
|
|
|
|
|
|
|
|
|
|
|
|
|
|
|
|
Function Performed |
|
|
|
|
|
|
|
|
|
|
|
|
|
|
|
|
|
|
|
|
|
|
|
|
|
|
|
|
|
|
|
|
|
|
|
|
|
|
|
|
|
|
|
|
|
|
|
|
|
|
|
|
|
|
|
|
|
|
|
Preflight check |
|
X |
|
X |
X |
|
X |
|
X |
||||||||
|
|
||||||||||||||||||
|
|
|
|
|
|
|
|
|
|
|
|
|
|
|
|
|
|
|
|
|
A |
Fly |
|
|
|
|
|
|
|
|
|
|
|
|
|
|
|
|
|
|
|
|
|
|
|
|
|
|
|
|
|
|
|
|
|
|
|
||
|
|
|
|
|
|
|
|
|
|
|
|
|
|
|
|
|
|
|
|
F |
R |
Load |
|
X |
|
|
|
|
|
|
|
|
|
|
|
|
|
|
|
U |
C |
|
|
|
|
|
|
|
|
|
|
|
|
|
|
|
|
|
|
Taxi |
|
X |
|
X |
X |
|
|
|
|
|
|
|
|||||||
N |
H |
|
|
|
|
|
|
|
|
|
|||||||||
|
|
|
|
|
|
|
|
|
|
|
|
|
|
|
|
|
|
||
C |
I |
Take-off |
|
X |
|
X |
|
|
|
|
|
|
|
|
|
||||
T |
|
|
|
|
|
|
|
|
|
|
|
||||||||
T |
|
|
|
|
|
|
|
|
|
|
|
|
|
|
|
|
|
|
|
Cruise |
|
X |
|
X |
X |
|
X |
|
|
|
|
||||||||
I |
E |
|
|
|
|
|
|
|
|||||||||||
C |
|
|
|
|
|
|
|
|
|
|
|
|
|
|
|
|
|
|
|
O |
Recon |
|
X |
|
X |
X |
|
X |
|
|
|
|
|||||||
N |
T |
|
|
|
|
|
|
|
|
|
|
|
|
|
|
|
|
|
|
|
|
|
|
|
|
|
|
|
|
|
|
|
|
|
|
|
|
||
A |
U |
Communicate |
|
|
|
|
|
|
|
|
X |
|
|
|
|
|
|
|
|
L |
R |
|
|
|
|
|
|
|
|
|
|
|
|
|
|
|
|
|
|
– |
|
|
|
|
|
|
|
|
|
|
|
|
|
|
|
|
|
||
|
E |
|
|
|
|
|
|
|
|
|
|
|
|
|
|
|
|
|
|
|
|
– |
|
|
|
|
|
|
|
|
|
|
|
|
|
|
|
|
|
|
|
|
|
|
|
|
|
|
|
|
|
|
|
|
|
|
|
|
|
|
|
|
|
|
|
|
|
|
|
|
|
|
|
|
|
|
|
|
|
|
|
Surveillance |
|
|
|
|
|
|
|
|
|
|
|
|
|
|
|
|
|
|
|
|
|
|
|
|
|
|
|
|
|
|
|
|
|
|
|
|
|
|
|
|
|
|
|
|
|
|
|
|
|
|
|
|
|
|
|
|
|
|
|
– |
|
|
|
|
|
|
|
|
|
|
|
|
|
|
|
|
|
|
|
|
|
|
|
|
|
|
|
|
|
|
|
|
|
|
|
|
|
|
|
– |
|
|
|
|
|
|
|
|
|
|
|
|
|
|
|
|
|
|
|
|
|
|
|
|
|
|
|
|
|
|
|
|
|
|
|
|
|
|
|
|
|
|
|
|
|
|
|
|
|
|
|
|
|
|
|
|
|
Figure 6–2. Functional/Physical Matrix
drawings, three dimensional and solid drawings, and it tracks some technical performance measurements. CAD can provide significant input for virtual modeling and simulations. It also provides a common design database for integrated design developments. Computer-Aided Engineering can provide system requirements and performance analysis in support of trade studies, analysis related to the eight primary functions, and cost analyses. Computer-Aided Systems Engineering can provide automation of technical management analyses and documentation.
Modeling
Modeling techniques allow the physical product to be visualized and evaluated prior to design decisions. Models allow optimization of hardware
and software parameters, permit performance predictions to be made, allow operational sequences to be derived, and permit optimum allocation of functional and performance requirements among the system elements. The traditional logical prototyping used in Design Synthesis is the Schematic Block Diagram.
6.3 SUMMARY POINTS
•Synthesis begins with the output of Functional Analysis and Allocation (the functional architecture). The functional architecture is transformed into a physical architecture by defining physical components needed to perform the functions identified in Functional Analysis and Allocation.
59

Systems Engineering Fundamentals Chapter 6
• Many tools are available to support the |
– Establish traceability of performance |
development of a physical architecture: |
requirements to components (RAS). |
– Define and depict the system concept (CDS), |
• Specifications and the product WBS are derived |
|
from the physical architecture. |
– Define and depict components and their |
|
relationships (SBD), and |
|
60
Chapter 6 |
Design Synthesis |
SUPPLEMENT 6-A
CONCEPT DESCRIPTION
SHEET
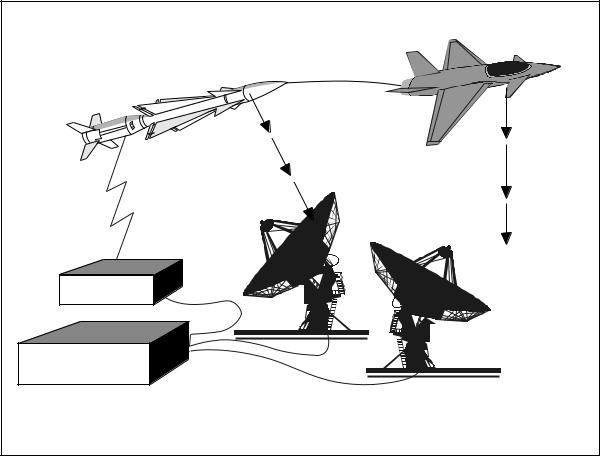
The Concept Description Sheet describes (in textual or graphical form) the technical approach or the design concept, and shows how the system will
be integrated to meet the performance and functional requirements. It is generally used in early concept design to show system concepts.
|
|
Target |
Missile |
|
|
|
Missile |
|
Steering |
Tracking |
Target |
Commands |
Radar |
Tracking |
|
|
Radar |
Radio |
|
|
Computer |
|
|
|
External Command Guidance System |
|
Figure 6-3. Concept Description Sheet Example
61
Systems Engineering Fundamentals |
Chapter 6 |
SUPPLEMENT 6-B
SCHEMATIC BLOCK
DIAGRAMS
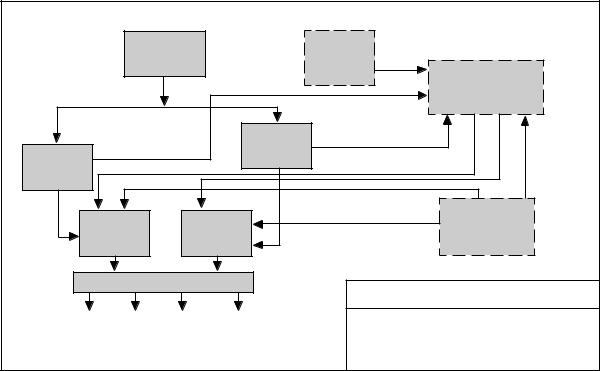
The Schematic Block Diagram (SBD) depicts hardware and software components and their interrelationships. They are developed at successively lower levels as analysis proceeds to define lower-level functions within higher-level requirements. These requirements are further subdivided and allocated using the Requirements Allocation Sheet (RAS). SBDs provide visibility of related system elements, and traceability to the RAS, FFBD, and other system engineering documentation. They describe a solution to the functional and performance requirements established by the functional architecture; show interfaces between the system components and between the system components and other systems or subsystems; support traceability
between components and their functional origin; and provide a valuable tool to enhance configuration control. The SBD is also used to develop Interface Control Documents (ICDs) and provides an overall understanding of system operations.
A simplified SBD, Figure 6-4, shows how components and the connection between them are presented on the diagram. An expanded version is usually developed which displays the detailed functions performed within each component and a detailed depiction of their interrelationships. Expanded SBDs will also identify the WBS numbers associated with the components.
|
|
Inert Gas |
|
Electrical |
|
||
|
|
Pressurization |
|
Power |
|
||
|
|
Subsystem |
|
Subsystem |
Manual Control and |
||
|
|
|
|
|
(Ref) |
||
|
|
|
|
|
|
Display Subsystem |
|
|
|
|
|
Oxidizer Remaining Indication |
(Ref) |
||
|
|
|
|
|
|||
|
|
Inert Gas Pressurant |
|
|
|||
|
|
|
|
Fuel |
Fuel Remaining Indication |
|
|
|
|
|
|
Storage |
|
||
Oxidizer |
|
|
|
|
Attitude and |
||
|
|
|
Subsystem |
|
|||
Storage |
|
|
|
|
Command Signals |
Navigational |
|
Subsystem |
|
|
|
|
Signals |
||
|
|
|
Command Signals |
||||
|
|
|
|
|
|||
|
|
|
|
Command Signals |
|
||
|
|
|
|
|
|
MSRV Guidance |
|
|
Solenoid |
Solenoid |
|
and Navigation |
|||
|
Valve |
|
Valve |
Command Signals |
Subsystem |
||
Oxidizer |
(Oxidizer) |
|
(Fuel) |
|
(Ref) |
||
|
|
|
|
Fuel |
|
|
|
|
Rocket Engine Nozzle Assemblies |
Moon Station Rendezvous Vehicle |
|||||
|
|
|
|
|
|||
|
Pitch |
Roll |
Yaw |
Longitudinal |
Attitude Control and |
||
Thrust |
Thrust |
Thrust |
Velocity |
||||
Maneuvering Subsystem |
|||||||
|
|
|
|
Increments |
|||
Figure 6-4. Schematic Block Diagram Example
62
Chapter 6 |
Design Synthesis |
SUPPLEMENT 6-C
REQUIREMENTS ALLOCATION
SHEET
The RAS initiated in Functional Analysis and Allocation is expanded in Design Synthesis to document the connection between functional requirements and the physical system. It provides traceability between the Functional Analysis and
Allocation and Synthesis activities. It is a major tool in maintaining consistency between functional architectures and the designs that are based on them. (Configuration Item (CI) numbers match the WBS.)
Requirements |
Functional Flow Diagram Title and No. 2.58.4 |
Equipment |
||
Allocation Sheet |
Provide Guidance Compartment Cooling |
Identification |
||
|
|
|
|
|
Function Name |
Functional Performance and |
Facility |
Nomenclature |
CI or Detail |
and No. |
Design Requirements |
Rqmnts |
|
Spec No. |
|
|
|
|
|
2.58.4 Provide |
The temperature in the guidance |
|
Guidance Compart- |
3.54.5 |
Guidance |
compartment must be maintained |
|
ment Cooling |
|
Compartment |
at the initial calibration tempera- |
|
System |
|
Cooling |
ture of +0.2 Deg F. The initial cal- |
|
|
|
|
ibration temperature of the com- |
|
|
|
|
partment will be between 66.5 |
|
|
|
|
and 68.5 Deg F. |
|
|
|
2.58.4.1 Provide |
A storage capacity for 65 gal of |
|
Guidance Compart- |
3.54.5.1 |
Chilled Coolant |
chilled liquid coolant (deionized |
|
ment Coolant |
|
(Primary) |
water) is required. The temperature |
|
Storage Subsystem |
|
|
of the stored coolant must be |
|
|
|
monitored continuously. The stored coolant must be maintained within a temperature range of 40–50 Deg F. for an indefinite period of time. The coolant supplied must be free of obstructive particles 0.5 micron at all times.
Figure 6-5. Requirements Allocation Sheet (Example)
63
Systems Engineering Fundamentals |
Chapter 6 |
64
Chapter 7 |
Verification |
CHAPTER 7
VERIFICATION
7.1 GENERAL
The Verification process confirms that Design Synthesis has resulted in a physical architecture that satisfies the system requirements. Verification represents the intersection of systems engineering and test and evaluation.
Verification Objectives
The objectives of the Verification process include using established criteria to conduct verification of the physical architecture (including software and interfaces) from the lowest level up to the total
system to ensure that cost, schedule, and performance requirements are satisfied with acceptable levels of risk. Further objectives include generating data (to confirm that system, subsystem, and lower level items meet their specification requirements) and validating technologies that will be used in system design solutions. A method to verify each requirement must be established and recorded during requirements analysis and functional allocation activities. (If it can not be verified it can not be a legitimate requirement.) The verification list should have a direct relationship to the requirements allocation sheet and be continually updated to correspond to it.
System Level |
SFR |
SVR |
|
Design Requirements |
|||
|
|
System Level
Design
Item Level |
PDR |
|
Design Requirements |
||
|
|
|
& |
Test |
Subsystems |
|
|
|
||
|
Integrate |
|
|
|
|
|
|
Configuration Items |
|
|
|
|
|
|
Fabricate, |
|
|
|
TRR |
|
|
|
Assemblies |
|
|
|
|
|
Components
CDR
All Design Requirements Complete
SFR = |
System Functional Review |
TRR = |
Test Readiness Review |
PDR = |
Preliminary Design Review |
SVR = |
System Verification Review |
CDR = |
Critical Design Review |
|
|
|
|
|
|
Figure 7-1. Systems Engineering and Verification
65
Systems Engineering Fundamentals |
Chapter 7 |
Verification Activities
System design solutions are verified by the following types of activities:
1.Analysis – the use of mathematical modeling and analytical techniques to predict the compliance of a design to its requirements based on calculated data or data derived from lower level component or subsystem testing. It is generally used when a physical prototype or product is not available or not cost effective. Analysis includes the use of both modeling and simulation which is covered in some detail in chapter 13,
2.Inspection – the visual examination of the system, component, or subsystem. It is generally used to verify physical design features or specific manufacturer identification,
3.Demonstration – the use of system, subsystem, or component operation to show that a requirement can be achieved by the system. It is generally used for a basic confirmation of performance capability and is differentiated from testing by the lack of detailed data gathering, or
4.Test – the use of system, subsystem, or component operation to obtain detailed data to verify performance or to provide sufficient information to verify performance through further analysis. Testing is the detailed quantifying method of verification, and as described later in this chapter, it is ultimately required in order to verify the system design.
Choice of verification methods must be considered an area of potential risk. Use of inappropriate methods can lead to inaccurate verification. Required defining characteristics, such as key performance parameters (KPPs) are verified by demonstration and/or test. Where total verification by test is not feasible, testing is used to verify key characteristics and assumptions used in design analysis or simulation. Validated models and simulation tools are included as analytical verification methods that complement other methods. The focus and nature of verification activities change
as designs progress from concept to detailed designs to physical products.
During earlier design stages, verification focuses on proof of concept for system, subsystem and component levels. During later stages, as the product definition effort proceeds, the focus turns to verifying that the system meets the customer requirements. As shown by Figure 7-1, design is a top-down process while the Verification activity is a bottom-up process. Components will be fabricated and tested prior to the subsystems. Subsystems will be fabricated and tested prior to the completed system.
Performance Verification
Performance requirements must be objectively verifiable, i.e., the requirement must be measurable. Where appropriate, Technical Performance Measurements (TPM) and other management metrics are used to provide insight on progress toward meeting performance goals and requirements. IEEE Standard P1220 provides a structure for Verification activity. As shown in Figure 7-2 the structure is comprehensive and provides a good starting point for Verification planning.
7.2 DOD TEST AND EVALUATION
DoD Test and Evaluation (T&E) policies and procedures directly support the system engineering process of Verification. Testing is the means by which objective judgments are made regarding the extent to which the system meets, exceeds, or fails to meet stated objectives. The purpose of evaluation is to review, analyze, and assess data obtained from testing and other means to aid in making systematic decisions. The purpose of DoD T&E is to verify technical performance, operational effectiveness, operational suitability; and it provides essential information in support of decision making.
Common Types of T&E in DoD
T&E policy requires developmental tests. They confirm that technical requirements have been
66