


7
Tumour growth and response to radiation
DANIEL ZIPS
7.1 |
Tumour growth |
78 |
Key points |
97 |
7.2 |
Tumour response to radiation |
83 |
Bibliography |
98 |
7.3 |
Factors influencing local tumour control |
92 |
Further reading |
101 |
Acknowledgement |
97 |
|
|
|
|
|
|
|
|
7.1 TUMOUR GROWTH
Introduction
The growth of primary and metastatic tumours determines the clinical course of malignant disease. Tumour growth results from a disturbed tissue homeostasis, driven by functional capabilities acquired during tumourigenesis. These acquired capabilities include self-sufficiency in growth signals, insensitivity to anti-growth signals, limitless proliferative potential, evading apoptosis, and sustained angiogenesis (Hanahan and Weinberg, 2000). The speed of growth, or the growth rate, varies considerably between different tumours because of differences in cell proliferation and cell loss.
Measuring the size and growth rate of tumours
Under experimental conditions, such as with transplanted tumour models, the size of the tumour can be precisely and repeatedly measured using simple callipers. In the clinical situation, precision and feasibility of tumour size measurement depend on the anatomical site and the
imaging technology. For example, only lesions of 5–10 mm or larger in diameter can be detected in the lung on chest radiographs. Advanced spiral computed tomography (CT) allows detection of nodules as small as 3 mm in diameter. From the dimensions of the lesion, the tumour volume (V) can be calculated:
Vπ length width height
6
For experimental tumour models, a calibration curve can be obtained by plotting V against the weight of excised tumours (Steel, 1977). This procedure allows for uncertainties of external tumour volume determination resulting from, for example, irregular volumes and skin thickness.
The tumour burden and tumour growth rate can also be estimated by determination of biochemical tumour markers such as prostate specific antigen (PSA) in patients with prostate cancer (Schmid et al., 1993). Serial measurement of the tumour volume permits estimation of the growth rate. The tumour volume doubling time (VDT), for example, can be calculated by the time required for the tumour to double its volume. In untreated experimental tumours, volume doubling times have been found to be in the same range as the
Tumour growth 79
|
|
|
|
|
|
|
|
|
|
|
|
|
|
|
|
|
|
|
|
|
Clinically |
|
||||||
|
|
|
|
|
|
|
|
|
|
|
|
|
|
|
|
|
|
|
observable |
|
||||||||
|
|
|
|
|
|
|
‘Silent’ interval |
|
|
|
|
|
|
phase |
|
|
|
|
||||||||||
|
109 |
|
|
|
|
|
|
|
|
|
|
|
|
|
|
|
|
|
|
|
|
|
|
|
|
|
1kg |
|
|
|
|
|
|
|
|
|
|
|
|
|
|
|
|
|
|
|
|
|
|
|
|
|
|
|
|
||
|
|
|
|
|
|
|
|
|
|
|
|
|
|
|
|
|
|
|
|
|
|
|
|
|
|
|
||
Cells |
|
|
|
|
|
|
|
|
|
|
|
|
|
|
|
|
|
|
|
|
|
|
|
|
|
1g |
Weight |
|
|
|
|
|
|
|
|
|
|
|
|
|
|
|
|
|
|
|
|
|
|
|
|
|
|
||||
106 |
|
|
|
|
|
|
|
|
|
|
|
|
|
|
|
|
|
|
|
|
|
|
|
|
|
1mg |
||
|
|
|
|
|
|
|
|
|
|
|
|
|
|
|
|
|
|
|
|
|
|
|
|
|
|
|
||
|
103 |
|
|
|
|
|
|
|
|
|
|
|
|
|
|
|
|
|
|
|
|
|
|
|
|
|
1 |
|
|
|
|
|
|
|
|
|
|
|
|
|
|
|
|
|
|
|
|
|
|
|
|
|
|
|
|
||
|
1 |
|
|
|
|
|
|
|
|
|
|
|
|
|
|
|
|
|
|
|
|
|
|
|
|
|
10 g |
|
|
0 |
5 |
10 |
15 |
20 |
25 |
30 |
35 |
40 |
|
||||||||||||||||||
Doublings
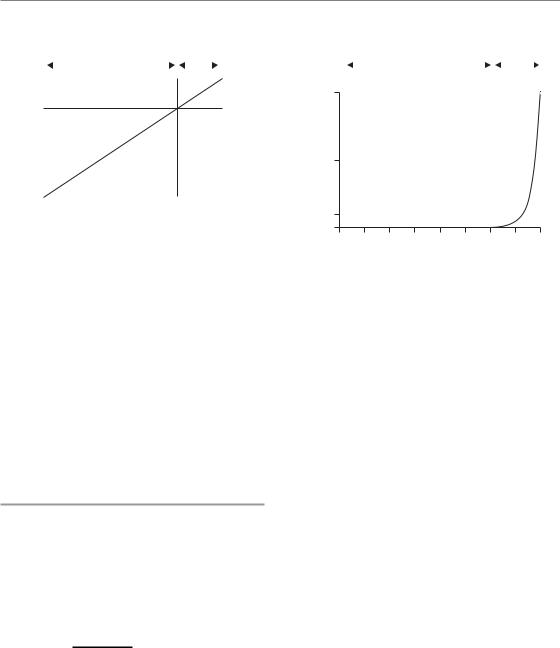
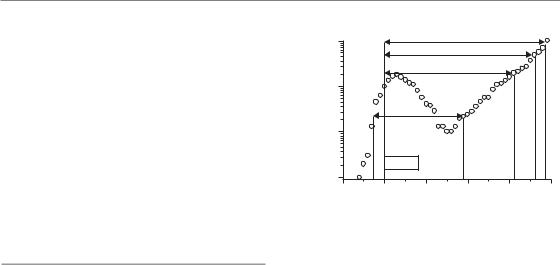
Figure 7.1 Relationship between the number of doublings from a single cell and the number of resulting cells in a tumour. To calculate the tumour weight, a cell number of 109 per gram was assumed. The clinically observable phase represents a minor part in the history of the tumour. Tumour weight is plotted on a logarithmic scale. If the doubling time is constant, a straight line indicates exponential tumour growth.
doubling times of tumour cell number and clonogenic tumour cell number (Jung et al., 1990).
Exponential and non-exponential growth
Starting from one cell, each cell division produces two offspring resulting in 2, 4, 8, 16, 32, etc. cells after subsequent cycles of cell division. Accordingly this results in an exponential increase in cell number and volume with time, which can be expressed as:
time ln 2
V exp VDT
Figure 7.1 illustrates that the majority of cell doublings take place before a tumour becomes detectable, which, in most clinical situations, is when the cell number approaches about 109. This cell number is equivalent to a tumour weight of about 1 g and a volume of about 1 cm3. Exponential growth implies that, under constant conditions, the logarithm of tumour volume increases linearly
|
Clinically |
||
|
observable |
||
‘Silent’ interval |
|
phase |
|
|
|
|
|
|
1000 |
(g) |
|
Weight |
500 |
|
100
10
0 |
5 |
10 |
15 |
20 |
25 |
30 |
35 |
40 |
Doublings
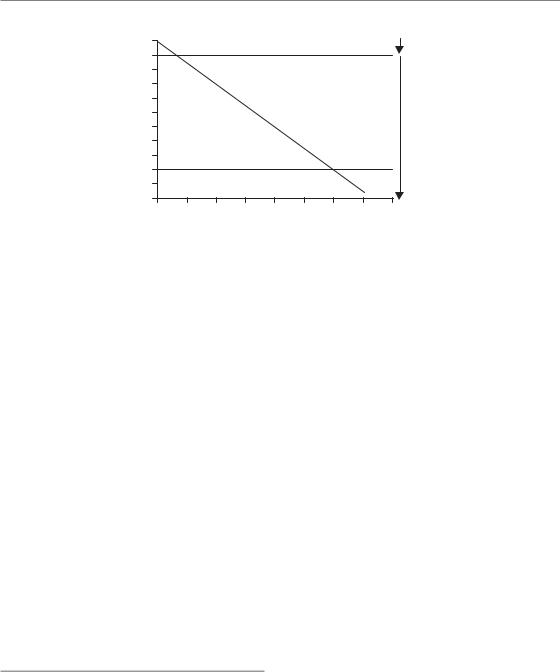
Figure 7.2 The same data as used for Fig. 7.1 but tumour weight is plotted on a linear scale. This may lead to the erroneous impression that tumour growth accelerates during the clinically observable phase.
with time. This can be seen easily from tumour growth curves if volume or weight is plotted on a logarithmic scale and therefore tumour growth is conventionally plotted in this way. Consequently, deviations from exponential growth, variability in the growth rate among different tumours and effects of treatment can be easily visualized. In contrast, plotting tumour volume on a linear scale might lead to the erroneous impression that growth accelerates with increasing volume (Fig. 7.2). Instead, the VDT actually tends to decrease with increasing volume. This effect in large tumours is caused by impairment in oxygen and nutrient supply resulting in a lower proportion of cycling cells, a prolongation of cell cycle, and/or a higher cell death rate. Such progressively slowing tumour growth has often been described by the Gompertz equation:
|
|
A |
|
|
V V exp |
|
(1 e Bt ) |
||
|
||||
0 |
|
B |
|
|
|
|
|||
|
||||
Here V0 is the volume at the arbitrary time zero and A and B are parameters that determine the
growth rate. At very early time intervals (tsmall) the equation becomes exponential:
V V0 exp(A.t)

80 Tumour growth and response to radiation
Table 7.1 Volume doubling times (VDTs) for human tumours taken from a review of early data on the growth rate of human tumours
|
Number of tumours |
Mean VDT* |
Confidence |
Site and histology |
measured |
(days) |
limits (days) |
|
|
|
|
Lung metastases |
|
|
|
Colon–rectum, adenocarcinoma |
56 |
95 |
84–107 |
Breast, adenocarcinoma |
44 |
74 |
56–98 |
Kidney, adenocarcinoma |
14 |
60 |
37–98 |
Thyroid, adenocarcinoma |
16 |
67 |
44–103 |
Uterus, adenocarcinoma |
15 |
78 |
55–111 |
Head and neck, squamous cell |
|
|
|
carcinoma |
27 |
57 |
43–75 |
Fibrosarcoma |
28 |
65 |
46–93 |
Osteosarcoma |
34 |
30 |
24–38 |
Teratoma |
80 |
30 |
25–36 |
Superficial metastases |
|
|
|
Breast carcinoma |
66 |
19 |
16–24 |
Primary tumours |
|
|
|
Lung, adenocarcinoma |
64 |
148 |
121–181 |
Lung, squamous cell carcinoma |
85 |
85 |
75–95 |
Lung, undifferentiated |
55 |
79 |
67–93 |
Colon–rectum |
19 |
632 |
426–938 |
Breast |
17 |
96 |
68–134 |
*Geometric mean.
Data from Steel (1977).
At long time intervals exp( B.t) becomes small compared with 1.0 and the volume tends to a maximum value of V0 exp(A/B). The Gompertz equation is not a unique description of such growth curves. For a fuller discussion see Steel (1977).
The volume doubling time of human tumours shows a considerable variability between tumours of different histology as well as between primary and metastatic lesions (Steel, 1977) (Table 7.1). For example, primary lung tumours double their volume every 2–6 months whereas colorectal carcinomas have been found to grow at a much slower rate with a mean VDT of about 2 years. In general, metastatic lesions tend to grow faster than primary tumours. In contrast to tumours in patients, model tumours in experimental animals usually grow much faster with doubling times in the order of days.
The growth fraction and cell cycle time in tumours
The net growth rate, or the VDT, of tumours results from the balance of cell production and cell loss. Cell production is determined by the proportion of cells in the compartment of actively dividing cells (growth fraction, GF) and the time required to complete the cell cycle (cell-cycle time, TC). Cells from the GF compartment move through the cell cycle and are distinguished from cells outside the cell cycle. Cells outside the cell cycle (in G0 phase) may enter the cell cycle (recruitment of temporarily resting cells) or remain permanently in the G0 phase (sterile or differentiated cells). Taking these parameters together, tumours grow fast if the growth fraction is high, the cell-cycle time is short, or the cell loss is low.

Tumour growth 81
Table 7.2 Growth fractions determined by Ki67 labelling for different human tumour types
|
Mean/Median |
Ki67 LI |
|
Tumour type and site |
Ki67 LI (%) |
(% range) |
Reference |
|
|
|
|
Prostate |
8.5 |
1–28.4 |
Taftachi et al. (2005) |
Central nervous system: |
|
|
|
Meningeoma |
4.4 |
0–58 |
Roser et al. (2004) |
Astrocytoma |
21.5 |
0–47.3 |
Rautiainen et al. (1998) |
Head and neck |
27.8 |
8.2–80.8 |
Roland et al. (1994) |
Colorectal |
37.2 |
18.9–71.4 |
Lanza et al. (1990) |
Breast |
31.6 |
0–99 |
Thor et al. (1999) |
Lung (non-small cell) |
36.7 |
0–93 |
Hommura et al. (2000) |
Pancreas |
29.7 |
0.5–82.1 |
Linder et al. (1997) |
Soft-tissue sarcoma |
12 |
1–85 |
Jensen et al. (1998) |
Renal cell carcinoma |
11 |
0–43 |
Haitel et al. (1997) |
Bladder |
35 |
3–55 |
Hoskin et al. (2004) |
Oesophagus |
33 |
6–95 |
Sarbia et al. (1996) |
LI, labelling index.
The GF can be measured in tumour biopsies, for example by immunohistochemistry, using a monoclonal antibody against the cell-cycle-specific protein Ki67. Human tumours vary considerably in their Ki67 labelling index (i.e. the ratio of cells with positive staining for the Ki67 protein divided by the total cell number; Table 7.2). Clinical studies indicate a prognostic value for Ki67-labelling in some tumour types including breast cancer, soft-tissue tumours and lung cancer (Brown and Gatter, 2002). Antibodies against different cell- cycle-specific proteins also allow determination of the fractions of cells within the various phases of the cell cycle.
Determination of cell-cycle kinetics in tissues is more difficult than measuring the GF. In the past, pulsed or continuous infusion of tritiated thymidine, a radiolabelled nucleoside incorporated into the DNA during the S phase, has been widely used to estimate the duration of the cell cycle (TC) by the per cent labelled mitosis method (Potten et al., 1985). With this method the TC for carcinomas was found to be widely scattered but averaged around 2 days (Table 7.3).
It is now possible to rapidly determine the S-phase fraction and the duration of the S phase from a single biopsy using a technique developed by Begg et al. (1985). In this method, thymidine
Table 7.3 Cell cycle time (TC) for different human tumours determined by the per cent labelled mitosis method
|
Number of |
|
|
|
tumours |
Mean TC* |
|
Histology |
measured |
(hours) |
Range |
|
|
|
|
Squamous cell |
7 |
43.5 |
14–217 |
carcinoma |
|
|
|
Adenocarcinoma |
5 |
34.9 |
25–45 |
Melanoma |
4 |
102 |
76–144 |
*Geometric mean.
Data taken from Malaise et al. (1973).
analogues iododeoxyuridine (IdUrd) or bromodeoxyuridine (BrdUrd) are injected into a patient and are subsequently incorporated into the newly synthesized DNA in S-phase cells. A few hours after injection, a tumour biopsy is taken from which a single-cell suspension is prepared. This is stained with both a DNA-specific dye and a fluo- rescent-labelled antibody against BrdUrd or IdUrd. Using flow cytometry, the fraction of cells in S phase (labelling index, LI) and the duration of the S phase (TS) can be determined. Typical values
82 Tumour growth and response to radiation
Table 7.4 Cell kinetic parameters of human tumours derived from in vivo labelling with iododeoxyuridine (IdUrd) or bromodeoxyuridine (BrdUrd) and measured by flow cytometry
Site |
Number of patients |
LI (%) |
TS (hours) |
Tpot (days) |
|||
Head and neck |
712 |
9.6 |
(6.8–20.0) |
11.9 (8.8–16.1) |
4.5 |
(1.8–5.9) |
|
Central nervous system |
193 |
2.6 |
(2.1–3.0) |
10.1 |
(4.5–16.7) |
34.3 |
(5.4–63.2) |
Upper intestinal |
183 |
10.5 |
(4.9–19.0) |
13.5 |
(9.8–17.2) |
5.8 |
(4.3–9.8) |
Colorectal |
345 |
13.1 |
(9.0–21.0) |
15.3 |
(13.1–20.0) |
4.0 |
(3.3–4.5) |
Breast |
159 |
3.7 |
(3.2–4.2) |
10.4 (8.7–12.0) |
10.4 (8.2–12.5) |
||
Ovarian |
55 |
6.7 |
|
14.7 |
|
12.5 |
|
Cervix |
159 |
9.8 |
|
12.8 |
|
4.8 |
(4.0–5.5) |
Melanoma |
24 |
4.2 |
|
10.7 |
|
7.2 |
|
Haematological |
106 |
13.3 |
(6.1–27.7) |
14.6 |
(12.1–16.2) |
9.6 |
(2.3–18.1) |
Bladder |
19 |
2.5 |
|
6.2 |
|
17.1 |
|
Renal cell carcinoma |
2 |
4.3 |
|
9.5 |
|
11.3 |
|
Prostate |
5 |
1.4 |
|
11.7 |
|
28.0 |
|
Fraction of cells in S phase (LI), duration of S phase (TS) and potential doubling time (Tpot) were taken from Haustermans et al. (1997) and Rew and Wilson (2000). Ranges (in parenthesis) represent variations in median values between studies; ranges for individual tumours are considerably larger.
for LI and TS are shown in Table 7.4. While in most tumours the S-phase duration is about 12 hours, or approximately 25 per cent of TC, the fraction of cells in the S phase varies widely between the different tumours.
Developments in molecular imaging, such as with radiolabelled fluorothymidine (18F-FLT), may allow non-invasive assessment of tumour proliferation in vivo. This radiolabel is not incorporated into the DNA but it is phosphorylated by thymidine kinases (TK). While TK2 is expressed constitutively, TK1 activity is specifically regulated during the S phase. As a result, metabolites of radiolabelled 18F-FLT (mono-, diand tri-phosphates) are found preferentially in S-phase cells. The 18F tracer activity can then be detected by positron emission tomography (PET).
The potential doubling time (Tpot)
The potential doubling time (Tpot) of a tumour is defined as the cell doubling time without any cell loss (Steel, 1977). The Tpot is determined by the growth fraction (GF) and the cell-cycle time (TC):
Tpot TC/GF
Using thymidine analogues and flow cytometry,
the Tpot can be estimated by the duration of the S phase (TS) and by the fraction of cells within that
phase (LI) (Begg et al., 1985; Terry et al., 1991):
Tpot λTS/LI
where λ is a parameter that corrects for the nonrectangular age distribution of growing cell populations. This parameter usually lies between 0.7 and 1.0. Using this method, Tpot for human tumours from different sites was found to vary between 4 days and 34 days (Table 7.4). The differences in Tpot are mainly attributed to the variability in LI between tumours whereas TS appears to be relatively similar between tumours, with a value averaging about 12 hours.
To test the hypothesis that pretreatment Tpot reflects the effective doubling time during fractionated radiotherapy and thereby correlates with the repopulation rate of clonogenic tumour cells, treatment response of 476 patients with head and neck cancer was correlated with Tpot and LI (Begg et al., 1999). However, multivariate analysis
revealed that neither Tpot, nor LI, nor TS were statistically significant determinants of local tumour
control. Thus, in this large multicentre study, pretreatment cell kinetic parameters measured by

Tumour response to radiation 83
Table 7.5 Calculation of cell loss factors (CLFs) for human tumours based on labelling with radiolabelled thymidine or thymidine analogues and volume doubling times (VDTs) in separate series
Site |
LI (%) |
Tpot (days) |
VDT (days) |
CLF (%) |
Undifferentiated bronchus carcinoma*,1 |
19.0 |
2.5 |
90 |
97 |
Sarcoma*,1 |
2.0 |
23.3 |
39 |
40 |
Childhood tumours*,1 |
13.0 |
3.6 |
20 |
82 |
Lymphoma*,1 |
3.0 |
15.6 |
22 |
29 |
Head and neck**,2 |
9.6 |
4.1 |
45 |
91 |
Colorectal**,2 |
13.1 |
3.9 |
90 |
96 |
Melanoma**,2 |
4.2 |
8.5 |
52 |
84 |
Breast**,2,3 |
3.7 |
9.4 |
82 |
89 |
Prostate**2,4 |
1.4 |
28.0 |
1100 |
97 |
*,**Labelling with radiolabelled thymidine or thymidine analogues, respectively. 1From Steel (1977), calculations assume TS 14 hours, λ 0.8.
2Fraction of cells in S phase (LI) and potential doubling time (Tpot) from Haustermans et al. (1997) and Rew and Wilson (2000); calculations assume λ 0.8 (Steel, 1977).
3VDT values for pulmonary metastases from Spratt et al. (1996).
4VDT from PSA doubling times from Schmid et al. (1993), Fowler et al. (1994) and Lee et al. (1995).
thymidine analogues and flow cytometry failed to predict outcome after radiotherapy.
Cell loss in tumours
Taking typical values for human tumours (e.g. a
GF of 40 per cent and a TC of 2 days) results in Tpot of 5 days. This time is obviously much shorter
than the observed VDT of human tumours, which is usually in the order of months. The difference between VDT and Tpot is explained by the high rate of cell loss in malignant tumours. The cell loss factor (CLF) can be calculated from:
T
CLF 1 pot
VDT
Taking a VDT of 3 months and a Tpot of 5 days, the cell loss factor would be 94 per cent. Examples
of cell loss factors for human tumours are listed in Table 7.5. The high cell loss factors indicate that the vast majority of newly produced cells are lost from the growth fraction, thus explaining the slow growth rate of many tumours. Cells are lost from the proliferative compartment when they enter the non-proliferative compartment (G0), for example by differentiation. The same occurs when
they physically disappear from the viable tumour compartment by necrosis, apoptosis, metastasis, and exfoliation or shedding. In solid tumours, necrotic cell loss, because of insufficient oxygen and nutrient supply by the pathological tumour vasculature, appears to represent a major factor.
Transplanted tumours in experimental animals grow much faster than tumours in human patients. While TS is comparable with tumours in patients, experimental tumour models often exhibit a higher LI, shorter Tpot, and a lower cell loss factor. Cell kinetic data obtained using these model systems must therefore be interpreted with caution in terms of their clinical relevance.
7.2 TUMOUR RESPONSE TO RADIATION
Introduction
Radiation effects on tumours under clinical as well as experimental conditions can be measured by different endpoints, including local tumour control, tumour regrowth delay and tumour regression. Local tumour control is the aim of curative radiotherapy. Improvements in local tumour control after radiotherapy have been shown, in many
84 Tumour growth and response to radiation
|
|
109 |
|
|
|
|
|
|
|
Partial |
|
clonogenic cells per tumour |
108 |
|
|
|
|
|
|
|
|
|
|
|
|
|
|
|
|
response |
||
|
107 |
|
|
|
|
|
|
|
||
Number of surviving |
|
|
|
|
|
|
|
|
||
106 |
|
|
|
|
|
|
|
|
||
105 |
|
|
|
|
|
|
|
|
||
104 |
|
|
|
|
|
|
|
Complete |
||
103 |
|
|
|
|
|
|
|
response |
||
102 |
|
|
|
|
|
|
|
|
||
10 |
|
|
|
|
|
|
|
|
||
1 |
|
|
|
|
|
|
|
|
||
|
|
|
Local tumour control |
|
|
|||||
|
|
|
|
|
|
|
||||
|
|
0 |
10 |
20 |
30 |
40 |
50 |
60 |
70 |
80 |
|
|
|
|
|
Radiation dose |
|
|
|
||
Figure 7.3 Relationship between clonogenic cell survival, radiation dose and different endpoints to assay tumour response, assuming a tumour consisting of 109 clonogenic cells and a surviving fraction after 2 Gy of 50 per cent.
clinical trials, to translate into the prolonged survival of cancer patients. Thus, local tumour control is conceptually the preferable endpoint for both clinical and experimental investigations on improving radiotherapy. A tumour is locally controlled when all of its clonogenic cells (i.e. cells with the capacity to proliferate and to cause recurrence after radiotherapy) have been inactivated. The probability of achieving local tumour control is radiation dose dependent and directly related to the number of surviving clonogenic tumour cells (see Chapter 5, Section 5.2). Tumour regression is a non-specific endpoint to assay radiation response. The tumour regrowth delay assay is widely used in radiobiological experiments. Tumour regrowth delay increases with radiation dose but, because of inherent methodological limitations, it is difficult or impossible to accurately estimate cell kill.
Clonogenic cell survival after irradiation
Radiotherapy is highly effective in killing clonogenic tumour cells. The quantitative relationship between radiation dose, inactivation of clonogenic cells and local tumour control is well established under clinical as well as experimental conditions (Munro and Gilbert, 1961; Wheldon et al., 1977;
Trott et al., 1984; Rofstad et al., 1986; Suit et al.,
1987; Hill and Milas, 1989; Baumann et al., 1990;
Gerweck et al., 1994; Krause et al., 2006). In fractionated radiotherapy, it has been demonstrated that the logarithm of surviving clonogenic tumour cells decreases linearly with total radiation dose. If the radiation dose is high enough to sterilize all cells capable of causing a recurrence, then local tumour control is achieved. This relationship is illustrated in Fig. 7.3, which shows a theoretical clonogenic survival curve for the fractionated irradiation of a model tumour. This tumour has a diameter of about 3 cm, consisting of 1010 tumour cells with a clonogenic fraction of 10 per cent (i.e. the tumour consists of 109 clonogenic tumour cells). Assuming an intermediate radiation sensitivity, each fraction of 2 Gy inactivates 50 per cent of the clonogenic cells. In other words, after a dose of 2 Gy 50 per cent of the clonogenic cells survive, after 4 Gy 25 per cent, after 6 Gy 12.5 per cent, and so on. This results in a linear decrease of the logarithm of surviving clonogen fraction as the dose increases and is depicted by the straight line in the log-linear plot in Fig. 7.3. For this example, at doses higher than 60 Gy the number of surviving cells per tumour is less than one and local tumour control can be achieved. Clearly, this is a simplification because it neglects, for example, the possibility of changing radiosensitivity (maybe owing to changes in tumour oxygenation) and of repopulation during fractionated radiotherapy (see Chapters 10 and 15). However, it demonstrates that response parameters such as partial or complete response, which are often used

Tumour response to radiation 85
as clinical descriptors, are not robust endpoints for evaluating curative radiotherapy. It is obvious that a partial response is a complete failure of the treatment because the vast majority of clonogenic cells are presumably still alive. Even if we are unable to detect the tumour with clinical imaging (in a complete response) a large number of clonogenic tumour cells may have survived the treatment and may lead to a recurrence. Thus, in studies both on patients and on experimental animals, only by following up treatment for long enough to detect all regrowing tumours can it be precisely determined whether the given treatment was effective in sterilizing all clonogenic tumour cells.
Local tumour control
If not a single tumour but a group of tumours (or patients) is considered, the local tumour control probability (TCP) as a function of radiation dose can be described statistically by a Poisson distribution of the number of surviving clonogenic tumour cells (Munro and Gilbert, 1961). It describes the random distribution of radiation-induced cell kill within a population of clonogenic cells (see Chapter 5). As an illustration, one might imagine that a given radiation dose causes a certain amount of ‘lethal hits’ randomly distributed within the cell population. Some cells will receive one ‘lethal hit’ and will subsequently die. Other cells will receive two or more ‘lethal hits’ and will also die. However, some cells will not be hit, will therefore survive and subsequently cause a local failure. According to Poisson statistics, a radiation dose sufficient to inflict on average one ‘lethal hit’ to each clonogenic cell in a tumour (number of ‘lethal hits’ per cell, m, 1) will result in 37 per cent surviving clonogenic cells. The surviving fraction (SF) can be expressed as:
SF exp( m)
and the number of surviving clonogenic tumour cells (N) is:
N N0 SF
where N0 represents the initial number of clonogens. The TCP depends on the number of surviving clonogenic cells (N) and can be calculated as:
TCP exp( N) exp( N0SF)
1 |
|
|
|
1 |
2 |
2 |
3 |
1 |
2 |
1 |
|
|
1 |
|
2 |
|
1 |
1 |
1 |
2 |
|
4 |
1 |
1 |
|
1 |
|
3 |
1 |
|
2 |
1 |
1 |
|
|
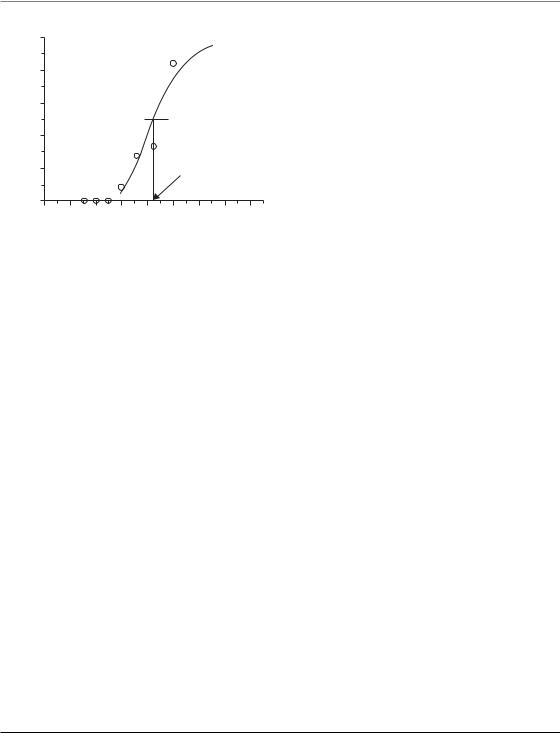
Figure 7.4 A model tumour consisting of 36 clonogenic tumour cells (each square represents one clonogenic cell) after irradiation with a dose sufficient to inflict an average of one ‘lethal hit’ per clonogenic cell. Owing to random distribution of the ‘lethal hits’ among the tumour, some clonogenic cells received one (1), two (2), three (3) or four (4) lethal hits. These cells subsequently die (grey shadow). According to Poisson statistics (SF exp ( m), see text) 37 per cent of the clonogenic cells (i.e. a total of 13 cells (received no ‘lethal hit’ and survived white background). The tumour control probability (TCP) after this ‘treatment’ can be calculated as TCP exp ( 13) 2.3 10 7. This means that only 1 out of 23 million tumours will be locally controlled in this situation. In Table 7.6 and
Fig. 7.5, the dose effects on surviving cell fraction (SF) and TCP are illustrated.
To illustrate the relationship between radiation dose, number of surviving clonogenic cells and TCP described by Poisson statistics, a model tumour consisting of 36 clonogenic cells is ‘treated’ (Fig. 7.4, Table 7.6). If the TCP is plotted as a function of dose (Fig. 7.5) the resulting curve shows the typical sigmoid shape. The sigmoid shape of dose–response curves for local tumour control is supported by clinical observations and has been demonstrated in numerous experiments. Application of Poisson statistics implies that, in a group of tumours with, on average, one surviving clonogenic cell per tumour, the local TCP equals 37 per cent. A TCP of 50 per cent results if, on average, 0.7 clonogenic tumour cells survive irradiation. Statistical models other than the Poisson equation, such as the logistic and probit equations, have also been used to describe dose–response relationships for local tumour control empirically (see Chapter 5, Section 5.2).

86 Tumour growth and response to radiation
Table 7.6 Relationship between radiation dose, fraction of surviving clonogenic tumour cells (SF) and local tumour control probability (TCP) according to Poisson statistics for the ‘treatment’ of a model tumour consisting of 36 clonogenic tumour cells.
|
|
|
Number of surviving |
|
Radiation dose |
Number of ‘lethal hits’ |
|
clonogenic tumour cells |
|
(relative units) |
per clonogenic cell (m) |
SF exp( m) (%) |
(N SF 36) |
TCP exp( N) (%) |
1 |
36/36 1 |
37 |
13 |
0.0001 |
2 |
72/36 2 |
14 |
5 |
1 |
3 |
108/36 3 |
5 |
2 |
17 |
4 |
144/36 4 |
1.8 |
0.7 |
52 |
5 |
180/36 5 |
0.7 |
0.2 |
78 |
6 |
216/36 6 |
0.25 |
0.09 |
91 |
7 |
252/36 7 |
0.09 |
0.03 |
97 |
8 |
288/36 8 |
0.03 |
0.01 |
99 |
|
|
|
|
|
Number of surviving clonogens
100
10
1
0.1
0.01
0.001
0 |
1 |
2 |
3 |
4 |
5 |
6 |
7 |
8 |
TCP (%)
100
80
60
40
20
0
0 |
1 |
2 |
3 |
4 |
5 |
6 |
7 |
8 |
(a) |
Dose (relative units) |
(b) |
Dose (relative units) |
Figure 7.5 |
Illustration of the ‘treatment effects’ on the model tumour consisting of 36 clonogenic cells (compare |
||
Fig. 7.4 and Table 7.6). Values for the number of surviving clonogens and tumour control probability (TCP) were taken from Table 7.6.
The quantitative relationship between radiation dose, surviving fraction of clonogenic tumour cells and TCP forms the biological basis of local tumour control as a functional assay of clonogenic tumour cell survival after irradiation (Munro and Gilbert, 1961; Wheldon et al., 1977; Trott et al., 1984; Rofstad et al., 1986; Suit et al., 1987; Hill and Milas, 1989; Baumann et al., 1990; Gerweck et al., 1994). In such studies, groups of transplanted tumours are irradiated with varying doses and during follow-up it is recorded whether a tumour has regrown (recurrence) or not (local control). In contrast to tumour volume measurement, which requires considerable training and is susceptible to interobserver variability, the scoring of local
recurrence or local control is simple and makes the tumour control assay very robust (for comparison with other assays see Table 7.7). The rates of local tumour control at each dose level (number of controlled tumours divided by number of total tumours) are obtained and further analysed to calculate characteristic points on the dose–response curve. In the main, the TCD50 (i.e. the radiation dose required to control 50 per cent of the tumours) is reported (the local tumour control assay is therefore often called a TCD50 assay). Results from a typical experiment are shown in Fig. 7.6 and Table 7.8 in which FaDu human squamous cell carcinomas were transplanted into nude mice and irradiated with 30 fractions over 6 weeks.

Table 7.7 Comparison of different experimental assays to measure radiation effects on tumours
Assay |
Advantages |
Disadvantages |
Comment |
|
|
|
|
Local tumour |
Depends only on inactivation |
Labour intensive and |
Most important assay |
control assay |
of clonogenic cells |
costly |
for curative |
(TCD50 assay) |
All clonogenic cells are assayed |
Sensitive to residual |
Effects of radiotherapy |
|
Response evaluated in situ |
immune response of |
|
|
(i.e. in the original environment) |
the host |
|
|
TCD50 values can be easily |
|
|
|
obtained for comparisons |
|
|
|
with other tumour models or |
|
|
|
different treatments |
|
|
|
Data good for radiobiological |
|
|
|
modelling |
|
|
|
Endpoint scoring very simple |
|
|
Excision assays |
Direct measurement of clonogen |
Response not measured in |
Standardized methods |
|
survival |
the original environment |
to assay clonogenic |
|
Not sensitive to host immune |
Sensitive to effects from |
survival but more |
|
reaction (in vivo/in vitro assay) |
single-cell preparation |
limitations than the TCD50 |
|
less costly and labour intensive |
Cannot assess clonogen |
assay |
|
than TCD50 assay |
survival at low levels of |
|
|
|
surviving fractions (lung |
|
|
|
colony, in vitro/in vivo) |
|
|
|
Effects of prolonged |
|
|
|
treatments difficult or |
|
|
|
impossible to assess |
|
Tumour regrowth |
Response evaluated in situ |
delay assay |
(i.e. in the original environment) |
|
Less costly and labour-intensive |
|
than TCD50 assay |
|
Specific tumour growth delay |
|
and the use of multiple radiation |
|
dose levels may allow conclusions |
|
on clonogenic cell kill and |
|
comparisons between different |
|
tumour models |
Reflects cell kill of the |
Standardized but |
mass of non-clonogenic |
non-specific endpoint, |
and clonogenic cells, |
limited value for |
proliferation, stromal |
investigations of |
reaction, inflammatory |
curative effects of |
response. Measures the |
radiotherapy |
effect only in a small |
|
range of tumour cell |
|
numbers |
|
Does not necessarily |
|
reflect inactivation of |
|
clonogenic tumour cells |
|
Sensitive to experimental |
|
manoeuvres without |
|
effects on tumour cell kill |
|
Tumour regression |
Response is evaluated in |
Reflects cell kill, |
Highly unspecific |
|
situ (i.e. in the original |
proliferation, resorption of |
endpoint, not suitable |
|
environment) |
necrosis, stromal reaction, |
for investigations |
|
Less costly and labour intensive |
inflammatory response, |
of curative effects of |
|
than other assays |
oedema |
radiotherapy |
|
|
Measures the effect only |
|
|
|
in a small range of tumour |
|
|
|
cell numbers. Sensitive to |
|
|
|
experimental manoeuvres |
|
|
|
without effects on tumour |
|
|
|
cell kill |
|
TCD50, dose required to control 50 per cent of the tumours.
88 Tumour growth and response to radiation
|
100 |
|
|
|
|
|
|
|
|
|
80 |
|
|
|
|
|
|
|
|
(%) |
60 |
|
|
|
|
|
|
|
|
|
|
|
|
|
|
|
|
|
|
TCP |
40 |
|
|
|
|
|
|
|
|
|
|
|
|
|
|
|
|
|
|
|
20 |
|
|
|
|
TCD50 |
|
||
|
0 |
|
|
|
|
|
|
|
|
|
0 |
20 |
40 |
60 |
80 |
100 |
120 |
140 |
160 |
|
|
|
|
|
Dose (Gy) |
|
|
|
|
Figure 7.6 Dose–response curve for local tumour control of FaDu human squamous cell carcinoma growing in nude mice. Tumours were treated with 30 fractions over 6 weeks. Total doses ranged from 30 to 100 Gy. Treatment started for all tumours at the same tumour volume. Each symbol represents the fraction of tumours locally controlled at a given dose level (see Table 7.7). The data were fitted using a Poisson-based model and the TCD50 (the dose required to control 50 per cent of the tumours locally) was calculated. In the experiment shown, the TCD50 is 85.2 Gy. The error bar represents the 95 per cent confidence limit of the TCD50. TCP, tumour control probability. Data from Yaromina et al. (2006).
Total doses ranged from 30 to 100 Gy (dose per fraction ranged from 1.0 to 3.3 Gy) and six to eight tumours per dose level were treated. Local tumour control rates were determined 120 days after the end of treatment. This follow-up period is sufficient for this tumour model to detect virtually all regrowing tumours. Careful observation in previous experiments, where animals were followed up until death (lifespan is about 2 years), revealed that 95 per cent of all recurrent FaDu tumours occur within 60 days and 99 per cent within 90 days after end of irradiation. The radiation dose–response curve for local tumour control exhibits a sigmoid shape with a threshold value. Below total doses of about 50 Gy no tumours are controlled, presumably because of the large number of clonogenic cells that survived the treatment. Above this threshold dose, local TCP increases steeply with increasing dose. The data can be fitted using a Poisson-based statistical model and the TCD50 is calculated according to:
TCD50 D0 (ln N0 ln(ln 2))
where D0 reflects the intrinsic radiosensitivity of clonogenic cells (see Chapter 4, Section 4.8) and N0 is the number of clonogens before irradiation. The TCD50 value can be used to compare results obtained from different tumour models (Fig. 7.7).
Table 7.8 Results from a typical TCD50 (dose required to control 50 per cent of the tumours) experiment
|
|
|
Number of censored |
|
|
|
Total dose |
Number of |
Number of locally |
animals (censoring |
Observed local |
TCP |
|
(Gy) |
irradiated tumours |
controlled tumours |
interval in days) |
control rates (%) |
(%) |
|
|
|
|
|
|
|
|
30 |
11 |
0 |
0 |
0 |
13.4 |
10 6 |
40 |
11 |
0 |
0 |
0 |
12.6 |
10 3 |
50 |
11 |
0 |
0 |
0 |
0.6 |
|
60 |
12 |
0 |
1 (99) |
8.3 |
5.6 |
|
72.5 |
11 |
2 |
1 (119) |
27.3 |
24.1 |
|
85 |
12 |
2 |
2 (55–77) |
33.3 |
49.6 |
|
100 |
13 |
7 |
4 (51–116) |
83.9 |
74.1 |
|
Human squamous cell carcinoma FaDu was transplanted subcutaneously into nude mice. At a diameter of about 7 mm, the tumours were irradiated with 30 fractions over 6 weeks. Total radiation doses ranged from 30 to 100 Gy. Local tumour control was evaluated 120 days after end of treatment. From the observed local control rates the tumour control probability (TCP) was calculated using the Poisson model. The TCD50 is 85.2 Gy (95 per cent confidence limits 77–96 Gy).
For calculations of TCP, censored animals were taken into account according to the method described by Walker and Suit (1983).
Tumour response to radiation 89
|
100 |
|
|
|
|
|
|
|
|
|
80 |
|
|
|
|
|
|
|
|
TCP (%) |
60 |
|
|
|
|
|
|
|
|
40 |
|
|
|
|
|
|
|
|
|
|
20 |
|
|
|
|
|
|
UT-SCC-14 |
|
|
|
|
|
|
|
|
|
FaDu |
|
|
0 |
|
|
|
|
|
|
UT-SCC-5 |
|
|
|
|
|
|
|
|
|
|
|
|
0 |
20 |
40 |
60 |
80 |
100 |
120 |
140 |
160 |
|
|
|
|
|
Dose (Gy) |
|
|
|
|
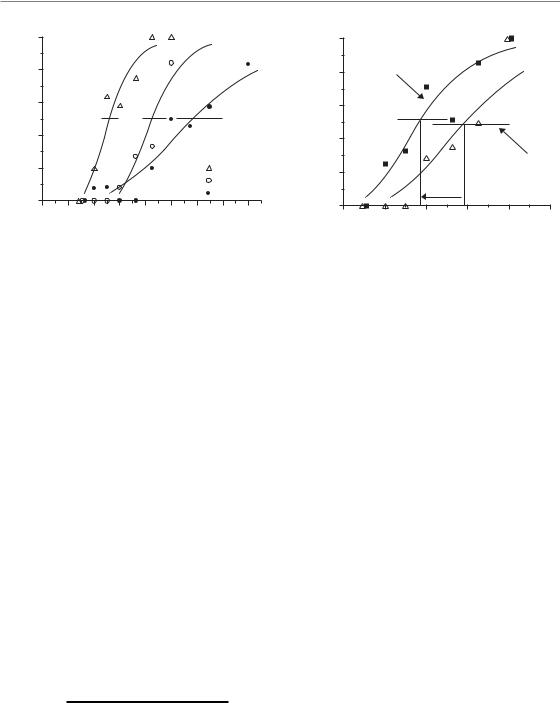
Figure 7.7 Dose-response curves for local tumour control of three different human squamous cell carcinomas growing in nude mice. Tumours were treated with 30 fractions over 6 weeks with total doses from 30 to 160 Gy. Treatment started for all tumours at the same tumour volume. The data were fitted using a Poissonbased model and the TCD50 (the dose required to control 50 per cent of the tumours locally) values as well as their confidence limits were calculated. The three carcinomas show clear-cut differences in radiation sensitivity with UT-SCC-14 being the most sensitive, FaDu with intermediate sensitivity and UT-SCC-5 being the most resistant. The differences in radiation sensitivity can be quantified by comparing the TCD50 values: 52.1 Gy (46; 59) for UT-SCC-14, 85.2 Gy (77; 96) for FaDu, and
129.8 Gy (104; 207) for UT-SCC-5. TCP, tumour control probability. Data from Yaromina et al. (2006).
The TCD50 assay has been used widely to investigate and quantify modifications in radiation sensitivity or number of clonogenic tumour cells (an example of a typical experiment is given in Fig. 7.8) and the data evaluation and reporting of results are well established and standardized. The effect of treatment modifications on local TCP can be quantified by calculation of a dose-modifying factor (DMF):
DMF TCD50 (without modification) TCD50 (with modification)
The DMF represents the relative reduction in radiation dose by a given treatment modification to achieve a certain level of TCP (isoeffect) compared with radiation without modification. In other words, DMF values larger than 1 indicate
|
100 |
|
|
|
|
|
|
80 |
with TBE |
|
|
|
|
|
|
|
|
|
|
|
TCP (%) |
60 |
|
|
|
|
|
40 |
|
|
|
|
|
|
|
20 |
|
|
|
without TBE |
|
|
|
|
|
|
|
|
|
|
|
DMF |
|
|
|
|
0 |
|
|
|
|
|
|
20 |
40 |
60 |
80 |
100 |
120 |
|
|
|
Dose (Gy) |
|
|
|
Figure 7.8 FaDu human squamous cell carcinoma was transplanted either into unirradiated subcutaneous tissues or into pre-irradiated tissues of nude mice. Preirradiation of the transplantation site was performed to induce radiation damage to the supplying host tissues (tumour bed effect, TBE) as an experimental model of impaired tumour angiogenesis. At a tumour diameter of about 6 mm, tumours of both groups (with TBE and without TBE/control) were treated with 30 fractions over 6 weeks with total doses from 30 to 100 Gy. Local tumour control rates were determined 120 days after the end of fractionated irradiation. The TCD50 (dose required to control 50 per cent of the tumours locally) values were 56.6 Gy for the TBE group and 78.7 Gy for the control group. The effect of the pre-irradiation of the transplantation site on local tumour control after fractionated irradiation is given by the dose-modifying factor (DMF) of 1.4 (TCD50,control/TCD50,TBE). This indicates that the TBE improved local tumour control after fractionated irradiation (at the effect level 50 per cent) by a factor of 1.4. Data from Zips et al. (2001).
that the modification, for example by a new drug being tested, resulted in a greater sensitivity to radiation treatment.
Compared with other in vivo assays discussed below, however, the TCD50 assay is time-consuming and expensive. To design, perform and evaluate experiments using this local tumour-control endpoint requires considerable technical knowledge and experience. Intercurrent death of animals may hamper adequate follow up, which needs to be sufficiently long to detect virtually all recurrences (i.e. mostly 4–6 months, depending on the tumour line). Small variations in the number of surviving

90 Tumour growth and response to radiation
clonogenic cells after irradiation may cause dramatic differences in local TCP. Therefore the TCD50 assay, particularly in xenograft models, is very sensitive to the host’s immune reaction (Rofstad, 1989). Whether a tumour model evokes an immune response by the host must be therefore tested before local tumour control experiments are undertaken. Nevertheless despite these drawbacks, the local tumour control assay remains the most relevant experimental method to determine survival of clonogenic tumour cells after irradiation in their environment of treatment. Very importantly, the TCD50 assay is well standardized and the experimental endpoint is identical to the clinical endpoint used in curative radiotherapy.
Excision assays
Alternative experimental methods to determine clonogenic survival after irradiation include the in vivo/in vitro assay, the endpoint dilution assay and the lung colony assay. These assays, introduced in Chapter 4, Section 4.4, all require surgical excision of the tumours after irradiation in situ and the preparation of a single-cell suspension from the excised tumour using tryptic enzymes to disaggregate the tissue. For the in vivo/in vitro assay, different numbers of cells are seeded in culture flasks (Hill, 1987). After an incubation time of typically 7–21 days the number of colonies is counted. A colony consists of at least 50 cells and is considered to derive from a single surviving clonogenic tumour cell. As in the classical in vitro colony forming assay (see Chapter 4, Section 4.2), the surviving fraction is calculated from the ratio of colonies counted to the number of cells seeded. For the lung colony assay, different numbers of cells derived from a tumour irradiated in situ are injected intravenously (typically via a tail vein) into groups of recipient mice. Usually around 10 days later, the number of tumour-cell colonies in the lungs is counted and the surviving fraction is calculated by comparison with lung colonies that grew from cells derived from unirradiated tumours. For the endpoint dilution assay (TD50 assay) different numbers of cells from an irradiated tumour are inoculated into recipient animals and the frequency of tumour take (tumour growth) is scored.
Excision assays are less resource-consuming and give more rapid results than local tumour control assays. In the in vivo/in vitro assay, potential effects of the host immune system are also ruled out. However, a disadvantage of excision assays is that clonogen survival is not determined in the original environment of treatment. Furthermore, results may be affected by the disaggregation method used for single-cell preparation (i.e. the influence of timing, chemicals, enzymes and mechanical stress). For colony assays (in vivo/in vitro assay and lung colony assay) extensive background information is necessary before the experiment can start: whether the cells form colonies, how many cells at a given radiation dose need to be plated or injected and how long to incubate before counting colonies. The maximum number of cells that can be plated in Petri dishes or injected intravenously is restricted, making it difficult to detect surviving fractions accurately below about 10 4. Thus, small but resistant subpopulations of clonogenic cells may be systematically overlooked particularly by colony assays. Furthermore, effects of prolonged treatment such as fractionated irradiations are difficult to assess by excision assays (Hill, 1987).
Regression
To determine tumour regression, the volumes of treated and untreated tumours at a given timepoint are compared and the ratios for treated versus control tumours (T/C ratios) are reported. The magnitude of tumour regression depends upon radiation effects on the entire cell population in a tumour, including malignant and non-malignant cells, for example endothelial cells, fibroblasts and inflammatory cells. In addition, other factors such as oedema, resorption of dead cells and proliferation of surviving cells contribute to the tumour volume after radiation. These factors differ considerably between different tumours. Whereas tumour cell kill is radiation-dose dependent, resorption, oedema and proliferation may not be. From the notion that regression increases with radiation dose one can argue that for a given tumour model the magnitude of regression reflects the radiation dose-dependent tumour cell kill. Tumour volume measurements under experimental conditions
Tumour response to radiation 91
are roughly limited to a range of 1.5 107–1.5 109 tumour cells (assuming 109 cells/g tumour; compare Fig. 7.1). Thus even for a given tumour model, volume measurements only assay the radiation response of a very limited proportion of all tumour cells and the response of small and possibly resistant tumour cell populations cannot be detected. In summary, tumour regression is a highly non-specific parameter and of very limited value in describing and quantifying the effect of radiation on tumours.
Tumour regrowth delay
This is a widely used assay that rapidly provides the researcher with data and can be applied in the laboratory or the clinic. The endpoint is the time to reach a certain tumour volume. Therefore, precise determination of tumour volume (e.g. by callipers for subcutaneously growing tumours or by imaging methods) is essential. In experimental studies, groups of tumours are irradiated and one group of tumours is left unirradiated (control group). Then, the volume of each individual tumour is recorded over time and a growth curve is plotted (Fig. 7.9). From this growth curve different parameters may be read, such as the time it takes for a tumour to grow (tumour growth time, TGT) to five times the treatment volume (TGTV5). From the TGT values for individual tumours the average values for each
treatment group (TGTtreated) and of the control group (TGTcontrol) are calculated. Tumour growth delay (TGD) is then calculated from:
TGD TGTtreated TGTcontrol
The specific growth delay (SGD) takes the growth rate of the tumour model into account and allows comparison between different tumour models or different treatments. The SGD is calculated from:
SGD (TGTtreated TGTcontrol)/TGTcontrol
or
SGD TGT/VDTcontrol
Tumour regrowth following irradiation depends upon the effect treatment has had on malignant and
|
10 |
TGTV10 |
|
|
TGTV5 |
volume |
|
TGTV2 |
1 |
|
|
tumour |
|
NGD |
|
|
|
Relative |
0.1 |
|
|
RT |
|
|
|
|
|
0.01 |
|
|
|
|
Days after start of irradiation
Figure 7.9 Growth curve of an individual FaDu tumour treated with 15 fractions of 2 Gy. Tumour volume
was calculated using the formula for a rotational ellipsoid (V [π/6]*a*b2) where a is the longest tumour axis and b is the axis perpendicular to a. The parameters a and b were measured every second day using callipers. The volume is plotted as relative to the volume at the start of treatment. During the initial phase of irradiation the volume increased and later decreased to reach the lowest relative volume (nadir) on day 30 after the start of treatment. After this regression the tumour regrew at a slower rate than before radiation (the regrowth curve is shallower than the growth curve before radiotherapy) indicating the tumour bed effect. From the growth curve, different parameters of the regrowth assay can be read: tumour growth time to reach twice, five times, and ten times the starting volume (TGT2, TGT5, TGT10). See text for explanation of NGD (net growth delay).
non-malignant cells. Radiation-induced damage to the host vascular connective tissues surrounding the tumour may result in a slower growth rate of irradiated tumours; this is called the tumour bed effect. As a consequence, SGD apparently increases with increasing tumour volume (Fig. 7.9). To correct for the tumour bed effect, the parameter net growth delay (NGD) has been suggested (Beck-Bornholdt et al., 1987). Net growth delay is defined as the time between when the regrowing tumour has reached twice its minimal volume (nadir) after treatment and the time at which the tumour had the same volume before treatment. An alternative would be to choose the endpoint size as low as possible.
The TGD increases with radiation dose, reflecting the dose-dependency of cell kill (Fig. 7.10).
92 Tumour growth and response to radiation
(days) |
12 |
|
|
|
|
|
|
|
|
|
|
|
|
|
|
|
|
|
|
|
|
|
|
|
|
|
|
|
|
|
|
|
|
|
|
||
10 |
|
|
|
|
modifier |
|
|
|
|
|
|
|
|
|
||||
|
|
|
|
|
Radiation plus |
|
|
|
|
|
|
|
||||||
delay |
8 |
|
|
|
|
|
|
|
|
|
|
|
|
|
|
|
|
|
|
|
|
|
|
|
|
|
|
|
|
|
|
|
|
|
|
||
6 |
|
|
|
|
|
|
|
|
|
|
|
|
|
|
|
|
|
|
growth |
|
|
|
|
|
|
|
|
|
|
|
|
DMF |
|
|
|
||
|
|
|
|
|
|
|
|
|
|
|
|
|
|
|
||||
4 |
|
|
|
|
|
|
|
|
|
|
|
|
|
|
|
|||
|
|
|
|
|
|
|
|
|
|
|
|
|
|
|
|
|
||
Tumour |
2 |
|
|
|
|
|
|
|
|
|
|
|
|
Radiation only |
|
|||
|
|
|
|
|
|
|
|
|
|
|
|
|
||||||
|
|
|
|
|
|
|
|
|
|
|
|
|
|
|||||
|
0 |
|
|
|
|
|
|
|
|
|
|
|
|
|
||||
|
|
|
|
|
|
|
|
|
|
|
|
|
|
|
|
|
|
|
|
0 |
1 |
2 |
3 |
4 |
5 |
6 |
7 |
8 |
|||||||||
Radiation dose (Gy)
Figure 7.10 Tumour growth delay after treatment at different radiation doses with and without a treatment modifier. The modifier results in a longer tumour growth delay (TGD) per radiation dose. The effect of the modifier can be quantified as the dose-modifying factor (DMF).
The relationships found between radiation dose, the logarithm of surviving clonogenic tumour cells and the TGD suggest that the TGD is a surrogate parameter for clonogenic cell kill. However, there are several limitations. First, quantitative transplantation experiments revealed that the tumour growth rate decreases with decreasing numbers of inoculated cells (Urano and Kahn, 1987). This suggests that, at low levels of cell survival, TGD may not correlate well with the surviving number of clonogenic cells. Second, TGD depends a great deal on the radiation effect on the mass of non-clonogenic tumour cells. As a consequence, small variations in the population of clonogenic cells (number and/or sensitivity) may not be detected by the TGD assay. Third, the TGD reflects not only cell kill but also the growth rate of the regrowing tumour. Therefore, this assay is highly sensitive to variations in the proliferation rate, including pharmacological manipulations. Thus, a longer TGD does not always mean a higher cell kill. The limitations of the TGD to precisely reflect clonogenic cell kill are underlined by the observation that results from TGD assays might not correlate with results obtained from local tumour control assays (Overgaard et al., 1987; Baumann et al., 2003; Krause et al., 2004; Zips et al., 2005). This important caveat must be considered,
for example, when the TGD assay is used to evaluate radiation modifiers (see Chapter 21). Solutions to this problem include performing confirmatory local tumour control experiments or possibly obtaining TGD at different radiation dose levels (dose–response relationship) as well as calculating the growth delay per gray (i.e. the steepness of the dose–response curve; Krause et al., 2006).
To quantify and report the magnitude of effect caused by radiation modifiers on TGD, the DMF or the enhancement ratio (ER) have been used. The DMF is calculated as the ratio of radiation dose with and without modifier giving the same TGD (i.e. the ratio of isoeffective radiation doses). Thus, calculation of the DMF requires the investigation of multiple radiation dose levels and the construction of dose–response curves (Fig. 7.10). Often, only one radiation dose level is investigated. In such situations the ER has been used instead of DMF to describe the effect of the modifier. The ER is the ratio of TGD with/without modifier at a given radiation dose level. Both ER and DMF depend on the position and steepness of the dose–effect curves. The ER might depend on the radiation dose and DMF might depend on the level of effect. In general, the interpretation of TGD, ER and DMF, and their relevance for clonogenic tumour cell inactivation, is complicated. Despite its apparent simplicity, the inherent methodological problems of the TGD assay (described above), the lack of consensus about data evaluation and arbitrary procedural details limit its value in reliably quantifying the radiation response of clonogenic cells. It is therefore recommended to always test the conclusions from TGD assays by undertaking local tumour control studies, before introducing novel treatments into clinical radiotherapy.
7.3 FACTORS INFLUENCING LOCAL TUMOUR CONTROL
Introduction
A number of factors can contribute to the probability of local tumour control after fractionated radiotherapy. These factors have been summarized by Withers (1975) as the four Rs of radiotherapy: recovery from sublethal damage, cell-cycle
Factors influencing local tumour control 93
redistribution, cellular repopulation and tumour reoxygenation. Steel and colleagues have suggested intrinsic cellular radiosensitivity as a fifth ‘R’ to account for the different tolerance of tissues to fractionated irradiation (Steel et al., 1989).
Recovery from sublethal damage
Most of the damage induced in cells by radiation is satisfactorily repaired. Evidence for this comes from studies of strand breaks in DNA, the vast majority of which disappear during the first few hours after irradiation (see Chapter 2, Sections 2.7 and 2.8). Further evidence for repair comes from the wide variety of recovery experiments that have been done, both on in vitro cell lines and on normal and tumour tissues in vivo. It is useful to draw a distinction between these two sources of evidence:
●Repair – refers to the process by which the function of macromolecules is restored. Rejoining of DNA strand breaks provides some evidence
for this, although the rejoining of a break does not necessarily mean that gene function is restored. Rejoining can leave a genetic defect (i.e. a mutation) and specific tests of repair fidelity are needed to detect this. The word ‘repair’ is often loosely used as an synonym for cellular or tissue recovery.
●Recovery – refers to the increase in cell survival or reduction in the extent of radiation damage to a tissue, when time is allowed for this to occur.
There are a number of experimental sources of evidence for recovery, including the following.
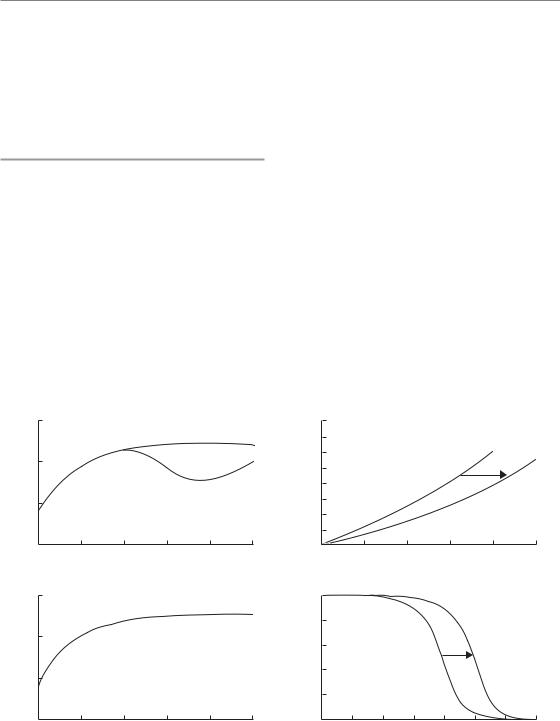
●Split-dose experiments – the effect of a given dose of radiation is less if it is split into two fractions, delivered a few hours apart. This effect has been termed ‘recovery from sublethal damage’ (SLD), or ‘Elkind recovery’ (Elkind and Sutton, 1960). The SLD recovery can be observed using various experimental endpoints: for example, using cell survival (Fig. 7.11a), tumour growth delay (Fig. 7.11c) or mouse lethality after irradiating a vital
Surviving fraction
0
(a)
Surviving fraction
0
(b)
|
|
|
Cycling cells |
|
2 |
4 |
6 |
8 |
10 |
|
Hours between doses |
|
||
2 |
4 |
6 |
8 |
10 |
|
Hours after irradiation |
|
|
|
Tumour growth delay (days)
(c)
Mouse survival
(d)
8
7
6
5
4
3
2
1
0 0
1.0
0.8
0.6
0.4
0.2
0.0
0
Single dose
|
|
|
Split dose |
|
2 |
4 |
6 |
8 |
10 |
|
Radiation dose (Gy) |
|
|
|
Split dose
Single dose
2 |
4 |
6 |
8 |
10 |
12 |
14 |
|
Radiation dose (Gy) |
|
|
|||
Figure 7.11 Illustrating four ways of measuring recovery from radiation damage (see text). (a, c, d) Three types of split-dose experiment; (b) the result of a ‘delayed-plating experiment’. The arrows indicate the measurement of (D2–D1) values.
94 Tumour growth and response to radiation
normal tissue (Fig. 7.11d). The typical timing of split-dose recovery is shown in Fig. 7.11a. Considerable recovery occurs within 15 min to 1 hour, and recovery often seems to be complete by roughly 6 hours but can be slower than this in some normal tissues such as the spinal cord (Table 9.2). When the split-dose technique is applied to cycling cells (Fig. 7.11a) there is usually a wave in the data caused by cell-cycle progression effects (see below).
●Delayed-plating experiments – if cells are irradiated in a non-growing state and left for increasing periods of time before assaying for survival, an increase in survival is often observed (Fig. 7.11b). During this delay the cells are recovering the ability to divide when called upon to do so. This has been termed ‘recovery from potentially lethal damage’ (PLD). The kinetics of PLD recovery and SLD recovery are similar.
●Dose-rate effect – reduction in radiation damage as dose rate is reduced to around 1 Gy/hour is primarily caused by cellular recovery (see Chapter 12).
●Fractionation – the sparing effect of fractionating radiation treatment within a relatively short overall time is primarily due to recovery. This is therefore the main reason why isoeffect curves slope upwards as the fraction number is increased (see Chapter 8, Figs 8.1 and 8.2).
What is the relationship between all these various ways of detecting recovery? The damage induced in cells by ionizing radiation is complex, as are the enzymatic processes that immediately begin to repair it. The various types of ‘recovery experiment’ listed above evaluate this complex repair process in slightly different ways. For example, the evaluation based on giving a second dose (i.e. SLD recovery) may be different from that obtained by ‘asking’ irradiated non-dividing cells to divide (i.e. PLD recovery).
Variation of cell killing through the cell cycle, cell-cycle delay and redistribution
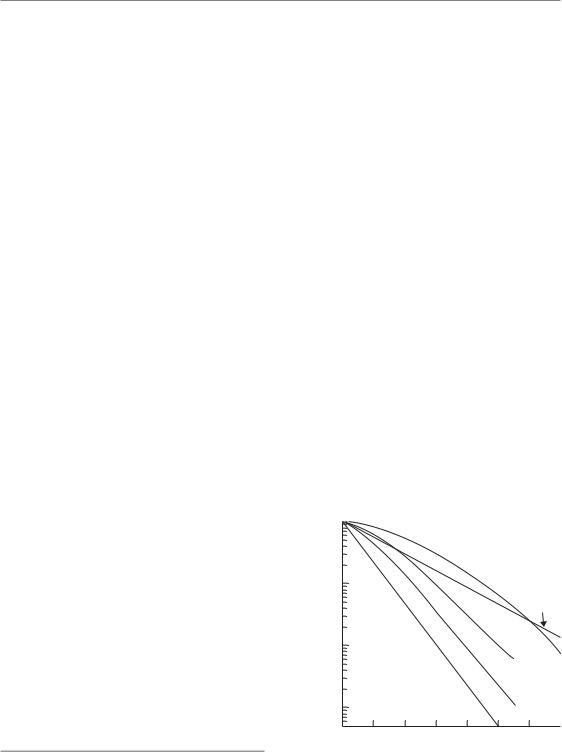
The radiosensitivity of cells varies considerably as they pass through the cell cycle. This has been studied in a large number of cell lines, using cell
synchronization techniques and fluorescence-acti- vated cell sorting (FACS) to obtain cell populations in each cell-cycle phase. There is a general tendency for cells in the S phase (in particular the latter part of the S phase) to be the most resistant and for cells in very late G2 and mitosis to be the most sensitive. The reason for the resistance in S phase is thought to be homologous recombination, which is increased as a result of the greater availability of the undamaged sister template through the S phase, together with conformational changes in DNA facilitating the easier access of repair complexes during replication. Sensitivity very late in G2 and into mitosis probably results from the fact that those cells have passed a final checkpoint in G2 which occurs within minutes of radiation exposure and allows cells in early G2 to repair their damage probably using homologous recombination (see Chapter 2, Section 2.7). The classic results of Sinclair and Morton (1965) are illustrated in Fig. 7.12. They synchronized Chinese hamster cells at five different points in the cell cycle and performed cell survival experiments. The survival curves showed that it was mainly the shoulder of the curve that changed: there was little shoulder for cells in mitosis and the shoulder was greatest for cells in S phase.
The effect of this phenomenon on an asynchronous cell population is that it creates a degree of
1.0
0.5
|
0.2 |
|
|
|
|
|
|
|
survival |
0.1 |
|
|
|
|
|
|
|
0.05 |
|
|
|
|
|
M |
|
|
|
|
|
|
|
|
|
||
cell- |
|
|
|
|
|
|
|
|
0.02 |
|
|
|
|
|
|
|
|
Single |
|
|
|
|
|
|
|
|
0.01 |
|
|
|
|
|
|
LS |
|
|
|
|
|
|
|
|
||
|
|
|
|
|
|
|
|
|
|
0.005 |
|
|
|
|
|
ES |
|
|
0.002 |
|
|
|
|
|
|
|
|
0.001 |
|
|
|
M |
G1, G2 |
|
|
|
|
|
|
|
|
|
||
|
0.0005 |
|
|
|
|
|
|
|
|
0 |
200 |
400 |
600 |
800 |
1000 |
1200 |
1400 |
Dose (rad)
Figure 7.12 Variation of radiosensitivity through the cell cycle of Chinese hamster cells. Adapted from Sinclair and Morton (1965), with permission.

Factors influencing local tumour control 95
synchrony in the cells that survive irradiation. Immediately after a dose of X-rays, all the cells will still be at precisely the same point in the cell cycle as they were before irradiation, but some will have lost their reproductive integrity and it is the number that retains this which will tend to be greatest in the S phase. With increasing time after irradiation the surviving clonogenic cells will show the same distribution over the cell cycle as before irradiation. This phenomenon is called redistribution. In the 1970s there was much interest in synchronization therapy. This was an attempt to exploit cell-cycle progression phenomena by treating with a second agent (usually a cytotoxic drug) at the optimum time interval after a priming treatment with drug or radiation. Although this approach to improving tumour therapy was thoroughly researched it proved in most cases to be disappointing. One possible reason for this is that tumours tend to be very heterogeneous from a kinetic point of view: cells move at very different speeds through the phases of the cell cycle and induced cell synchrony is therefore quickly lost (Steel, 1977).
Reoxygenation
This important factor influencing local tumour control is described in Chapter 15. The clinical implications for modified fractionation are discussed in Chapters 16 and 17.
Repopulation
Each fraction during a course of fractionated radiotherapy reduces the total population of clonogenic tumour cells in a tumour (i.e. causes a depopulation of the clonogenic tumour cell compartment; Fig. 7.3). In general, clonogenic cells that survive radiation can repopulate the tumour by proliferation and/or reduced cell loss. Repopulation of clonogenic tumour cells might occur during the course of fractionated radiotherapy and thereby reduce the efficacy of treatment. If a tumour has the capacity to repopulate, any prolongation of the overall treatment time results in a higher number of clonogenic tumour cells that need to be inactivated and thereby requires a higher radiation dose to achieve local tumour
control. The so-called time factor of fractionated radiotherapy (see Chapter 10) has been largely attributed to repopulation of clonogenic tumour cells during treatment (Kummermehr et al., 1992; Thames et al., 1996; Petersen et al., 2001; Hessel et al., 2004). Accelerated repopulation describes a phenomenon that the net clonogen doubling time during or shortly after irradiation exceeds the clonogen doubling time in untreated tumours. Repopulation of clonogenic tumour cells during fractionated radiotherapy has been shown in a large variety of different experimental and clinical studies, as described in Chapter 10 and reviewed by Baumann et al. (2003). The results are most consistent for squamous cell carcinomas, but for other tumour types evidence for a time factor is also accumulating. The rate, kinetics and underlying radiobiological mechanisms of repopulation vary substantially between tumour types as well as between different tumour lines of the same tumour type. For example, FaDu human squamous cell carcinoma transplanted into nude mice repopulates rapidly with a dose of about 1 Gy recovered per day during fractionated irradiation (Baumann et al., 1994).
The kinetics and radiobiological mechanisms of repopulation have been studied in an extensive series of experiments with fractionated irradiation given to human tumour xenografts either under clamp hypoxia or under normal blood flow conditions (Petersen et al., 2001). A switch to rapid repopulation was observed after about 3 weeks of fractionated irradiation, with the clonogen doubling time decreasing from 9.8 days during the first 3 weeks to 3.4 days thereafter (Fig. 7.13). In this study, acceleration of repopulation was preceded by a decrease in tumour hypoxia after 2 weeks of fractionated irradiation, suggesting that improved tumour oxygenation might trigger repopulation in tumours either by facilitating more proliferation and/or by reducing cell loss. Increased labelling indices for BrdUrd (S-phase fraction) and Ki67 (growth fraction) during fractionated irradiation indicate that increased proliferation contributes directly to repopulation (Petersen et al., 2003).
Repopulation |
rate |
was found |
to |
be lower |
in tumours |
with |
increased cell |
loss, |
indirectly |
implying that decreased cell loss might also enhance repopulation (Hessel et al., 2003). This latter

96 Tumour growth and response to radiation
|
120 |
|
Tclon |
|
|
Tclon |
|||
|
|
|
|
||||||
|
|
|
|
|
|||||
(Gy) |
|
|
|
|
|
|
[1.7;5] |
||
60 |
|
|
|
|
day 22 [13;30] |
|
|
|
|
50 |
|
|
|
|
|
|
|
||
|
|
|
|
|
|
|
|
||
TCD |
|
|
|
|
|
|
|
|
|
|
|
|
|
|
|
|
|
|
|
|
|
|
|
|
Radiobiological hypoxia |
|
|
|
|
|
0 |
|
|
|
|
|
|
|
|
|
|
|
|
|
|
|
|
|
|
|
|
|
|
|
|
|
|
|
|
|
0 |
1 |
2 |
3 |
4 |
|
|
||
|
|
|
Weeks after start of fractionated radiotherapy |
||||||
Figure 7.13 Rate, kinetics and underlying mechanism of repopulation of clonogenic tumour cells in FaDu squamous cell carcinoma growing in nude mice
(data from Petersen et al., 2001). As the result of repopulation, the tumour control dose (TCD50) increases with time. Clonogenic FaDu tumour cells repopulate at a low rate during the first 3 weeks with an estimated clonogen doubling time (Tclon) of 9.8 days. After a switch around day 22, repopulation accelerates to a Tclon of 3.4 days. In this tumour model the switch in repopulation is preceded by a decrease in radiobiological hypoxia.
concept – that clonogens always proliferate at their maximum rate (‘potential clonogen doubling time’) but, owing to the limited supply of nutrients and oxygen, clonogens are pushed towards necrosis by the proliferative pressure from the cell layers close to supporting blood vessels – was originally postulated by Fowler (1991). Once radiotherapy has killed off enough well-oxygenated tumour cells, the oxygen and nutrient supply improves and the spontaneous cell loss decreases. The effective doubling time of clonogens therefore becomes shorter and shorter during treatment and eventually the Tpot of clonogens is ‘unmasked’.
In contrast to this concept it has been suggested, particularly for well-differentiated tumours, that an actively regulated regenerative response of surviving clonogens reminiscent of a normal epithelium represents the major mechanism of clonogen repopulation (Trott and Kummermehr, 1991; Kummermehr et al., 1992; Dorr, 1997; Hansen et al., 1997). Signalling via the epidermal growth factor receptor (EGFR) has been proposed as a potential molecular mechanism of this
regulated regenerative response underlying repopulation (Schmidt-Ullrich et al., 1999; Petersen et al., 2003; Bentzen et al., 2005; Eriksen et al., 2005; Krause et al., 2005), as described in Chapter 21.
Tumour volume
Large tumours are more difficult to cure than small tumours. This has been known since the early years of radiotherapy (Miescher, 1929). There are several explanations for this observation. First, tumour volume is proportional to the number of clonogens per tumour. Second, hypoxia is more pronounced in large tumours than in small tumours. Third, in the clinical situation large tumours can often not be irradiated to curative doses because of the larger irradiated volume and limited tolerance of the adjacent normal tissues. Assuming a linear relationship between the number of clonogens and tumour volume, and other parameters such as density, radiosensitivity and hypoxic fraction of clonogenic tumour cells all being equal, the relationship between the tumour control probability (TCP2) and the relative tumour volume (Vrel) can be described according to Dubben et al. (1998) as:
TCP2 TCP1Vrel
where TCP1 represents the reference TCP when the relative tumour volume (Vrel) equals 1. If, for example, a TCP1 of 50 per cent is chosen then the relationship between relative tumour volume and TCP can be described with the function TCP2 50Vrel (Fig. 7.14). Over a wide range, the TCP decreases roughly linearly with the logarithm of tumour volume (or the number of clonogens), whereas at very low and very high TCPs the impact of tumour volume is less pronounced. Both experimental and clinical data lend support to this simple theory, indicating that tumour volume is indeed an important factor influencing local tumour control after radiotherapy (Baumann et al., 1990; Bentzen and Thames, 1996; Dubben et al., 1998). However, analysis of clinical data has also revealed that the effect of tumour volume on TCP is less than expected from Fig. 7.14 (Bentzen and Thames, 1996). This is not surprising as the
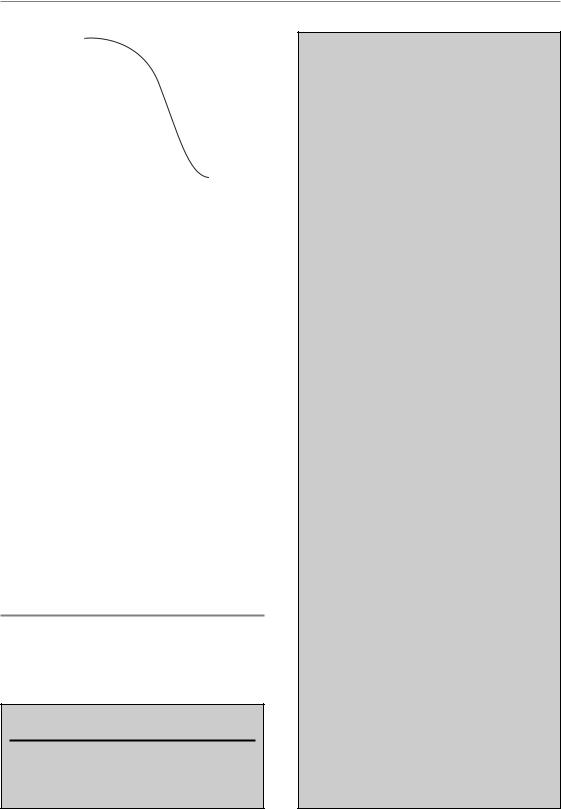
|
100 |
|
|
|
|
|
|
|
|
|
|
|
|
|
|
|
|
|
|
|
|
|
|
|
|
|
|
|
|
|
|
|
|
|
|
|
|
|
|
|
|
|
|
|
|
|
|
|
|
|
|
|
|
|
|
(%)TCP |
80 |
|
|
|
|
|
|
|
|
|
|
|
|
|
|
|
|
|
|
|
|
|
|
|
|
|
|
|
|
|
|
|
|
|
|
|
|
|
|
|
|
|
|
|
|
|
|
|
|
|
|
|
|
||
|
|
|
|
|
|
|
|
|
|
|
|
|
|
|
|
|
|
|
|
|
|
|
|
|
|
||
40 |
|
|
|
|
|
|
|
|
|
|
|
|
|
|
|
|
|
|
|
|
|
|
|
|
|
|
|
|
|
|
|
|
|
|
|
|
|
|
|
|
|
|
|
|
|
|
|
|
|
|
|
|
|
||
|
60 |
|
|
|
|
|
|
|
|
|
|
|
|
|
|
|
|
|
|
|
|
|
|
|
|
|
|
|
|
|
|
|
|
|
|
|
|
|
|
|
|
|
|
|
|
|
|
|
|
|
|
|
|
|
|
|
20 |
|
|
|
|
|
|
|
|
|
|
|
|
|
|
|
|
|
|
|
|
|
|
|
|
|
|
|
|
|
|
|
|
|
|
|
|
|
|
|
|
|
|
|
|
|
|
|
|
|
|
|
|
|
|
|
|
|
|
|
|
|
|
|
|
|
|
|
|
|
|
|
|
|
|
|
|
|
|
|
|
|
|
|
|
|
|
|
|
|
|
|
|
|
|
|
|
|
|
|
|
|
|
|
|
|
|
|
|
|
|
|
|
|
|
|
|
|
|
|
|
|
|
|
|
|
|
|
|
|
|
|
|
|
|
|
|
|
|
|
0 |
|
|
|
|
|
|
|
|
|
|
|
|
|
|
|
|
|
|
|
|
|
|
|
|
|
|
|
|
|
|
|
|
|
|
|
|
|
|
|
|
|
|
|
|
|
|
|
|
|
|
|
|
|
|
|
0.001 |
0.01 |
0.1 |
1 |
10 |
100 |
|||||||||||||||||||||
Relative tumour volume
Figure 7.14 Theoretical relationship of tumour control probability (TCP) and relative tumour volume according to Dubben et al. (1998). A TCP of 50 per cent is arbitrarily chosen to correspond to a relative tumour volume of 1. The relationship is based on the assumption of a linear relationship between the number of clonogens and tumour volume and that all other parameters (e.g. density, radiosensitivity and hypoxic fraction of clonogenic tumour cells) are invariant. Reprinted with permission from Elsevier.
above-mentioned assumption that all other factors than volume are equal is not realistic in the clinical situation. Instead, patient-to-patient heterogeneity in a large variety of known and unknown determinants of local tumour control may interfere with the simple proportionality of TCP and tumour volume. However, as for other known prognostic factors in radiotherapy, such as stage, age, histology, etc., tumour volume should be routinely measured and reported in clinical trials as well as included into data analyses.
ACKNOWLEDGEMENT
The author gratefully acknowledges the help of A. Begg and G. Steel for allowing parts of their chapter from the previous edition of this textbook to be used.
Key points
1.Volume of growing tumours increases exponentially with time. Therefore, tumour
volume should always be plotted on a
Acknowledgement 97
logarithmic scale to facilitate evaluation of growth curves, comparison of growth rates among different tumours, and judgement of treatment effects.
2.Growth rates vary among different tumours. Primary tumours tend to grow more slowly than metastatic lesions. A volume doubling time of 3 months is typical for many primary tumours.
3.Tumour growth rate is determined by the fraction of cycling cells (growth frac-
tion, GF), the cell cycle time (TC) and the cell loss rate. Typical values for human tumours are 40 per cent, 2 days, and 90 per cent, respectively. However, these parameters vary considerably between tumours and even among tumours of the same histological type.
4.Potential doubling time (Tpot) is the theoretical volume doubling time in the absence of cell loss. Therefore, the difference between the observed volume doubling time and the
Tpot is explained by cell loss in tumours, which exceeds 90 per cent in many histological types.
5.The faster growth of experimental tumours compared with tumours in patients results
from a higher GF, shorter Tpot and a lower cell loss factor.
6.Response of tumours to radiation can be assayed using different endpoints, including local tumour control, tumour regrowth delay and regression.
7.Local tumour control is the aim of curative radiotherapy and therefore conceptually the most relevant endpoint to assay radiation response.
8.Local tumour control is achieved when all clonogenic tumour cells (i.e. cells with the capacity to proliferate and to cause a local recurrence) are inactivated.
9.Ionizing irradiation is highly effective in inactivating clonogenic tumour cells. The logarithm of the number of surviving clonogenic tumour cells decreases linearly with total radiation dose during fractionated radiotherapy.

98 Tumour growth and response to radiation
10.Response criteria such as partial response or complete response are not appropriate to describe the radiation response of clonogenic tumour cells.
11.Tumour regression is a non-specific parameter of very limited value to describe and quantify radiation effects in tumours.
12.The tumour regrowth delay assay is widely used in experimental radiotherapy. Methodological problems limit the value of this assay to accurately measure the survival of clonogenic tumour cells. Thus, confirmatory local tumour control experiments are recommended.
13.Different factors influence the probability of local tumour control (five Rs of fractionated radiotherapy).
14.Repopulation of clonogenic tumour cells represents a major cause of resistance to fractionated irradiation in certain tumour types. The rate, kinetics and underlying radiobiological mechanisms vary widely among different tumours.
15.Tumour volume is an important determinant of local tumour control.
■BIBLIOGRAPHY
Baumann M, Dubois W, Suit HD (1990). Response of human squamous cell carcinoma xenografts of different sizes to irradiation: relationship of clonogenic cells, cellular radiation sensitivity
in vivo, and tumor rescuing units. Radiat Res 123: 325–30.
Baumann M, Liertz C, Baisch H, Wiegel T, Lorenzen J, Arps H (1994). Impact of overall treatment time of fractionated irradiation on local control of human FaDu squamous cell carcinoma in nude mice.
Radiother Oncol 32: 137–43.
Baumann M, Krause M, Zips D et al. (2003). Selective inhibition of the epidermal growth factor receptor tyrosine kinase by BIBX1382BS and the improvement of growth delay, but not local control, after fractionated irradiation in human FaDu squamous cell carcinoma in the nude mouse. Int J Radiat Biol 79: 547–59.
Beck-Bornholdt HP, Wurschmidt F, Vogler H (1987). Net growth delay: a novel parameter derived from tumor growth curves. Int J Radiat Oncol Biol Phys 13:
773–7.
Begg AC, McNally NJ, Shrieve DC, Karcher H (1985). A method to measure the duration of DNA synthesis and the potential doubling time from a single sample. Cytometry 6: 620–6.
Begg AC, Haustermans K, Hart AA et al. (1999). The value of pretreatment cell kinetic parameters as predictors for radiotherapy outcome in head and neck cancer: a multicenter analysis. Radiother Oncol 50: 13–23.
Bentzen SM, Thames HD (1996). Tumor volume and local control probability: clinical data and radiobiological interpretations. Int J Radiat Oncol Biol Phys 36: 247–51.
Bentzen SM, Atasoy BM, Daley FM et al. (2005). Epidermal growth factor receptor expression in pretreatment biopsies from head and neck squamous cell carcinoma as a predictive factor for a benefit from accelerated radiation therapy in a randomized controlled trial. J Clin Oncol 23: 5560–7.
Brown DC, Gatter KC (2002). Ki67 protein: the immaculate deception? Histopathology 40: 2–11.
Dorr W (1997). Three As of repopulation during fractionated irradiation of squamous epithelia: Asymmetry loss, Acceleration of stem-cell divisions and Abortive divisions. Int J Radiat Biol 72: 635–43.
Dubben HH, Thames HD, Beck-Bornholdt HP (1998). Tumor volume: a basic and specific response predictor in radiotherapy. Radiother Oncol 47: 167–74.
Elkind MM, Sutton H (1960). Radiation response of mammalian cells grown in culture. 1. Repair of X-ray damage in surviving Chinese hamster cells. Radiat Res 13: 556–93.
Eriksen JG, Steiniche T, Overgaard J (2005). The influence of epidermal growth factor receptor and tumor differentiation on the response to accelerated radiotherapy of squamous cell carcinomas of the head and neck in the randomized DAHANCA 6 and 7 study. Radiother Oncol 74: 93–100.
Fowler JF (1991). Rapid repopulation in radiotherapy: a debate on mechanism. The phantom of tumor treatment – continually rapid proliferation unmasked. Radiother Oncol 22: 156–8.
Fowler JE, Pandey P, Braswell NT, Seaver L (1994). Prostate specific antigen progression rates after

Bibliography 99
radical prostatectomy or radiation therapy for localized prostate cancer. Surgery 116: 302–5.
Gerweck LE, Zaidi ST, Zietman A (1994). Multivariate determinants of radiocurability. I. Prediction of single fraction tumor control doses. Int J Radiat Oncol Biol Phys 29: 57–66.
Haitel A, Wiener HG, Migschitz B, Marberger M, Susani M (1997). Proliferating cell nuclear antigen and MIB-1. An alternative to classic prognostic indicators in renal cell carcinomas? Am J Clin Pathol 107: 229–35.
Hanahan D, Weinberg RA (2000). The hallmarks of cancer. Cell 100: 57–70.
Hansen O, Overgaard J, Hansen HS et al. (1997). Importance of overall treatment time for the outcome of radiotherapy of advanced head and neck carcinoma: dependency on tumor differentiation.
Radiother Oncol 43: 47–51.
Haustermans KM, Hofland I, van Poppel H et al. (1997). Cell kinetic measurements in prostate cancer. Int J Radiat Oncol Biol Phys 37: 1067–70.
Hessel F, Petersen C, Zips D et al. (2003). Impact of increased cell loss on the repopulation rate during fractionated irradiation in human FaDu squamous cell carcinoma growing in nude mice. Int J Radiat Biol 79: 479–86.
Hessel F, Krause M, Helm A et al. (2004). Differentiation status of human squamous cell carcinoma xenografts does not appear to correlate with the repopulation capacity of clonogenic tumour cells during fractionated irradiation. Int J Radiat Biol 80: 719–27.
Hill RP (1987). Excision assays. In: Kallman RF (eds)
Rodent tumor models in experimental cancer therapy. New York: Pergamon Press, 67–75.
Hill RP, Milas L (1989). The proportion of stem cells in murine tumors. Int J Radiat Oncol Biol Phys 16: 513–8.
Hommura F, Dosaka-Akita H, Mishina T et al. (2000). Prognostic significance of p27KIP1 protein and ki-67 growth fraction in non-small cell lung cancers. Clin Cancer Res 6: 4073–81.
Hoskin PJ, Sibtain A, Daley FM, Saunders MI, Wilson GD (2004). The immunohistochemical assessment of hypoxia, vascularity and proliferation in bladder carcinoma. Radiother Oncol 72: 159–68.
Jensen V, Sorensen FB, Bentzen SM et al. (1998). Proliferative activity (MIB-1 index) is an independent prognostic parameter in patients with
high-grade soft tissue sarcomas of subtypes other than malignant fibrous histiocytomas: a retrospective immunohistological study including 216 soft tissue sarcomas. Histopathology 32: 536–46.
Jung H, Kruger HJ, Brammer I, Zywietz F, BeckBornholdt HP (1990). Cell population kinetics of the rhabdomyosarcoma R1H of the rat after single doses of X-rays. Int J Radiat Biol 57: 567–89.
Krause M, Hessel F, Zips D, Hilberg F, Baumann M (2004). Adjuvant inhibition of the epidermal growth factor receptor after fractionated irradiation of FaDu human squamous cell carcinoma. Radiother Oncol 72: 95–101.
Krause M, Ostermann G, Petersen C et al. (2005). Decreased repopulation as well as increased reoxygenation contribute to the improvement in local control after targeting of the EGFR by C225 during fractionated irradiation. Radiother Oncol 76: 162–7.
Krause M, Zips D, Thames HD, Kummermehr J, Baumann M (2006). Preclinical evaluation of moleculartargeted anticancer agents for radiotherapy.
Radiother Oncol 80: 112–22.
Kummermehr J, Dorr W, Trott KR (1992). Kinetics of accelerated repopulation in normal and malignant squamous epithelia during fractionated radiotherapy. BJR Suppl 24: 193–9.
Lanza G Jr, Cavazzini L, Borghi L, Ferretti S, Buccoliero F, Rubbini M (1990). Immunohistochemical assessment of growth fractions in colorectal adenocarcinomas with monoclonal antibody Ki–67. Relation to clinical and pathological variables. Pathol Res Pract 186: 608–18.
Lee WR, Hanks GE, Corn BW, Schultheiss TE (1995). Observations of pretreatment prostate-specific antigen doubling time in 107 patients referred for definitive radiotherapy. Int J Radiat Oncol Biol Phys 31: 21–4.
Linder S, Parrado C, Falkmer UG, Blasjo M, Sundelin P, von Rosen A (1997). Prognostic significance of Ki-67 antigen and p53 protein expression in pancreatic duct carcinoma: a study of the monoclonal antibodies MIB-1 and DO-7 in formalin-fixed paraffin-embedded tumour material. Br J Cancer 76: 54–9.
Malaise EP, Chavaudra N, Tubiana M (1973). The relationship between growth rate, labelling index and histological type of human solid tumours. Eur J Cancer 9: 305–12.

100 Tumour growth and response to radiation
Miescher G (1929). Röntgentherapie der Hautkarzinome. Schweiz Med Wochenschr II: 1225.
Munro TR, Gilbert CW (1961). The relation between tumour lethal doses and the radiosensitivity of tumour cells. Br J Radiol 34: 246–51.
Overgaard J, Matsui M, Lindegaard JC et al. (1987). Relationship between tumor growth delay and modification of tumor-control probability of various treatments given as an adjuvant to irradiation. In: Kallman RF (ed.) Rodent tumor models in experimental cancer therapy. New York: Pergamon Press, 128–32.
Petersen C, Zips D, Krause M et al. (2001). Repopulation of FaDu human squamous cell carcinoma during fractionated radiotherapy correlates with reoxygenation. Int J Radiat Oncol Biol Phys 51: 483–93.
Petersen C, Eicheler W, Frommel A et al. (2003). Proliferation and micromilieu during fractionated irradiation of human FaDu squamous cell carcinoma in nude mice. Int J Radiat Biol 79: 469–77.
Potten CS, Wichmann HE, Dobek K et al. (1985). Cell kinetic studies in the epidermis of mouse. III. The percent labelled mitosis (PLM) technique. Cell Tissue Kinet 18: 59–70.
Rautiainen E, Haapasalo H, Sallinen P, Rantala I, Helen P, Helin H (1998). Histone mRNA in-situ hybridization in astrocytomas: a comparison with PCNA, MIB-1 and mitoses in paraffin-embedded material. Histopathology 32: 43–50.
Rew DA, Wilson GD (2000). Cell production rates in human tissues and tumours and their significance. Part II: clinical data. Eur J Surg Oncol 26: 405–17.
Rofstad EK (1989). Local tumor control following single dose irradiation of human melanoma xenografts: relationship to cellular radiosensitivity and influence of an immune response by the athymic mouse.
Cancer Res 49: 3163–7.
Rofstad EK, Wahl A, Brustad T (1986). Radiation response of human melanoma multicellular spheroids measured as single cell survival, growth delay, and spheroid cure: comparisons with the parent tumor xenograft. Int J Radiat Oncol Biol Phys
12: 975–82.
Roland NJ, Caslin AW, Bowie GL, Jones AS (1994). Has the cellular proliferation marker Ki67 any clinical relevance in squamous cell carcinoma of the head and neck? Clin Otolaryngol Allied Sci 19: 13–8.
Roser F, Samii M, Ostertag H, Bellinzona M (2004). The Ki-67 proliferation antigen in meningiomas. Experience in 600 cases. Acta Neurochir (Wien) 146: 37–44.
Sarbia M, Bittinger F, Porschen R et al. (1996). The prognostic significance of tumour cell proliferation in squamous cell carcinomas of the oesophagus. Br J Cancer 74: 1012–6.
Schmid HP, McNeal JE, Stamey TA (1993). Observations on the doubling time of prostate cancer. The use of serial prostate-specific antigen in patients with untreated disease as a measure of increasing cancer volume. Cancer 71: 2031–40.
Schmidt-Ullrich RK, Contessa JN, Dent P et al. (1999). Molecular mechanisms of radiation-induced accelerated repopulation. Radiat Oncol Investig 7: 321–30.
Sinclair WK, Morton RA (1965). X-Ray and ultraviolet sensitivity of synchronized Chinese hamster cells at various stages of the cell cycle. Biophys J 5: 1–25.
Spratt JS, Meyer JS, Spratt JA (1996). Rates of growth of human neoplasms: Part II. J Surg Oncol 61: 68–83.
Steel GG (1977). The growth kinetics of tumours. Oxford: Oxford University Press.
Steel GG, McMillan TJ, Peacock JH (1989). The 5Rs of radiobiology. Int J Radiat Biol 56: 1045–8.
Suit HD, Sedlacek R, Thames HD (1987). Radiation dose–response assays of tumor control. In: Kallman RF (ed.) Rodent tumor models in experimental cancer therapy. New York: Pergamon Press, 138–48.
Taftachi R, Ayhan A, Ekici S, Ergen A, Ozen H (2005). Proliferating-cell nuclear antigen (PCNA) as an independent prognostic marker in patients after prostatectomy: a comparison of PCNA and Ki–67. BJU Int 95: 650–4.
Terry NH, White RA, Meistrich ML, Calkins DP (1991). Evaluation of flow cytometric methods for determining population potential doubling times using cultured cells. Cytometry 12: 234–41.
Thames HD, Ruifrok AC, Milas L et al. (1996). Accelerated repopulation during fractionated irradiation of a murine ovarian carcinoma: downregulation of apoptosis as a possible mechanism. Int J Radiat Oncol Biol Phys 35: 951–62.
Thor AD, Liu S, Moore DH, 2nd, Edgerton SM (1999). Comparison of mitotic index, in vitro bromodeoxyuridine labeling, and MIB-1 assays to

Further reading 101
quantitate proliferation in breast cancer. J Clin Oncol 17: 470–7.
Trott KR, Kummermehr J (1991). Rapid repopulation in radiotherapy: a debate on mechanism. Accelerated repopulation in tumours and normal tissues.
Radiother Oncol 22: 159–60.
Trott KR, Maciejewski B, Preuss-Bayer G, Skolyszewski J (1984). Dose–response curve and split-dose recovery in human skin cancer. Radiother Oncol 2: 123–9.
Urano M, Kahn J (1987). Some practical questions in the tumor regrowth assay. In: Kallman RF (ed.)
Rodent tumor models in experimental cancer therapy. New York: Pergamon Press, 122–7.
Walker AM, Suit HD (1983). Assessment of local tumor control using censored tumor response data. Int J Radiat Oncol Biol Phys 9: 383–6.
Wheldon TE, Abdelaal AS, Nias AH (1977). Tumour curability, cellular radiosensitivity and clonogenic cell number. Br J Radiol 50: 843–4.
Withers HR. The four Rs of radiotherapy. In: Lett JT, Adler H (eds) Advances in radiation biology. New York: Academic Press, 1975.
Yaromina A, Zips D, Thames HD et al. (2006). Pimonidazole labelling and response to fractionated irradiation of five human squamous cell carcinoma
(hSCC) cell lines in nude mice: The need for a multivariate approach in biomarker studies.
Radiother Oncol 81: 122–9.
Zips D, Eicheler W, Bruchner K et al. (2001). Impact of the tumour bed effect on microenvironment, radiobiological hypoxia and the outcome of fractionated radiotherapy of human FaDu squamous-cell carcinoma growing in the nude mouse. Int J Radiat Biol 77: 1185–93.
Zips D, Hessel F, Krause M et al. (2005). Impact of adjuvant inhibition of vascular endothelial growth factor receptor tyrosine kinases on tumor growth delay and local tumor control after fractionated irradiation in human squamous cell carcinomas
in nude mice. Int J Radiat Oncol Biol Phys 61: 908–14.
■ FURTHER READING
Kallman RF (1987). Rodent tumor models in experimental cancer therapy. New York: Pergamon Press.
Steel GG (1977). The growth kinetics of tumours. Oxford: Oxford University Press.