

Thermal Analysis of Polymeric Materials
.pdf6.2 Size, Extension, and Time Effects During Fusion |
647 |
___________________________________________________________________
Figure 6.65 further supports this interpretation of reversible melting at the lateral growth face with an analysis of iPP samples annealed for long times at different temperatures. The standard DSC traces were taken after the quasi-isothermal TMDSC could detect no further decrease in the apparent reversing heat capacity and were used for a measurement of the remaining crystallinity. Then, corresponding X-ray diffraction differences were taken in a temperature range of ±1.5 K after the metastable, global equilibrium was achieved in this temperature region. On the right side, Fig. 6.65 displays the normalized difference patterns of the X-ray diffraction experiments. Within experimental error, the increase in latent heat, marked in Fig. 6.64 as open squares, and the increased differential diffraction areas in Fig. 6.65 give the same changes in crystallinity [53], making it certain that the reversible melting refers to the same process seen in the irreversible melting and crystallization.
Fig. 6.65
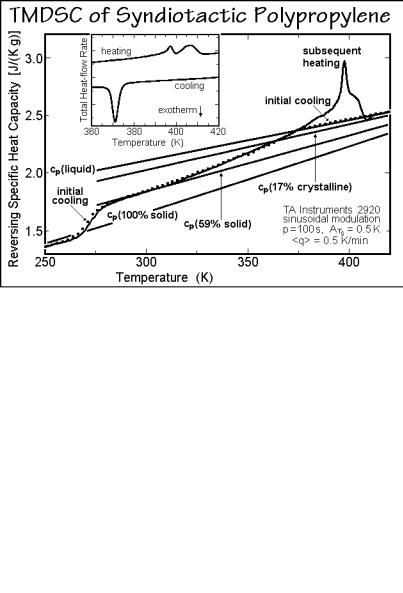
Syndiotactic polypropylene, sPP, is known almost as long as iPP, but only became readily available with high stereospecificity after the discovery of soluble, single-site, metallocene catalysts (see Sect. 3.2.1). Several semiquantitative studies are available and have been reviewed in Ref. [1]. Figure 6.66 illustrates TMDSC traces of an sPP sample of low crystallinity (and stereospecifity). The reversing cp of the semicrystalline state on initial cooling and on subsequent heating are identical. Above the low-temperature glass transition, the sample has a solid fraction of 59%. With a heat of fusion of 17%, this corresponds to an RAF of 42%. A broad glass transition of the RAF is indicated between 315 and 365 K. Above this glass transition, reversing melting is observed with both of the irreversible melting peaks showing a reversing component. The frequency dependence of the reversing heat capacity of sPP after isothermal crystallization at 363 K is shown in Fig. 6.67 [54]. At low frequency the sample shows reversing melting which at higher frequency reverts to a partially
648 6 Single Component Materials
___________________________________________________________________
Fig. 6.66
Fig. 6.67
devitrified RAF. Both iPP and sPP are thus examples with a broad devitrification of the RAF before the major melting peak. The frequency dependence of the reversing specific heat capacity of sPP over the full temperature range is displayed in Fig. 6.68 and should be compared to similar results on other polymers (see, for example, the results for nylon 6 in Figs. 4.116 and 4.119). The frequency dependence was extracted from the higher harmonics of the heating rate and heat-flow rate.

6.2 Size, Extension, and Time Effects During Fusion |
649 |
___________________________________________________________________
Fig. 6.68
Decoupling of segments of polymer chains was proposed as a mechanism for the examples of the reversing and reversible melting which are summarized with their properties in Table 6.1 [1,33]. To restate the main facts, it is shown in Figs. 3.75 and 3.91 that flexible molecules melt reversibly only up to a critical length, which for paraffins is 10 nm. Longer extended-chain crystals melt irreversibly (Figs. 3.89 and 6.28). A first observation of decoupling of melting concerns the limiting reversibility of crystals grown from a distribution of molecules of low molar mass. In this case two physical changes that should occur simultaneously are partially decoupled. The melting/mixing and crystallization/demixing are incomplete, probably due to slow diffusion in the available time. This can cause the limited reversibility seen in Figs. 6.25 and 6.35. Decoupling is also known for polymers with long side-chains, where side-chains may be largely independent of the main chain (see Sect. 7.2.3).
Locally reversing and reversible melting within a globally metastable structure of semicrystalline, flexible macromolecules also exhibit decoupling. Such decoupling allows molecular nucleation to start with crystallization of segments of the polymer chains (see Fig. 3.74). The portions of the molecules not crystallized must be considered as amorphous and belonging to a different phase. Figure 6.69 illustrates such creation of points of decoupling and a possible mechanism of reversible melting at the growth face. Figure 6.69 is linked to the molecular nucleation in Fig. 3.74. Because of the transfer of stress across the interface and along the continuing molecule, this picture also offers an explanation of the broadening of the glass transition and the creation of a separate RAF. In case Tg of the RAF is close to Tm, melting is governed by the RAF and not the crystal, as documented in Fig. 6.56.
For polyethylene, the melting point of decoupled segments can be estimated from the known Tm of folded and extended-chain crystals, given in Figs. 2.90 and 3.04, as is shown in Fig. 6.70. The bottom one of the two equations permits the computation

650 |
|
|
|
6 Single Component Materials |
|||
___________________________________________________________________ |
|||||||
Table 6.1. The reversing behavior of the various polymersa |
|
||||||
Polymer |
cold |
hot |
confor- |
RAF |
reversible |
reversing |
|
cryst. |
cryst. |
mational Cp |
(b) |
melting |
melting |
||
|
|||||||
|
|
|
|
|
|
|
|
|
|
|
|
|
|
|
|
PET |
|
|
0 |
<Tm |
|
|
|
|
|
|
|
|
|
|
|
PTT |
|
– |
|
<Tm |
|
|
|
|
|
|
|
|
|
|
|
PBT |
|
|
? |
Tm |
|
|
|
|
|
|
|
|
|
|
|
PEN |
|
– |
|
<Tm |
|
|
|
|
|
|
|
|
|
|
|
PEEK |
– |
|
|
<Tm |
|
|
|
|
|
|
|
|
|
|
|
PC |
|
– |
0 |
Tm |
0(?) |
|
|
|
|
|
|
|
|
|
|
PPO |
– |
– |
0 |
>Tm |
0 |
0 |
|
|
|
|
|
|
|
|
|
PTFEc |
– |
|
? |
Tg |
|
|
|
|
|
|
|
|
|
|
|
nylon 12 |
– |
|
|
Tg |
|
|
|
|
|
|
|
|
|
|
|
nylon 6 |
– |
|
|
Tg |
|
|
|
|
|
|
|
|
|
|
|
PHB |
|
– |
0 |
<Tm |
|
|
|
|
|
|
|
|
|
|
|
PCL |
– |
|
0 |
Tg |
|
|
|
|
|
|
|
|
|
|
|
POM |
– |
– |
0 |
Tm |
– |
– |
|
|
|
|
|
|
|
|
|
POE |
– |
|
|
Tg |
|
|
|
|
|
|
|
|
|
|
|
POTM |
– |
|
|
Tg |
|
|
|
|
|
|
|
|
|
|
|
PPDX |
|
– |
0 |
Tg |
|
|
|
|
|
|
|
|
|
|
|
iPP |
|
|
0 |
<Tm |
|
|
|
|
|
|
|
|
|
|
|
sPP |
– |
|
0 |
<Tm |
|
|
|
|
|
|
|
|
|
|
|
PE |
– |
|
|
Tg |
|
|
|
|
|
|
|
|
|
|
|
PE-alt-CO |
|
|
0 |
Tg |
|
|
|
|
|
|
|
|
|
|
|
|
|
|
|
|
|
|
|
aindicates “yes”; 0, “no”; –, not discussed or measured; ?, “questionable.” The table has been adapted from [1].
bTg of the RAF below (<), up to ( ), at ( ), or above (>) the melting temperature, Tm; Tg indicates a broadening of the glass transition only.
cOnly the low temperature transitions of PTFE have been analyzed (see Fig. 5.31). See Sect. 5.5 also for TMDSC of other mesophase transitions.

6.2 Size, Extension, and Time Effects During Fusion |
651 |
___________________________________________________________________
Fig. 6.69
Fig. 6.70
of the extended-chain length of the decoupled segment. Inserting its melting temperature into the upper equation instead of 414.2 K (the melting temperature of the extended-chain crystal of infinite length) and correcting the melting point lowering (in brackets) for the fraction of the surface covered with chain folds, yields the shown curves. (For one fold, the correction factor for the term in brackets is 0.50, for two folds, 0.67, for three, 0.75, for four, 0.80, and for five, 0.83.)
652 6 Single Component Materials
___________________________________________________________________
Poor crystals of polymers which are susceptible to reversing melting are either small, nanophase-separated crystals, as just discussed, or may be conformationally disordered. The conformationally disordered crystals are mesophases, described in Sect. 5.5. The reversing and reversible melting of the mesophases depends on the mobility within the crystal, as seen from Figs. 5.131, 5.144, and 5.154. Liquid crystals are likely to have fully reversible transitions within the time scale of calorimetry, while the condis phases are sufficiently rigid to show less reversing behavior and are closer in their behavior to the small polymer crystals with their slow crystal perfection due to melting and recrystallization and reversibility on the growth faces.
Quenching from the melt or solution can lead directly to glasses (see Sect. 6.3), to small crystallites, dendrites, and spherulites (see Figs. 5.56, 5.60, and 5.75), or to mesophase glasses (see Fig. 5.146). Small crystals are also found on cold crystallization of a glass by growing crystals as little above the glass-transition temperature as possible and by drawing of fibers or other deformations (see Sects. 5.2.6 and 5.3.5). In addition, by partial crystallization at higher temperature it is possible to set up a network of larger crystals, separated by amorphous defects, as described by Fig. 5.87. On cooling, these amorphous defects may generate a second population of poor crystals, observed calorimetrically in the form of “annealing peaks” (see Sect. 6.2.5). In all these cases there is a chance to set up a configuration for locally reversible melting and crystallization. One expects these poorly grown crystals to be close to a fringed-micellar structure, schematically shown in Fig. 5.42, with many of the molecular chains being decoupled into crystals and amorphous segments.
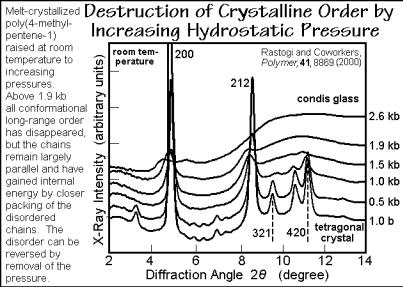
A unique method to generate poor crystals is shown in Fig. 6.71. It involves the compression of crystals of poly(4-methyl-1-pentene), P4MP1, with a glass transition Tg = 303 K, melting transition Tmo = 523 K, and a heat of fusion of Hf = 10 kJ mol 1 (see also Fig. 5.124). At room temperature, the tetragonal crystals of P4MP1 have a
Fig. 6.71
6.2 Size, Extension, and Time Effects During Fusion |
653 |
___________________________________________________________________
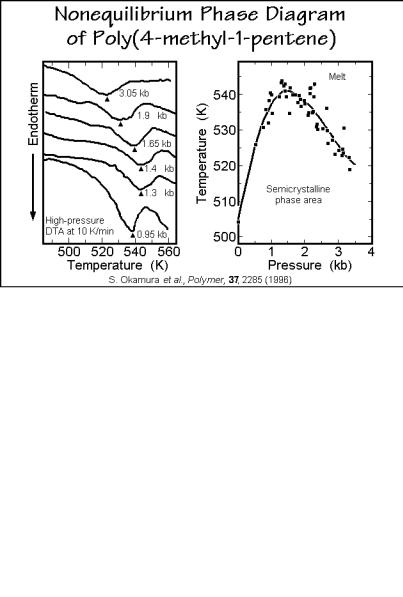
lower density than the surrounding amorphous phase. The rather open helical conformation 2*7/2 for P4MP1 is the reason for the poor packing in the crystals at room temperature, compared to the amorphous phase. Increasing the temperature expands the amorphous phase faster than the crystals, so that at Tm the crystals are somewhat denser. The change of Tm as a function of pressure is shown in Figs. 6.72 and 6.73. After the initial, expected increase with pressure, Tm decreases.
Fig. 6.72
Fig. 6.73
654 6 Single Component Materials
___________________________________________________________________
This unique behavior of the melting temperature with pressure indicates that increasing the pressure reverses the density difference in a similar manner as decreasing the temperature. At the maximum of the Tm versus p curve in Fig. 6.73, the difference in molar volume between melt and crystal is zero, leading to a pressure of coefficient of zero in the Clausius-Clapeyron equation discussed in Sect. 5.6.5 and written in Fig. 5.168. In Fig. 6.73 a phase diagram for the various states is drawn based on high-pressure calorimetry. Only the melt appears as a true equilibrium phase. All other phase areas are semicrystalline, i.e., do not follow the phase rule (see Sect. 2.5.7). Because Fig. 6.73 does not represent equilibrium, it can mirror the actual processes. All exotherms and endotherms, except for melting, are small (0.5 to 2 J/g), indicating that at the transitions, the changes in entropy of the phases are small. Major crystallization and melting, thus, is not possible.
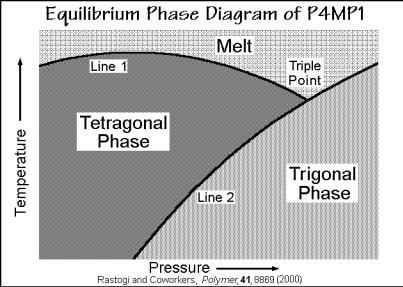
The nonequilibrium states were identified and seem to be initiated in close concert with the existence of the glass transition of the majority glassy phase identified in Fig. 6.73. Isothermal disordering at room temperature along the horizontal arrow causes a transition to the condis glass on the right of the extrapolated phase boundary. It seems to be a frustrated tetragonal to trigonal transition. Although superficially showing an amorphous X-ray pattern in Fig. 6.71, the condis glass retains most of its heat of fusion and acquires largely sessile backbone and side-chain conformational defects. This disordering can be reversed by reduction of pressure. Based on Fig. 6.73 one can speculate that the equilibrium phase-diagram is as given in Fig. 6.74. The tetragonal phase is the stable crystal. The trigonal crystal form with a 2*3/1 helix conformation, common for vinyl polymers with smaller side chains (see Fig. 5.14), exists as the low-temperature, high-pressure phase. As expected from a high-pressure, low-temperature phase, it is denser than the trigonal crystals. Neither of the two equilibrium polymorphs has dynamic conformational disorder.
Fig. 6.74
6.2 Size, Extension, and Time Effects During Fusion |
655 |
___________________________________________________________________
6.2.3 Annealing and Recrystallization Effects
The word annealing derives from the Anglo-Saxon ælan, to bake or burn, and the prefix an, on. It was used to describe the burning-on of a glaze or enamel on ceramics and metals, and furthermore the strengthening, hardening, or toughening by heating. In the polymer field, the term implies imparting of a certain (advantageous) property by heat treatment without large-scale melting. If large-scale melting of crystals is involved in the process and renewed crystallization occurs before the whole sample turns liquid, the process is called recrystallization rather than annealing. Naturally, both processes may occur at the same time in a semicrystalline sample. Glassy polymers are mainly annealed close to the glass transition for strain release and densification (see Sect. 6.3), while crystalline polymers perfect their internal structure and their morphology on annealing (see Sects. 5.1–3). Crystal structure and morphology are best assessed by X-ray diffraction and electron microscopy, while the change in macroscopic properties is, as usual, best tested by thermal analysis.
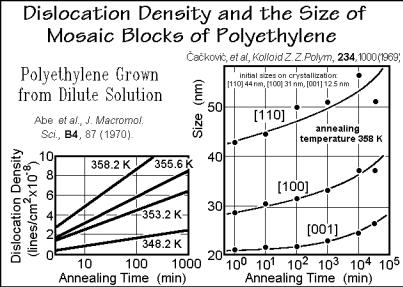
Point defects and dislocations are shown in Sect. 5.3 to appear as nonequilibrium defects, usually introduced during crystal growth or deformation, and as equilibrium defects, generated thermally. The dislocation density can be determined by the moiré method (see Appendix 17 and Fig. 5.93). On annealing of crystals above their crystallization temperature, the nonequilibrium dislocation density increases, as is demonstrated in the left graph of Fig. 6.75. Since the number of such nonequilibrium
Fig. 6.75
defects cannot increase by annealing without a cause which more than compensates their metastability, one assumes that the cause is a change in the packing within the crystals or between the lamellae that cause the moiré pattern. The right graph in Fig. 6.75 illustrates, based on X-ray diffraction, that the mosaic dimensions, indeed,
656 6 Single Component Materials
___________________________________________________________________
increase on annealing in the crystallographic a and b directions (see Figs. 5.18 and 5.19). A fast, but small adjustment from 12.5 to 20 nm in fold length occurs within the first minute along [001] (compare to the initial dimension, and see also Fig. 6.34). The following long-time annealing affects all dimensions of the crystals.
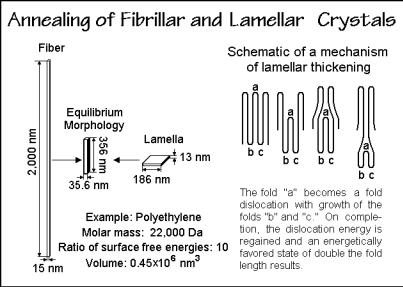
On a larger scale, crystals of polymers were shown in Sect. 5.2 to commonly have a fibrillar or lamellar morphology. Neither of these is an equilibrium shape. Figure 6.76 illustrates how these nonequilibrium morphologies would have to change to reach an equilibrium shape. More detailed studies are available for the thickening of the lamellar crystals. It involves an increase of fold-length by a mechanism as displayed by the right-hand sketch in Fig. 6.76. The intermediate states have only a small
Fig. 6.76
increase in free enthalpy which acts as an activation energy for the process to the more stable state. Actual observation of the thickening is seen in Fig. 6.77. Separated lamellae develop holes with rims of about double the original thickness. From the dimension of the rims, it can be estimated that for each growth plane that crosses the hole, only one molecule thickens in the early stages of annealing. The graph in Fig. 6.77 indicates that annealing speeds up above 395 K. The crystals become more irregular and have more than twice the fold length. A hole in one lamella is naturally an ideal position for the adjacent lamella to thicken into.
The electron micrograph of Fig. 6.78 depicts melt-grown polyethylene lamellae of thicknesses of 18 22.5 nm, grown at 403 K on the surface of the (110) growth face of an extended-chain crystal, as seen in Fig. 5.76 and 5.77 [24]. This substrate lets one see the growth face of the folded-chain lamellae. In the bottom of the figure the lamellae were annealed below the melting temperature of the substrate, at 411.6 K, for 18 h. The lamellae are now irregular and show thicknesses of 27 to 45 nm. The underlying extended chain crystals are little affected by the annealing.