

Material tab section
The value that you set for Release height from vessel bottom is below the Tank liquid level that the program calculated when you completed the tank shape data. This means that the initial phase released will be liquid, so the Calculated phase to be released is given as Liquid (release below liquid level).
Short pipe tab section
The Short pipe tab section contains details for the modelling of frictional losses. Leave the pipe roughness with the default value taken from the Parameters, and leave the numbers of valves as zero. There is one bend in the 9 m of pipework, so you should set the Frequency of bends in pipe to 0.11 per m.
Time varying releases tab section
For a newly-inserted Time varying Scenario, the Method for calculating the average rate is set to Average between 2 times, with the times set to 0 s and 20 s.
Leave the tab section with these values. You will perform an initial run of the discharge calculations, then examine the results and decide on the most appropriate way to represent the behaviour for the rest of the consequence analysis, which may involve changing these settings.
This completes the input data for this stage, and you can click on OK to close the input dialog.
Running the discharge calculations
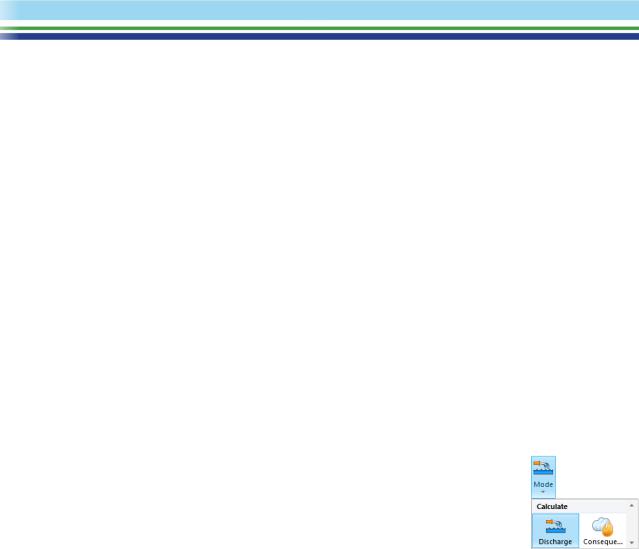
Before you run the calculations, use the Mode option in the Home tab of the Ribbon Bar to change the run mode from Consequence to Discharge. With this setting, the program will run the discharge calculations only, and will not then proceed to the dispersion and effects calculations.
Select the time-varying Scenario and then click on Run to perform the calculations. For some Scenarios the time-varying discharge calculations can be time-consuming, but for this Scenario they should run in about a minute.
When the results are complete, view the Graphs. The Flowrate Graph shows that the rate drops by about 1% in an hour of release, which means that the time-varying behaviour can be ignored for this release.
If the time-varying discharge calculations for a Scenario are time-consuming, you can make the analysis easier to work with if you bypass the time-varying discharge modelling for the hazardous event. There are two possibilities in this situation:
Using the averaged discharge results to create a User-defined source Scenario
Most of the Scenarios for a Pressure Vessel perform in-built discharge calculations to determine the state of the material after expansion to atmospheric pressure, which is the state required for the start of the dispersion calculations. However, the User-defined source Scenario is also available: this Scenario does not perform discharge calculations, but instead allows you to specify directly the state of the material after expansion to atmospheric pressure. You use it if you want greater control over the inputs to the dispersion and effect calculations, as will be described later in this chapter.
| PHAST | April 2018 | www.dnvgl.com/software |
Page 32 |
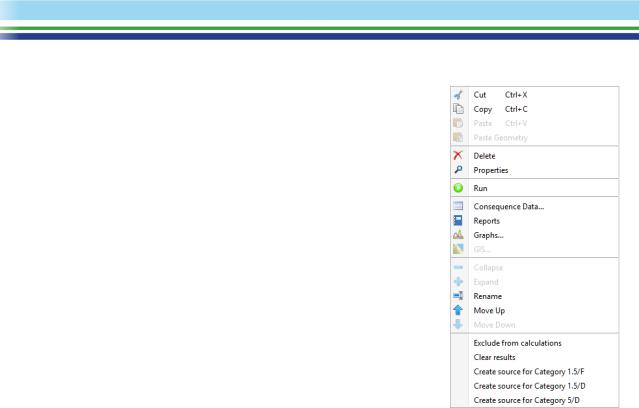
When you performed the discharge calculations, the program calculated the average rate over the first 20 s, and this is the representative rate given in the Discharge Report. If you decide that you want to use this average rate rather than the initial rate, you should right-click on the Scenario, and then select the first Create source option from the bottom of the right-click menu as shown.
There is a separate Create source option for each Weather for which you performed the discharge calculations. For this Scenario, the results will be the same for all Weathers, and when you select the Weather the program will create a User-defined source Scenario with the name User defined source for Category 1.5/F .
The dialog for the User-defined source Scenario does not include the Short pipe or Time varying release tab sections, and instead of containing fields for the pipe diameter and length, the Scenario tab section contains a Release segments table in which you specify the discharge rate and conditions directly, since the User-defined source Scenario does not perform any discharge modelling itself. The Scenario
will be created with discharge data taken from the averaged results from the Time varying Scenario, but you can edit these values if you choose.
Inserting a Short pipe Scenario and set up the equivalent input data
The Short pipe Scenario models the same type of hazardous event as the Time-varying short pipe release Scenario, but it calculates the initial discharge rate, without performing any time-varying discharge modelling. Inserting this Scenario involves repeating some of the data-input, but this is the approach taken in this tutorial as it will make the analysis clearer and easier to maintain: if you need to change some aspect of the input data you can edit the Scenario and rerun the calculations, whereas if you used a User-defined release Scenario you would have to edit and rerun the Time-varying Scenario first, then create a new User-defined release Scenario, and delete the previous User-defined release Scenario.
Before you insert the Short pipe Scenario, rename the Time varying Scenario to add “- time-varying not needed” at the end of the name, and then right-click on the Scenario and select Exclude from calculations from the menu. The Scenario will become greyed out in the tree and will not be included if you run the calculations for the Pressure Vessel or Study, which will make the calculations quicker.
| PHAST | April 2018 | www.dnvgl.com/software |
Page 33 |