

5.2. Frequency separation
Each segment is transformed to the frequency domain using an FFT of length N (N = 4096 for a sampling rate fs of 44.1 kHz). The frequency-domain signals X1[k], X2[k] (k = [0, 1, . . . , N/2]) are divided into nonoverlapping subbands by grouping of FFT bins. The frequency bands are formed in such a way that each band has a bandwidth, BW (in Hz), which is approximately equal to the equivalent rectangular bandwidth (ERB) [40], following
BW = 24.7(0.00437 f + 1), (1)
with f the (center) frequency given in Hz. This process results in B = 34 frequency bands with FFT start indices kb of subband b (b = [0, 1, . . . , B − 1]). The center frequencies of each analysis band vary between 28.7Hz (b = 0) to 18.1 kHz (b = 33).
5.3. Parameter extraction
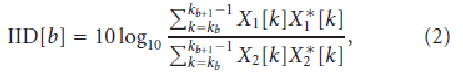
For each frequency band b, three spatial parameters are computed. The first parameter is the interchannel intensity difference (IID[b]), defined as the logarithm of the power ratio of corresponding subbands from the input signals:

where ∗ denotes complex conjugation. The second parameter is the relative phase rotation. The phase rotation aims at optimal (in terms of correlation) phase alignment between the two signals. This parameter is denoted by the interchannel phase difference (IPD[b]) and is obtained as follows:


Рис3: Пространственный анализ и процедура даунмикса в кодере.
Если переходный процесс обнаружен в определенном временном интервале, применяется переходное окно переменной длины, заканчивающееся прямо перед переходным процессом. Сам же переходный процесс охватывается очень маленьким окном (порядка нескольких миллисекунд). После этого применяется следующее переходное окно, чтобы привести сегментацию к той же временной сетке, что и до переходного процесса.

Рис.4: Схематическое представление динамического переключения окон в случае переходного процесса. Окна переходной длины расположены до и после него. А сам процесс охвачен узким окном.
5.2. Частотная сегментация
Каждый сегмент преобразуется в частотную область с помощью N –точечного БПФ (N=4096 для частоты дискретизации fs =44.1 кГц). В частотной области сигналы X1[k], X2[k] (k = [0, 1, . . . , N/2]) делятся на неперекрывающиеся субполосы путем группировки элементов БПФ. Частотные полосы формируются так, чтобы у каждой полосы была ширина BW в Гц, примерно равная эквивалентной прямоугольной ширине полосы (ERB) [40], далее примем
![]()
С центральной частотой f, заданной в Гц. В результате чего получим B = 34 частотных полос с начальными индексами БПФ kb для субполос b (b = [0, 1, . . . , B − 1]). Центральные частоты полос анализа изменяются от 28.7 Гц (b = 0) до 18.1 кГц (b = 33).
5.3. Определение параметров.
Для каждой полосы частот b вычисляются три пространственных параметра. Первый параметр – межканальная разность интенсивностей (IID[b]) – определяется как логарифм отношения мощностей соответствующих субполос входных сигналов:
Где * означает комплексное сопряжение. Второй параметр – относительный сдвиг фаз. Он нужен для оптимального (на основе корреляции) соотношения фаз между двумя сигналами. Этот параметр определяется межканальной разностью фаз (IPD[b]) и определяется так:

Using the IPD as specified in (3), (relative) delays between the input signals which are represented as a constant phase difference in each analysis frequency band, hence result in a fractional delay. Thus, within each analysis band, the constant slope of phase with frequency is modeled by a constant phase difference per band, which is a somewhat limited model for the delay. On the other hand, constant phase differences across the input signals are described accurately, which is in turn not possible if an ITD parameter (i.e., a parameterized slope of phase with frequency) would have been used. An advantage of using IPDs over ITDs is that the estimation of ITDs requires accurate unwrapping of bin-by-bin phase differences within each analysis frequency band, which can be prone to errors. Thus, usage of IPDs circumvents this potential problem at the cost of a possibly limited model for ITDs.
The third parameter is the interchannel coherence (IC[b]), which is, in our context, defined as the normalized cross-correlation coefficient after phase alignment according to the IPD. The coherence is derived from the cross-spectrum in the following way:
