Книги по МРТ КТ на английском языке / MR Imaging in White Matter Diseases of the Brain and Spinal Cord - K Sartor Massimo Filippi Nicola De Stefano Vincent Dou
.pdf
284 |
S. J. Hickman and D. H. Miller |
was present then a glioma or meningioma should be |
The combined CSF and fat suppression of SPIR- |
suspected (Cornblath and Quint 1997). However, |
FLAIR imaging has allowed optic nerve atrophy to be |
in a further study of acute optic neuritis using STIR |
detected qualitatively following optic neuritis. Inter- |
imaging, swelling was reported in 12 out of 40 cases |
observer assessment of optic nerve size was 1.0 using |
(40%) with, and in four out of 26 cases (15%) with- |
a weighted Cohen κ test for SPIR-FLAIR compared |
out canalicular involvement (Kapoor et al. 1998). |
with 0.85 for SPIR and 0.61 for STIR (sequences which |
Also, using formal measurement of optic nerve size |
were not CSF suppressed) (Jackson et al. 1998). |
with callipers from the intraorbital optic nerve on |
Inglese et al. (2002) imaged 30 patients with re- |
hard copy STIR images from ten patients, Youl et |
lapsing-remitting and secondary progressive MS |
al. (1996) reported that the mean area of symptom- |
who had had a previous episode of optic neuritis. A |
atic optic nerves with acute optic neuritis (mean |
T1-weighted spin echo sequence was used. The mean |
disease duration 6 days) was 20.0 mm2 compared |
volume of the optic nerves was calculated from the |
with 14.4 mm2 for asymptomatic contralateral op- |
mean areas from 11 slices using a local threshold- |
tic nerves (p=0.001). After a mean follow-up period |
ing segmentation technique. The mean volume was |
of 28 days the mean area of the symptomatic optic |
93.3 ml in 18 age-matched controls, 89.2 ml for clini- |
nerves had decreased to 15.5 mm2 (p=0.01) whereas |
cally healthy nerves from patients (n=18), 89.4 ml for |
the asymptomatic optic nerves had a mean area |
diseased optic nerves with visual recovery to at least |
of 14.1 mm2 (p=not significant [n.s.]). Both visual |
20/25 (n=20), 79.0 ml for diseased optic nerves with |
acuity and VEP amplitudes improved on follow-up, |
vision worse than 20/25 (n=22) (p=0.002, versus op- |
although VEP latencies showed no significant im- |
tic nerves with good recovery) and 82.0 ml for optic |
provement. This suggested that resolution of acute |
nerves from patients with Leber’s hereditary optic |
inflammation was associated with resolution of optic |
neuropathy (LHON) (n=20). Optic nerve volume |
nerve swelling. |
from MS patients was correlated with both visual acu- |
|
ity (rS=0.39, p=0.01) and VEP P100 latency (rS=–0.31, |
19.5.2.2 |
p=0.05). The functional significance of optic nerve |
Optic nerve atrophy |
atrophy was therefore apparent although the correla- |
|
tions were modest. The volumes of optic nerves from |
An expected end result of demyelination and axonal |
MS patients with poor recovery were similar to those |
loss is atrophy of tissue. Measurement of atrophy may |
from patients with LHON, a condition where axonal |
help in the quantification of the amount of tissue de- |
loss has been demonstrated histologically (Saadati |
struction and help in studies investigating disability |
et al. 1998). |
in MS. There have been many studies of brain atro- |
In a study of 17 patients who had had a previous |
phy in MS using MRI (Losseff et al. 1996; Simon et |
single episode of unilateral optic neuritis Hickman |
al. 1999). Being able to quantify the degree of optic |
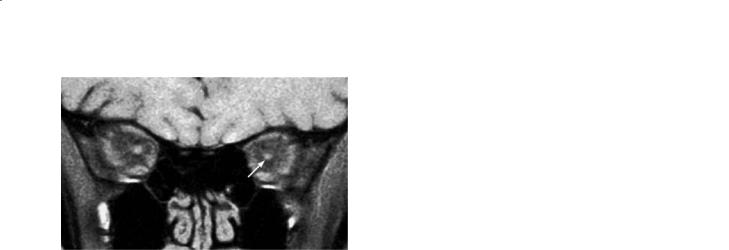
et al. (2001) evaluated a coronal-oblique fat saturated |
nerve atrophy following optic neuritis would be use- |
short echo fast fluid attenuated inversion recovery |
ful since optic neuritis is a model for the effects of |
(sTE fFLAIR) sequence for the measurement of optic |
lesions in MS.This is technologically very demanding |
nerve area. This sequence has potential advantages as |
for the reasons outlined above. |
it is CSF and lipid suppressed with low T2-weighting. |
Youl et al. (1996) also studied 22 patients with |
The mean cross-sectional area of the intra-orbital |
a mean disease duration of 60 days. Optic nerve |
portion of both optic nerves was 11.2 mm2 in diseased |
mean area in both symptomatic and asymptomatic |
eyes,12.9 mm2in the contralateral eyes (p=0.006 com- |
nerves was 16.8 mm2. After a mean of 405 days the |
pared with the diseased eye) and 12.8 mm2 in con- |
patients were re-imaged. The mean area of symp- |
trols (p=0.03 compared with the patients’ diseased |
tomatic nerves decreased to 12.8 mm2 (p<0.001) |
eyes) (Fig. 19.5). There was a significant negative cor- |
and the asymptomatic nerves to 16.3 mm2 (p=n.s.). |
relation between disease duration and the size of the |
This was despite improvement in visual acuity, VEP |
diseased optic nerve (r=-0.59, p=0.012). |
amplitude (p=0.03) and VEP latency (p=n.s.) in the |
At 1 year follow-up in a subgroup of patients, some |
affected eyes. The STIR sequence Youl et al. (1996) |
years following the acute event in many, it was dem- |
used had the disadvantages of low resolution (pixel |
onstrated that the mean area of diseased optic nerves |
size 1.2×0.6 mm), the presence of high signal from |
decreased from 11.1 mm2 to 10.2 mm2 (p=0.01). |
CSF obscuring the edge of the optic nerve and the |
Baseline visual acuity (p=0.02),decreasedVEP ampli- |
inclusion of optic nerve sheath leading to an overes- |
tudes (rS=0.65, p=0.02) and increased VEP latencies |
timation of optic nerve area. |
(rS=–0.61, p=0.04) were associated with optic nerve |


Primary Angiitis of the Central Nervous System |
291 |
Immune-Mediated Disorders