

ius-2013_en
.pdfInnovation Union Scoreboard 2013 |
59 |
|
Switzerland is one of the innovation leaders with an above average performance. Relative strengths are in Open, excellent and attractive research
systems, Intellectual assets and Innovators. Relative weaknesses are in Finance and support and Linkages & entrepreneurship.
Indicator values relative to the EU27 (EU27=100)
High growth is observed for Sales of new-to-market and new-to-firm innovations. A relatively strong decline is observed for Venture capital investments, SMEs innovating in-house and Innovative SMEs
collaborating with others. Growth performance in Firm investments and Economic effects is well above average and in Finance and support and Linkages & entrepreneurship well below average.
Annual average growth per indicator and average country growth
60 |
Innovation Union Scoreboard 2013 |
|
|
|
|
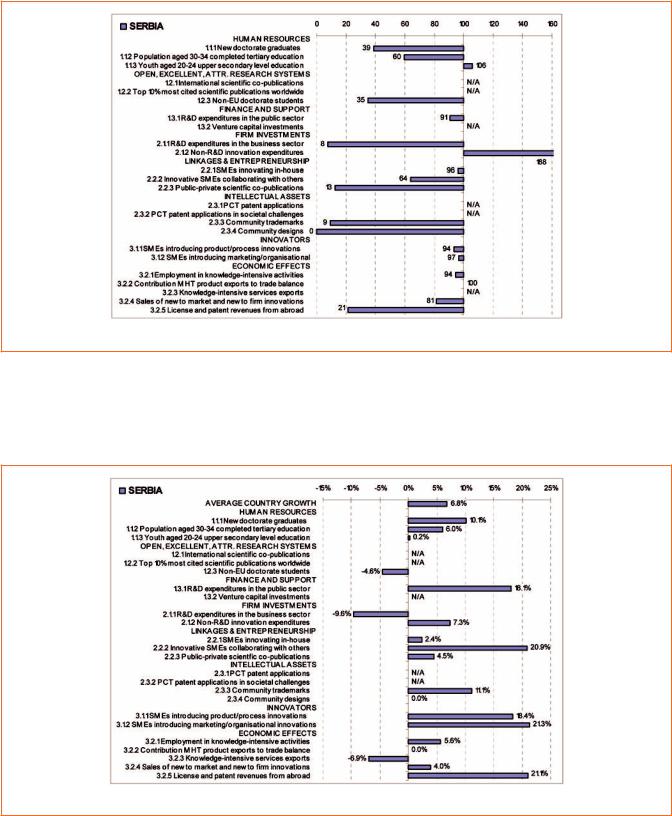
Serbia is one of the moderate innovators with a below average performance. Relative strengths are
in Finance and support and Innovators. Relative weaknesses are in Intellectual assets.
Indicator values relative to the EU27 (EU27=100)
High growth is observed for R&D expenditure in the public sector, Innovative SMEs collaborating with others, SMEs introducing product or process innovations, SMEs introducing marketing or organisational innovations and License and patent revenues from abroad. A
strong decline is observed for R&D expenditures in the business sector and Knowledge-intensive services exports. Growth performance in Finance and support and Innovators is well above average and in Open, excellent and attractive research systems below average.
Annual average growth per indicator and average country growth

Innovation Union Scoreboard 2013 |
61 |
|
The Former Yugoslav Republic of Macedonia is one of the modest innovators with a below average performance. Relative strengths are in Innovators
and Economic effects. Relative weaknesses are in Finance and support, Linkages & entrepreneurship and Intellectual assets.
Indicator values relative to the EU27 (EU27=100)
High growth is observed for New doctorate graduates and Population aged 30-34 with completed tertiary education. A strong decline is observed for Public-private scientific co-publications.
Growth performance in Human resources and Open, excellent and attractive research systems is well above average and in Linkages & entrepreneurship well below average.
Annual average growth per indicator and average country growth

62 |
Innovation Union Scoreboard 2013 |
|
|
|
|
5. Innovation at the regional level
5.1. Regional Innovation Scoreboard
The IUS report is accompanied by the comparable analysis at the regional level: the Regional Innovation Scoreboard (RIS). The RIS 2012 provides a comparative assessment of innovation performance across NUTS 1 and NUTS 2 regions of the European Union, Croatia, Norway and Switzerland8. The RIS 2012 replicates the methodology used at national level in the Innovation Union Scoreboard (IUS), using 12 of the 24 indicators used in the IUS for 190 regions across Europe.
Four regional performance groups
The main results of the grouping analysis are summarised in Figure 23, which shows four regional performance groups similar to those identified in
the Innovation Union Scoreboard, ranging from Innovation leaders to Modest innovators.
There is considerable diversity in regional innovation performances
The results show that most European countries have regions at different levels of performance (Figure 23). In France and Portugal we observe at least one region in each of the 4 broader performance groups. Czech Republic, Finland, Italy, Netherlands, Norway, Spain, Sweden and the UK have at least one region in 3 different performance groups. This regional diversity in innovation performance also calls for regional innovation support programmes better tailored to meet the needs of individual regions.
Figure 23: Regional performance groups
The EU Member States Cyprus, Estonia, Latvia, Lithuania, Luxembourg and Malta are not included in the RIS analysis. Group membership shown is that of the IUS. Map created with Region Map Generator.
8 The RIS 2012 report and the RIS 2012 Methodology reports are available at:
http://ec.europa.eu/enterprise/policies/innovation/policy/regional-innovation/index_en.htm

Innovation Union Scoreboard 2013 |
63 |
|
The most innovative regions are typically in the most innovative countries
Most of the regional innovation leaders and innovation followers are located in the country leaders and followers identified as such in the Innovation Union Scoreboard. The results do highlight several regions in weaker performing countries being much more innovative such as Praha, an innovation leader, in the Czech Republic (a moderate innovator); Attiki, an innovation follower, where Greece is a moderate innovator; Lisboa, an innovation leader, in Portugal (a moderate innovator); Bucuresti – Ilfov, a moderate innovator, in Romania (a modest innovator); East of England and South East (UKJ) are innovation leaders within the UK (an innovation follower); and Sjeverozapadna Hvratska (Zagreb), an innovation follower, in Croatia (a moderate innovator).
Regions have different strengths and weaknesses
Three groups of regions can be identified based on their relative performance on Enablers, Firm activities and Outputs. The majority of innovation leaders and high performing innovation followers are characterised by a balanced performance structure whereas the majority of the moderate and modest innovators are characterised by an imbalanced performance structure. Regions wishing to improve their innovation performance should thus pursue a more balanced performance structure.
Regional research and innovation potential through EU funding
A complementary analysis in the RIS 2012 has studied the relationship between use of two main EU funding instruments and innovation performance: the Framework Programmes for Research and Technological Development (FP6 and FP7) and the Structural Funds (SF).
There are remarkable differences in the use of EU funds across EU regions. There are four typologies of regions absorbing and leveraging EU funds:
•Framework Programme leading absorbers with low use of Structural Funds for business innovation and medium-to-high participation in Framework Programmes;
•Structural Funds leading users with high use of Structural Funds for business innovation and low participation in Framework Programmes;
•Full users/absorbers with medium use of Structural Funds for business innovation and low participation in Framework Programmes;
•Low users/absorbers with low use of Structural Funds for business innovation and low participation in Framework Programmes.
The majority of European regions are low users/ absorbers (63%), followed by full users/absorbers (17%), FP leading absorbers (15%) and SF leading users (6%).
The results suggest that Structural Funds and Framework Programmes are complementary types of funding targeting a rather specific, but comparatively different set of regions. Whereas capital regions in the EU15 are largely FP leading absorbers or low users/absorbers in both periods, there is not much differentiation between capital regions and all other regions in the EU12.
The results show a relatively even distribution of shares of high, medium and low innovators in low absorber/user regions and full absorber/user regions. A majority of FP leading absorbers in FP6 were innovation leaders or innovation followers in 2007 and 2011. In contrast, a majority of all SF leading user regions in the period 2000-06 were also modest innovators in 2007 and 2011. The results show a lack of common characteristics/patterns linking innovation performance and the use of EU funds in regions across time.
64 |
Innovation Union Scoreboard 2013 |
|
|
|
|
5.2. Regional innovation and socio-economic performance
There is an alleged positive relationship between innovation and socio-economic performance. The exploratory report “Regional innovation and socio-economic performance” shows that, on average, more innovative regions enjoy higher levels of development (as measured by GDP per capita), higher levels of labour productivity, higher employment rates, and (to a lesser extent) lower energy usage. There is also evidence to suggest that more innovative regions also have lower proportions of early school leavers. These findings reinforce existing knowledge on the benefits of formulating policies encouraging innovation.
Another policy-relevant finding emerges from splitting regions into high and low income. On average, high income regions have a weaker degree of association between innovation performance and all the socio-economic performance measures then low income regions. This suggests that low income regions gain proportionately more from innovation (perhaps due to the benefits of being able to harvest so-called “low hanging fruit”) than high income
regions. Policies stimulating innovation in low income regions are expected to encourage these regions to “catchup” with higher-income regions.
When the analysis is changed to looking at growth rates most of the previously-identified associations are not significant. This could indicate that the levels analysis was merely identifying spurious or related correlations, but given the short time periods over which growth rates could be calculated it is not possible to be certain about this. To establish any conclusive evidence on cause-and- effect relationships, longer time series are needed. It is also remarkable that there is not a wider availability for key regional indicators on energy and the environment (or income distribution). While targets are largely set at EU and national levels, it is equally important to understand and investigate the wide degree of heterogeneity at subnational level.
5.3. Regional research cooperation patterns of SMEs
In particular for SMEs research collaboration with public partners is important: according to the 2010 Community Innovation Survey about 7% of innovative SMEs acknowledge collaboration with universities or higher education institutions, where 4% collaborate with government research institutes or public sector research institutes. The exploratory report “Research cooperation patterns of European SMEs” describes general patterns within ‘public-private co-publications’ (PPCs) focusing on the spatial distribution of SMEs public sector collaboration partners within and across regional and national borders and reveals interconnected spatial proximity structures at different geographical scales.
Almost 90% of SME-produced research publications were co-produced with public sector partners. There are large and structural disparities EU27 regions in terms of connectivity to public sector research partners with. Collaboration shares differ by country and appear to partially depend on the number of innovative SMEs within a country. Europe’s smallest countries – Malta and Cyprus - have shares of 95% or more. The share within the two largest countries - Germany and the UK
- is less than 80%. SMEs clearly prefer domestic public partners, which constitute 57% of all public partnerships. Public partners in other EU27 countries account for 27%, while the remainder of the public partners are based outside the EU27 (but often still within Europe).
A geographical breakdown of PPCs shows the following breakdown by geographic zone: intra-regional ‘local’ partners account for 31% of all co-publication partners; domestic partners in other regions represent 33%, those within other EU27 countries represent 20%, while partners outside the non-EU27 contribute 17%. These results show that defining geographical proximity in terms of NUTS2 regions might misrepresent in what appears to be an increasingly geographically dispersed and ‘networked’ reality among research active SMEs, where companies seem to operate at a large scale across regional and national boundaries. Regional public-private research collaborations are in all likeli¬hood, an almost undistinguishable part of domestic or even international R&D networks.

Innovation Union Scoreboard 2013 |
65 |
|
6. Technical annex
6.1. Calculating composite scores
The overall innovation performance of each country has been summarized in a composite indicator (the Summary Innovation Index). The methodology used for calculating this composite innovation indicator will now be explained in detail.
Step 1: Identifying and replacing outliers
Positive outliers are identified as those relative scores which are higher than the mean across all countries plus 2 times the standard deviation. Negative outliers are identified as those relative scores which are smaller than the mean across all countries minus 2 times the standard deviation. These outliers are replaced by the respective maximum and minimum values observed over all the years and all countries.
Step 2: Setting reference years
For each indicator a reference year is identified based on data availability for all countries for which data availability is at least 75%. For most indicators this reference year will be lagging 1 or 2 years behind the year to which the IUS refers. Thus for the IUS 2013 the reference year will be 2010 or 2011 for most indicators (cf. Table 1).
Step 3: Imputing for missing values
Reference year data are then used for “2012”, etc. If data for a year-in-between is not available we substitute with the value for the previous year. If data are not available at the beginning of the time series, we replace missing values with the latest available year. The following examples clarify this step and show how ‘missing’ data are imputed. If for none of the years data is available, no data will be imputed (the indicator will be left empty).
Step 4: Determining Maximum and Minimum scores
The Maximum score is the highest relative score found for the whole time period within all countries excluding
positive outliers. Similarly, the Minimum score is the lowest relative score found for the whole time period within all countries excluding negative outliers.
Step 5: Transforming data if data are highly skewed
Most of the indicators are fractional indicators with values between 0% and 100%. Some indicators are unbound indicators, where values are not limited to an upper threshold. These indicators can be highly volatile and can have skewed data distributions (where most countries show low performance levels and a few countries show exceptionally high performance levels). For the following indicators skewness is above 1 and data have been transformed using a square root transformation: Non-EU doctorate students, Venture capital investments, Public-private co-publications, PCT patent applications, PCT patent applications in societal challenges and License and patent revenues from abroad. A square root transformation simply means taking using the square root of the indicator value instead of the original value.
Step 6: Calculating re-scaled scores
Re-scaled scores of the relative scores for all years are calculated by first subtracting the Minimum score and then dividing by the difference between the Maximum and Minimum score. The maximum re-scaled score is thus equal to 1 and the minimum re-scaled score is equal to 0. For positive and negative outliers and small countries where the value of the relative score is above the Maximum score or below the Minimum score, the re-scaled score is thus set equal to 1 respectively 0.
Step 7: Calculating composite innovation indexes
For each year a composite Summary Innovation Index is calculated as the unweighted average of the rescaled scores for all indicators.
Example 1 |
(latest year missing) |
“2012” |
“2011” |
“2010” |
“2009” |
“2008” |
|
|
|
|
|
|
|
Available relative to EU27 score |
N/A |
150 |
120 |
110 |
105 |
|
|
|
|
|
|
|
|
Use most recent year |
150 |
150 |
120 |
110 |
105 |
|
Example 2 |
(year-in-between missing) |
“2012” |
“2011” |
“2010” |
“2009” |
“2008” |
Available relative to EU27 score |
150 |
N/A |
120 |
110 |
105 |
|
|
|
|
|
|
|
|
Substitute with previous year |
150 |
120 |
120 |
110 |
105 |
|
Example 3 |
(beginning-of-period missing) |
“2012” |
“2011” |
“2010” |
“2009” |
“2008” |
Available relative to EU27 score |
150 |
130 |
120 |
N/A |
N/A |
|
|
|
|
|
|
|
|
Substitute with latest available year |
150 |
130 |
120 |
120 |
120 |
|

66 |
Innovation Union Scoreboard 2013 |
|
|
|
|
6.2. Calculating growth rates
For the calculation of the average annual growth rate in innovation performance we have adopted a generalized approach9:
Step 1: We first define growth for each country c per indicator i as

 ,
, i.e. as the ratio between the non-normalised values for year t and year t-1 as obtained after Step 5 in the previous section.
Step 2: We aggregate these indicator growth rates between year t and year t-1 using a geometric average10 to calculate the average yearly growth rate  :
:
where I is the set of innovation indicators used for calculating growth rates and where all indicators receive the same weight wi (i.e. 1/25 if data for all 25 indicators are available).
The average yearly growth rate  is invariant to any ratio-scale transformation and indicates how much the overall set of indicators has progressed with respect to the reference year t-1.
Step 3: We then calculate for each country c the average annual growth rate in innovation performance as the geometric average of all yearly growth rates:
where 

 and each average yearly growth rate receives the same weight
  .
.
6.3. International benchmarking
The methodology for calculating average innovation performance for the EU27 and its major global competitors is similar to that used for calculating average innovation performance for the EU Member States:
1.Calculate normalised scores for all indicators as fol-
lows: Yi = ((Xi - smallest X for all countries) / (largest X for all countries – smallest X for all countries) such that all normalised scores are between 0 and 1
2.Calculate the arithmetic average over these index scores (CIi)
3.Calculate performance relative to that of the EU27: CIi* = 100*CIi/CIEU27
4.The performance gap/lead to the EU27 is then equal to CIi* - 100
Note that the results for country i are therefore dependent on the data from the other countries as the smallest and largest scores used in the normalisation procedure are calculated over all countries.
9Cf. Tarantola, S., (2008), “European Innovation Scoreboard: strategies to measure country progress over time”, Joint Research Centre. http://publications.jrc.ec.europa.eu/repository/bitstream/111111111/921/1/report%231.pdf
10A geometric mean is an average of a set of data that is different from the arithmetic average. The geometric mean is of two data points X and Y is the square root of (X*Y), the geometric mean of X, Y and Z is the cube root of (X*Y*Z), and so on.

Innovation Union Scoreboard 2013 |
67 |
|
Annex A: Definitions of indicators
|
Indicator |
Definition numerator |
Definition |
Interpretation |
Source |
|
denominator |
||||
|
|
|
|
|
|
1.1.1 |
New doctorate |
Number doctorate graduates |
Population between |
The indicator is a measure of the supply of new second- |
Eurostat |
|
graduates (ISCED 6) |
(ISCED 6) |
25 and 34 years |
stage tertiary graduates in all fields of training. For most |
|
|
per 1000 population |
|
|
countries ISCED 6 captures PhD graduates only, with the |
|
|
aged 25-34 |
|
|
exception of Finland, Portugal and Sweden where also |
|
|
|
|
|
non-PhD degrees leading to an award of an advanced |
|
|
|
|
|
research qualification are included. |
|
1.1.2 |
Percentage |
Number of persons in age |
Population between |
This is a general indicator of the supply of advanced skills. It is |
Eurostat |
|
population aged |
class with some form of post- |
30 and 34 years |
not limited to science and technical fields because the adoption |
|
|
30-34 having |
secondary education (ISCED |
|
of innovations in many areas, in particular in the service sectors, |
|
|
completed tertiary |
5 and 6) |
|
depends on a wide range of skills. International comparisons of |
|
|
education |
|
|
educational levels however are difficult due to large discrepan- |
|
|
|
|
|
cies in educational systems, access, and the level of attainment |
|
|
|
|
|
that is required to receive a tertiary degree. The indicator focuses |
|
|
|
|
|
on a narrow share of the population aged 30 to 34 and it will |
|
|
|
|
|
more easily and quickly reflect changes in educational policies |
|
|
|
|
|
leading to more tertiary graduates. |
|
1.1.3 |
Percentage youth |
Number of young people aged |
Population between |
The indicator measures the qualification level of the |
Eurostat |
|
aged 20-24 having |
20-24 years having attained at |
20 and 24 years |
population aged 20-24 years in terms of formal educational |
|
|
attained at least |
least upper secondary education |
|
degrees. It provides a measure for the “supply” of human |
|
|
upper secondary |
attainment level, i.e. with an |
|
capital of that age group and for the output of education |
|
|
education |
education level ISCED 3a, 3b or 3c |
|
systems in terms of graduates. Completed upper secondary |
|
|
|
long minimum |
|
education is generally considered to be the minimum level |
|
|
|
|
|
required for successful participation in a knowledge-based |
|
|
|
|
|
society and is positively linked with economic growth. |
|
1.2.1 |
International |
Number of scientific publications |
Total population |
International scientific co-publications are a proxy for the |
Science- |
|
scientific |
with at least one co-author |
|
quality of scientific research as collaboration increases |
Metrix / |
|
co-publications per |
based abroad (where abroad is |
|
scientific productivity. |
Scopus |
|
million population |
non-EU for the EU27) |
|
|
(Elsevier) |
1.2.2 |
Scientific publications |
Number of scientific |
Total number |
The indicator is a proxy for the efficiency of the research system |
Science- |
|
among the |
publications among the |
of scientific |
as highly cited publications are assumed to be of higher quality. |
Metrix / |
|
top-10% most cited |
top-10% most cited |
publications |
There could be a bias towards small or English speaking countries |
Scopus |
|
publications worldwide |
publications worldwide |
|
given the coverage of Scopus’ publication data. Countries like |
(Elsevier) |
|
as % of total scientific |
|
|
France and Germany, where researchers publish relatively more |
|
|
publications of the |
|
|
in their own language, are more likely to underperform on this |
|
|
country |
|
|
indicator as compared to their real academic excellence. |
|
1.2.3 |
Non-EU doctorate |
For EU Member States: number of |
Total number of |
The share of non-EU doctorate students reflects the |
Eurostat |
|
students as a % of |
doctorate students from non-EU |
doctorate students |
mobility of students as an effective way of diffusing |
|
|
all doctorate holders |
countries (for non-EU countries: |
|
knowledge. Attracting high-skilled foreign doctorate |
|
|
|
number of non-national doctorate |
|
students will add to creating a net brain gain and will |
|
|
|
students) |
|
secure a continuous supply of researchers. |
|
1.3.1 |
R&D expenditure in |
All R&D expenditures in the |
Gross Domestic |
R&D expenditure represents one of the major drivers of |
Eurostat |
|
the public sector (% |
government sector (GOVERD) |
Product |
economic growth in a knowledge-based economy. As such, |
|
|
of GDP) |
and the higher education sector |
|
trends in the R&D expenditure indicator provide key indications |
|
|
|
(HERD) |
|
of the future competitiveness and wealth of the EU. Research |
|
|
|
|
|
and development spending is essential for making the |
|
|
|
|
|
transition to a knowledge-based economy as well as for |
|
|
|
|
|
improving production technologies and stimulating growth. |
|
1.3.2 |
Venture capital (% |
Venture capital investment |
Gross Domestic |
The amount of venture capital is a proxy for the relative |
Eurostat |
|
of GDP) |
is defined as private equity |
Product |
dynamism of new business creation. In particular for enterprises |
|
|
|
being raised for investment in |
|
using or developing new (risky) technologies venture capital is |
|
|
|
companies. Management buyouts, |
|
often the only available means of financing their (expanding) |
|
|
|
management buyins, and venture |
|
business. |
|
|
|
purchase of quoted shares are |
|
|
|
|
|
excluded. Venture capital includes |
|
|
|
|
|
early stage (seed + start-up) and |
|
|
|
|
|
expansion and replacement capital |
|
|
|
2.1.1R&D expenditure in the business sector (% of GDP)
All R&D expenditures in the |
Gross Domestic |
The indicator captures the formal creation of new knowledge Eurostat |
business sector (BERD) |
Product |
within firms. It is particularly important in the science-based sector |
|
|
(pharmaceuticals, chemicals and some areas of electronics) where |
|
|
most new knowledge is created in or near R&D laboratories. |
2.1.2 Non-R&D innovation |
Sum of total innovation |
Total turnover for all |
This indicator measures non-R&D innovation expenditure as |
Eurostat |
expenditures (% of |
expenditure for enterprises, in |
enterprises |
percentage of total turnover. Several of the components of |
(Community |
turnover) |
thousand Euros and current |
|
innovation expenditure, such as investment in equipment and |
Innovation |
|
prices excluding intramural and |
|
machinery and the acquisition of patents and licenses, measure |
Survey) |
|
extramural R&D expenditures |
|
the diffusion of new production technology and ideas. |
|

68 |
Innovation Union Scoreboard 2013 |
|
|
|
|
Indicator |
Definition numerator |
Definition |
Interpretation |
Source |
|
denominator |
|||||
|
|
|
|
2.2.1SMEs innovating in-house (% of SMEs)11
Sum of SMEs with in-house |
Total number of |
This indicator measures the degree to which SMEs, that |
Eurostat |
innovation activities. Innovative |
SMEs |
have introduced any new or significantly improved products |
(Community |
firms are defined as those firms |
|
or production processes, have innovated in-house. The |
Innovation |
which have introduced new |
|
indicator is limited to SMEs because almost all large firms |
Survey) |
products or processes either 1) |
|
innovate and because countries with an industrial structure |
|
in-house or 2) in combination |
|
weighted towards larger firms tend to do better. |
|
with other firms |
|
|
|
2.2.2 Innovative SMEs |
Sum of SMEs with innovation |
Total number of |
This indicator measures the degree to which SMEs are involved in |
Eurostat |
collaborating with |
co-operation activities, i.e. those |
SMEs |
innovation co-operation. Complex innovations, in particular in ICT, |
(Community |
others (% of SMEs) |
firms that had any co-operation |
|
often depend on the ability to draw on diverse sources of infor- |
Innovation |
|
agreements on innovation |
|
mation and knowledge, or to collaborate on the development |
Survey) |
|
activities with other enterprises or |
|
of an innovation. This indicator measures the flow of knowledge |
|
|
institutions in the three years of |
|
between public research institutions and firms and between firms |
|
|
the survey period |
|
and other firms. The indicator is limited to SMEs because almost all |
|
|
|
|
large firms are involved in innovation co-operation. |
|
2.2.3Public-private co-publications per million population
Number of public-private co-authored Total population |
This indicator captures public-private research linkages |
CWTS / |
research publications. The definition |
and active collaboration activities between business |
Thomson |
of the "private sector" excludes |
sector researchers and public sector researchers resulting |
Reuters |
the private medical and health |
in academic publications. |
|
sector. Publications are assigned to |
|
|
the country/countries in which the |
|
|
business companies or other private |
|
|
sector organisations are located |
|
|
2.3.1PCT patent applications per billion GDP (in PPP€)
Number of patent applications |
Gross Domestic |
The capacity of firms to develop new products will determine |
OECD / |
filed under the PCT, at international |
Product in |
their competitive advantage. One indicator of the rate of new |
Eurostat |
phase, designating the European |
Purchasing Power |
product innovation is the number of patents. This indicator |
|
Patent Office (EPO). Patent counts |
Parities |
measures the number of PCT patent applications. |
|
are based on the priority date, the |
|
|
|
inventor’s country of residence and |
|
|
|
fractional counts. |
|
|
|
2.3.2 |
PCT patent |
Number of PCT patent applications |
Gross Domestic |
This indicator measures PCT applications in health |
OECD / |
|
applications in |
in Environment-related technologies |
Product in |
technology and environment-related technologies and is |
Eurostat |
|
societal challenges |
and Health. Patents in Environment- |
Purchasing Power |
relevant as increased numbers of patent applications in |
|
|
per billion GDP (in |
related technologies include those in |
Parities |
health technology and environment-related technologies |
|
|
PPP€) |
General Environmental Management |
|
will be necessary to meet the societal needs of an ageing |
|
|
|
(air, water, waste), Energy generation |
|
European society and sustainable growth. |
|
|
|
from renewable and non-fossil |
|
|
|
|
|
sources, Combustion technologies |
|
|
|
|
|
with mitigation potential (e.g. using |
|
|
|
|
|
fossil fuels, biomass, waste, etc.), |
|
|
|
|
|
Technologies specific to climate |
|
|
|
|
|
change mitigation, Technologies |
|
|
|
|
|
with potential or indirect contribution |
|
|
|
|
|
to emissions mitigation, Emissions |
|
|
|
|
|
abatement and fuel efficiency in |
|
|
|
|
|
transportation and Energy efficiency |
|
|
|
|
|
in buildings and lighting. Patents in |
|
|
|
|
|
health-related technologies include |
|
|
|
|
|
those in Medical technology (IPC |
|
|
|
|
|
codes (8th edition) A61[B, C, D, F, G, H, |
|
|
|
|
|
J, L, M, N], H05G) and Pharmaceuticals |
|
|
|
|
|
(IPC codes A61K excluding A61K8) |
|
|
|
2.3.3 |
Community |
Number of new community |
Gross Domestic |
Trademarks are an important innovation indicator, especially for the |
OHIM12 / |
|
trademarks per |
trademarks applications |
Product in |
servicesector.TheCommunitytrademarkgivesitsproprietorauniform |
Eurostat |
|
billion GDP (in PPP€) |
|
Purchasing Power |
right applicable in all Member States of the European Union through a |
|
|
|
|
Parities |
single procedure which simplifies trademark policies at European level. |
|
|
|
|
|
It fulfils the three essential functions of a trademark: it identifies the |
|
|
|
|
|
origin of goods and services, guarantees consistent quality through |
|
|
|
|
|
evidence of the company's commitment vis-à-vis the consumer, and |
|
|
|
|
|
is a form of communication, a basis for publicity and advertising. |
|
|
|
|
|
Comment: two-year averages have been used |
|
11This indicator is not directly available from Eurostat. The 2010 Methodology report provides detailed instructions how to calculate this indicator (http://www.proinno-europe.eu/sites/default/files/page/11/12/IUS_2010_Methodology_report.pdf).
12Office for Harmonization in the Internal Market (http://oami.europa.eu/)