

ius-2013_en
.pdfInnovation Union Scoreboard 2013 |
19 |
|
3.Comparisonof EU27innovationperformance with key benchmark countries
This section focuses on a comparison with other European countries in section 4.1 and with the EU27’s global competitors in section 4.2.
3.1. A comparison with other European countries
Switzerland is the overall innovation leader, outperforming all Member States (Figure 10). Its growth performance of 0.5% in the last five years is below that of the EU27. Switzerland’s strong performance is linked to being among the top-3 performers for 15 indicators, in particular in Open, excellent and attractive research systems where it has best performance in all three indicators, Firm investments, Intellectual assets, Innovators and Economic effects. Switzerland’s relative weakness is in having below average shares of SMEs innovating in-house, SMEs collaborating with others and Knowledge-intensive services exports.
Iceland is an Innovation follower and has the highest performance in three indicators: International scientific
co-publications, Public R&D expenditures and Publicprivate co-publications. Iceland’s growth performance is above that of the EU27 with an average annual growth rate of 2.6. Croatia, Norway and Serbia are Moderate innovators with Norway’s innovation performance coming close to that of the Innovation followers in particular due to its strong performance in Open, excellent and attractive research systems. Croatia has the overall highest performance in Youth with upper secondary education and Serbia performs very well in Non-R&D innovation expenditures. Norway’s innovation performance has improved at a below average rate of 0.9% whereas Croatia (2.1%) and in particular Serbia (6.8%) have grown at a faster rate than that of the EU27.
Figure 10: European countries’ innovation performance
Note: Average performance is measured using a composite indicator building on data for 24 indicators ranging from a lowest possible performance of 0 to a maximum possible performance of 1. Average performance reflects performance in 2010/2011 due to a lag in data availability. The performance of Innovation leaders is 20% or more above that of the EU27; of Innovation followers it is less than 20% above but more than 10% below that of the EU27; of Moderate innovators it is less than 10% below but more than 50% below that of the EU27; and for Modest innovators it is below 50% that of the EU27.
The Former Yugoslav Republic of Macedonia and Turkey are Modest innovators. Both countries perform below average for most indicators, but also show particular strengths. Turkey scores top-5 positions for SMEs introducing marketing or organisational innovations and for
Sales of new-to-market and new-to-firm products and Macedonia for the Contribution of medium and high-tech products to the trade balance. Both countries have improved their innovation performance at a rate above that of the EU27 at 2.6% for Macedonia and 3.6% for Turkey.

20 |
Innovation Union Scoreboard 2013 |
|
|
|
|
3.2. A comparison with global competitors
This section provides a comparison of the EU27 with some of its main global competitors including Australia, the BRICS countries (Brazil, China, India, Russia and South Africa), Canada, Japan, South Korea and the US.
The EU27 has managed to significantly close its performance gap with both the US and Japan but the gap with South Korea has increased. The EU27 has increased its performance lead over Australia and Canada and has kept its lead over Brazil, India, Russia and South Africa. Of the BRICS countries only the performance lead over China has decreased.
For these countries data availability is more limited than for the European countries (e.g. comparable innovation survey data are not available for many of these countries). Furthermore, the economic and/or population size of these countries outweighs those of many of the individual Member States and we thus compare
these countries with the aggregate of the Member States or the EU27.
For the international comparison of the EU27 with these global competitors a more restricted set of 12 indicators (Table 5) is used of which most are nearly identical to those used in section for comparing performance of the EU Member States (cf. Table 1). Most of these indicators focus on performance related to R&D activities (R&D expenditures, publications, patents) and there are no indicators using innovation survey data as such data are not available for all countries or are not directly comparable with the European CIS data. The indicator measuring the share of the population aged 30 to 34 having completed tertiary education has been replaced by the same indicator but for the larger age group 25 to 64 as more detailed age group data are not available for most countries. Data availability for China and South Africa has improved compared to the IUS 2011.
Table 5: Indicators used in the international comparison
Main type / innovation dimension / indicator |
Data source |
Most recent |
Date not |
|
year |
available for |
|||
|
|
|||
ENABLERS |
|
|
|
|
|
|
|
|
|
Human resources |
|
|
|
|
|
|
|
|
|
1.1.1 New doctorate graduates (ISCED 6) per 1000 population aged 25-34 |
OECD, Eurostat |
2010 |
India |
|
|
|
|
|
|
1.1.2 Percentage population aged 25-64 having completed tertiary education |
OECD, World Bank, Eurostat |
2010 |
|
|
Open, excellent and attractive research systems |
|
|
|
|
|
|
|
|
|
1.2.1 International scientific co-publications per million population |
Science-Metrix |
2011 |
Australia,Ca nada, |
|
(Scopus) |
South Africa |
|||
|
|
|||
|
|
|
|
|
1.2.2 Scientific publications among the top 10% most cited publications world- |
Science-Metrix |
2008 |
Australia,Ca nada, |
|
wide as % of total scientific publications of the country |
(Scopus) |
South Africa |
||
|
||||
Finance and support |
|
|
|
|
|
|
|
|
|
1.3.1 R&D expenditure in the public sector as % of GDP |
OECD, Eurostat |
2010 |
|
|
FIRM ACTIVITIES |
|
|
|
|
|
|
|
|
|
Firm investments |
|
|
|
|
|
|
|
|
|
2.1.1 R&D expenditure in the business sector as % of GDP |
OECD, Eurostat |
2010 |
|
|
Linkages & entrepreneurship |
|
|
|
|
|
|
|
|
|
2.2.3 Public-private co-publications per million population |
CWTS (Thomson Reuters) |
2008 |
|
|
Intellectual assets |
|
|
|
|
|
|
|
|
|
2.3.1 PCT patents applications per billion GDP (in PPS€) |
OECD, Eurostat |
2010 |
Brazil |
|
|
|
|
|
|
2.3.2 PCT patents applications in societal challenges per billion GDP (in PPS€) |
OECD, Eurostat |
2009 |
|
|
(environment-related technologies; health) |
|
|||
|
|
|
||
OUTPUTS |
|
|
|
|
|
|
|
|
|
Economic effects |
|
|
|
|
|
|
|
|
|
3.2.2 Contribution of medium and high-tech product exports to the trade balance |
UN, Eurostat |
2011 |
|
|
|
|
|
|
|
3.2.3 Knowledge-intensive services exports as % total service exports |
UN, Eurostat |
2010 |
South Africa |
|
|
|
|
|
|
3.2.5 License and patent revenues from abroad as % of GDP |
World Bank, Eurostat |
2011 |
|
|
|
|
|
|

Innovation Union Scoreboard 2013 |
21 |
|
Figure 11 summarizes the performance for the EU27 and its major global competitors7. Innovation performance in the US, Japan and South Korea is above that of the EU27. Compared to last year’s results,
South Korea has joined the US as the global innovation leader. The EU27 is outperforming the other countries, in particular all BRICS countries. South Korea has joined the US as the most innovative country compared to the IUS 2011.
The dynamic innovation performance over a five-year period is shown in Figure 12. The EU27’s performance lag to South Korea has almost tripled. The EU27 is closing its performance gap to Japan and the US and is increasing its lead over Australia and Canada. The performance lead compared with the other countries is more stable and even slightly increasing with Brazil, India, Russia and South Africa. Of the BRICS countries only China is gradually closing the gap with the EU27.
Figure 11: EU27 innovation performance compared to main competitors
Note: Average performance is measured using a composite indicator building on data for 12 indicators ranging from a lowest possible performance of 0 to a maximum possible performance of 1. Average performance reflects performance in 2010/2011 due to a lag in data availability.
7 The methodology for calculating average innovation performance is explained in the Technical Annex 6.3.

22 |
Innovation Union Scoreboard 2013 |
|
|
|
|
Figure 12: EU27 change in innovation performance compared to main competitors
The numbers in the graphs show the performance lead/gap of each country compared to the EU27. A score above 0 shows that the country has a performance lead (e.g. a score of 20 says that the country is performing 20% better than the EU27), a score below 0 shows that the country has a performance gap (e.g. a score of -20 says that the country is performing 20% worse than the EU27).
Due to small changes in the methodology the scores are not directly comparable to those presented in the IUS 2011. The IUS 2011 indicator on Medium and high-tech product exports as % of total exports has been replaced with the indicator on the Contribution of Medium and high-tech product exports to the trade balance and for the indicator on PCT patent applications in societal challenges applications in climate change mitigation have been replaced with applications in environment-related technologies.

Innovation Union Scoreboard 2013 |
23 |
|
3.2.1. Global innovation leaders
The United States is performing better than the EU27 in 7 indicators, in particular in Tertiary education, R&D expenditure in the business sector and Public-private co-publi- cations (Figure 13). The EU27 has a small performance lead in R&D expenditure in the public sector, PCT patents, PCT patents in societal challenges and Contribution of medium- high-tech product exports to the trade balance. Overall there is a clear performance lead in favour of the US but this lead has been declining. The US has increased its lead in New
doctorate graduates and R&D expenditure in the business sector and has reversed its lag in Knowledge-intensive services exports into a performance lead. The US lead has decreased in Tertiary education, International co-publications, Most cited publications, Public-private co-publications and License and patent revenues from abroad. The US has lost its lead in PCT patents and PCT patents in societal challenges. The EU27 has increased its lead in R&D expenditure in the public sector and Contribution of medium-high-tech product exports to the trade balance.
Figure 13: EU27-US comparison
A country has a performance lead over the EU27 if the relative score for the indicator is above 0 and a performance gap with the EU27 if the relative score is below 0 (or the EU27 has a performance lead if the relative score for the indicator is below 0 and a performance gap if the relative score is above 0). Relative annual growth as compared to that of the EU27 over a 5-year period.
Japan is performing better than the EU27 in 6 indicators, in particular in Tertiary education, R&D expenditure in the business sector, Public-private co-publications, PCT patents and PCT patents in societal challenges (Figure 14). For New doctorate graduates, International co-pub- lications, Most cited publications, R&D expenditure in the public sector, Knowledge-intensive services exports and License and patent revenues from abroad the EU27 is performing better than Japan. Overall there is a clear performance lead in favour of Japan but this lead has been
decreasing. Japan’s performance lead has decreased in Tertiary education, R&D expenditure in the business sector, Public-private co-publications, PCT patents, PCT patents in societal challenges and Contribution of medium-high- tech product exports to the trade balance. The EU27 has increased its lead in International co-publications, Most cited publications, R&D expenditure in the public sector, Knowledge-intensive services exports and License and patent revenues from abroad. The EU27 performance lead has decreased in New doctorate graduates.
Figure 14: EU27-Japan comparison

24 |
Innovation Union Scoreboard 2013 |
|
|
|
|
South Korea is performing better than the EU27 in 8 indicators, in particular in R&D expenditure in the business sector, PCT patents and Knowledgeintensive services exports (Figure 15). The EU27 has a performance lead in New doctorate graduates, Most-cited publications, PCT patents in societal challenges and License and patent revenues from abroad. Overall there is a clear performance lead in favour of South Korea and this innovation lead has been increasing continuously and has almost tripled. South Korea has increased its lead in Tertiary
education, R&D expenditures in the public and business sector, PCT patents in societal challenges and Knowledge-intensive services exports. South Korea’s lead in Contribution of medium-high-tech product exports to the trade balance has remained stable and its lead in PCT patents has decreased. The EU27 has increased its lead in Most cited publications. The EU27 has a decreasing lead in New doctorate graduates, International co-publications, PCT patents in societal challenges and License and patent revenues from abroad.
Figure 15: EU27-South Korea comparison
3.2.2. Other developed countries
The EU27 has a performance lead over Canada and this lead has more than doubled. Canada is performing better in 3 indicators, in particular in Tertiary education and Public-private co-publications (Figure 16). In R&D expenditure in the business sector, PCT patents, PCT patents in societal challenges and License and patent revenues from abroad Canada is showing the largest performance gap towards the EU27. Canada’s lead in
Tertiary education, R&D expenditure in the public sector and Public-private co-publications has decreased. The EU27 has increased its lead in R&D expenditure in the business sector, PCT patents, PCT patents in societal challenges, Contribution of medium-high-tech product exports to the trade balance and License and patent revenues from abroad. The EU27 lead has decreased in New doctorate graduates and Knowledge-intensive services exports.
Figure 16: EU27-Canada comparison
No data for International co-publications and Most cited publications.
Innovation Union Scoreboard 2013 |
25 |
|
The EU27 has a performance lead over Australia and this lead has been increasing slowly. Australia is performing better in 4 indicators, in particular in New doctorate graduates and Tertiary education (Figure 17). In PCT patents, Knowledge-intensive services exports and License and patent revenues from abroad Australia is showing the largest performance gap towards the EU27. Australia is showing a small increase in its lead in Tertiary education and R&D expenditure
in the business sector. Australia’s lead has decreased in New doctorate graduates and R&D expenditure in the public sector. The EU27 has increased its lead in PCT patents, Contribution of medium-high-tech product exports to the trade balance and License and patent revenues from abroad and has reversed the gap into a lead for PCT patents in societal challenges. The EU27 performance lead has decreased in Public-private copublications and Knowledge-intensive services exports.
Figure 17: EU27-Australia comparison
No data for International co-publications and Most cited publications.
3.2.3. BRICS countries
The EU27 has a clear performance lead compared to all five BRICS countries. This lead has been slightly increasing with Brazil, India, Russia and South Africa. Only China is gradually closing the gap with the EU27.
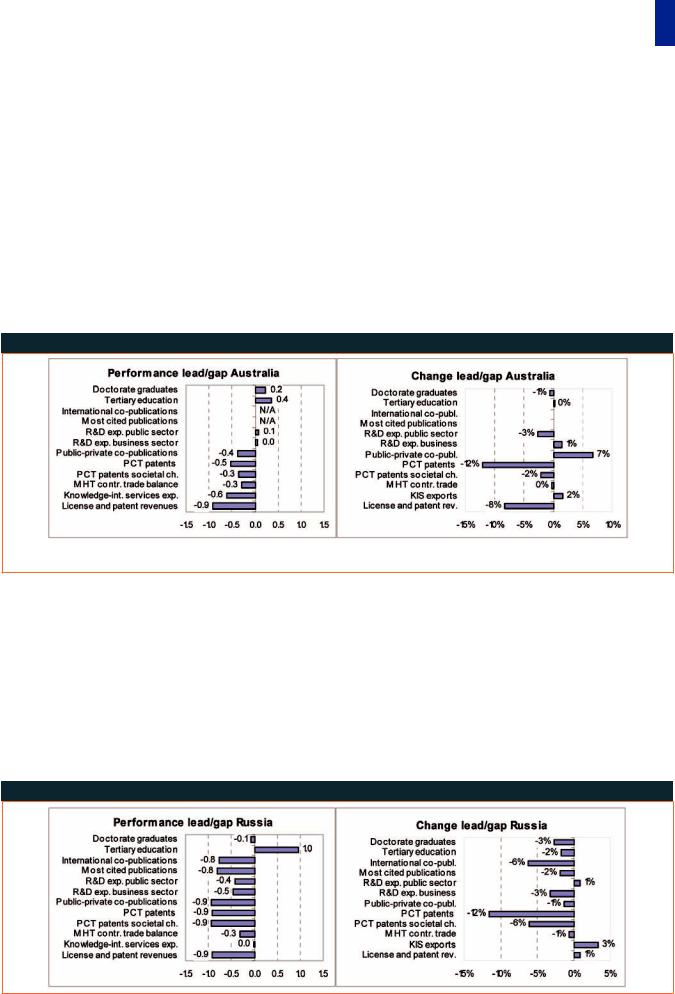
The EU27 is performing better than Russia in most indicators (Figure 18). Only in Tertiary education Russia is performing much better. Russia is lagging most in Public-private co-publications, PCT patents, PCT patents in societal challenges and License and
patent revenues from abroad. Russia’s lead in Tertiary education has decreased. Russia has decreased its gap in R&D expenditure in the public sector, License and patent revenues from abroad and Knowledgeintensive services exports. Russia’s gap has increased for New doctorate graduates, International co-publications, Most cited publications, R&D expenditure in the business sector, Public-private co-publications, PCT patents, PCT patents in societal challenges and Contribution of medium-high-tech product exports to the trade balance.
Figure 18: EU27-Russia comparison

26 |
Innovation Union Scoreboard 2013 |
|
|
|
|
The EU27 is performing better than China in most indicators (Figure 19). Only in New doctorate graduates and R&D expenditure in the business sector China is performing better. China is lagging most in International co-publications, Public-private co-publications, PCT patents in societal challenges and License and patent revenues from abroad. China’s lead in R&D ex-
penditure in the business sector has increased and its lead in New doctorate graduates has remained stable. China has decreased its gap most strongly for International co-publications, Public-private co-publications, PCT patents and PCT patents in societal challenges. China’s performance gap has only increased for License and patent revenues from abroad.
Figure 19: EU27-China comparison
India is lagging in innovation performance in most indicators, in particular in International co-publica- tions, Public-private co-publications, PCT patents, PCT patents in societal challenges and License and patent revenues from abroad (Figure 20). India’s performance in Knowledge-intensive services exports is well above that of the EU27 but its lead has been slightly
decreasing. India has decreased its performance gap in International co-publications, Most cited publications and Public-private co-publications. India’s performance gap has increased for Tertiary education, R&D expenditures in the public and business sector, PCT patents, PCT patents in societal challenges and License and patent revenues from abroad.
Figure 20: EU27-India comparison
No data for New doctorate graduates.
Innovation Union Scoreboard 2013 |
27 |
|
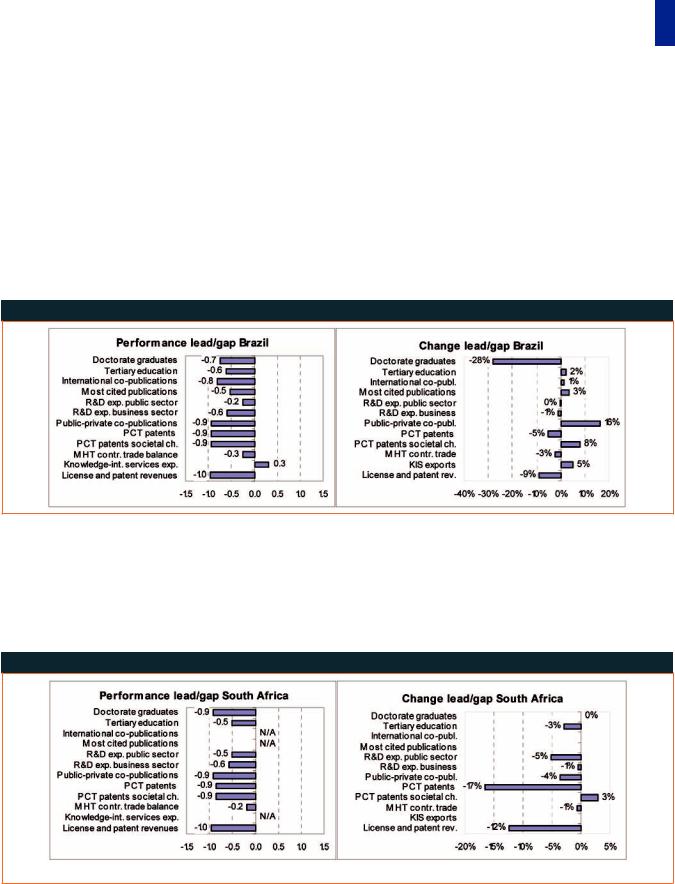
Brazil is lagging in most indicators, in particular in Public-private co-publications, PCT patents, PCT patents in societal challenges and License and patent revenues from abroad (Figure 21). Brazil’s performance in Knowledge-intensive services exports is above that of the EU27 and has been increasing. Brazil has decreased its gap in Tertiary education, International
co-publications, Most cited publications, PCT patents in societal challenges, and most notably in Publicprivate co-publications. Brazil’s gap has increased for New doctorate graduates, PCT patents, Contribution of medium-high-tech product exports to the trade balance, R&D expenditure in the business sector and License and patent revenues from abroad.
Figure 21: EU27-Brazil comparison
South Africa’s innovation performance is lagging in all indicators, in particular in New doctorate graduates, Public-private co-publications, PCT patents, PCT patents in societal challenges and License and patent revenues from abroad (Figure 22). South Africa’s gap has increased for almost all indicators, in particular for PCT patents and License
and patent revenues from abroad. South Africa has reduced its performance gap in PCT patents in societal challenges.
Figure 22: EU27-South Africa comparison
No data for International co-publications, Most cited publications and Knowledge-intensive services exports.

28 |
Innovation Union Scoreboard 2013 |
|
|
|
|
4. Country profiles
In this section for each country a more detailed country profile is shown highlighting for each country’s relative strengths and weaknesses in innovation performance and its main drivers of innovation growth. Relative strengths and weaknesses are determined by comparing the composite indicator scores for each of the 8 innovation dimensions with the overall composite innovation index.
Belgium is one of the innovation followers with an above average performance. Relative strengths are in Open, excellent and attractive research systems, Linkages & entrepreneurship and Innovators. Relative weaknesses are in Finance and support and Intellectual assets.
Indicator values relative to the EU27 (EU27=100)
High growth is observed for Community trademarks. A strong decline is observed for Non-R&D innovation expenditure. Growth performance in Open, excellent and
attractive research systems, Linkages & entrepreneurship and Intellectual assets is well above average and in Firm investments well below average.
Annual average growth per indicator and average country growth