

Money, Banking, and International Finance ( PDFDrive )
.pdfMoney, Banking, and International Finance
price of bonds decreases, so using the present value formula, the market interest rate rises. Hence, the investors are attracted to the greater interest rate.
Figure 1. Demand function for bonds
Supply function shows the relationship between the quantity supplied and the market price, when we hold all other economic variables constant. We drew a supply function in Figure 2. Supply function has a positive slope because as you move from point A to point B, the price becomes higher while the market interest rate falls. Consequently, businesses and firms borrow more funds because the interest rates are cheaper. Remember a bond’s interest rate moves in the opposite direction of a bond’s price.
Figure 2. Supply function for bonds
101
Kenneth R. Szulczyk
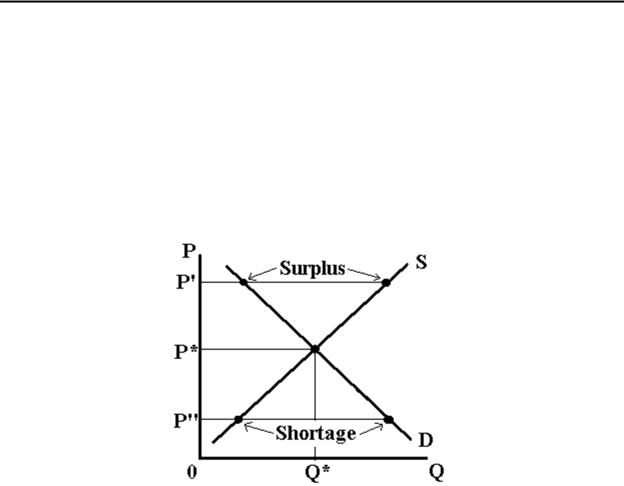
Demand and supply functions intersect at one point, the equilibrium. Equilibrium reflects a state of rest. As long as the supply or demand function does not change, then the price and quantity remain where they are. We show supply and demand functions in Figure 3. At this point, the quantity demanded equals the quantity supplied for bonds. The Q* and P* represent equilibrium quantity and price. Using the present value formula, we can deduce what happens to the market interest rate.
What would happen to the bond market if the bond’s price exceeds the equilibrium price? Consequently, the quantity supplied is greater than quantity demanded, creating a surplus. Businesses and government sell more bonds because the price of bonds is high, and interest rates are low. However, the investors do not buy these bonds because the high price and low interest rates. Thus, the bond’s price falls until restoring equilibrium at P* again.
Figure 3. Supply and demand for bonds
What would happen in the market if the price of bonds were lower than the equilibrium price? Quantity supplied becomes less than quantity demanded, creating a shortage. Bond prices are low, and interest rates are high. Consequently, the investors have a large demand for bonds because the bonds make a good investment. However, businesses and government do not sell bonds for a low price and high interest rate. Thus, the bond’s price must increase until equilibrium is restored at P* again, decreasing the market interest rates. Therefore, the market always gravitates to equilibrium and consistently eliminates shortages and surpluses as long as a government does not interfere in the market.
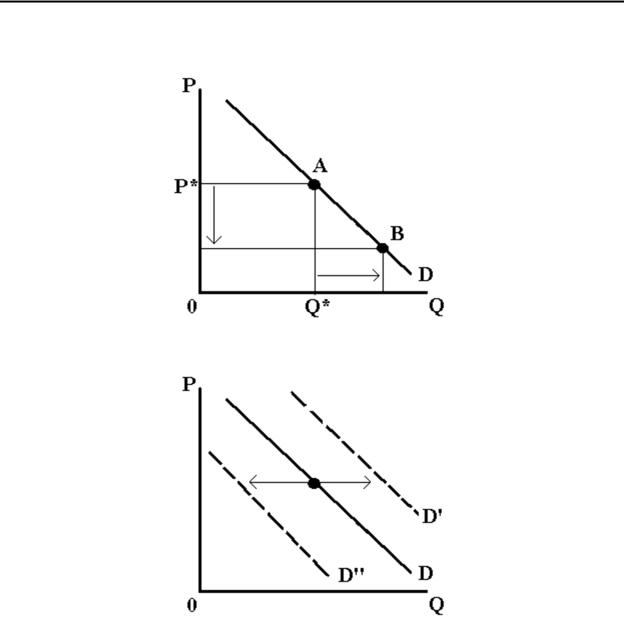
Demand function can shift because a factor has changed. Please know the difference between a movement along a demand curve and a demand function shift. We show a decrease in quantity demanded in Figure 4. Investors demand more bonds as we move from point A to point B. Economists call this a change in “quantity demanded.” Investors increase quantity demanded because the price of bonds became cheaper. Consequently, a factor has changed the supply function and not the demand function. If an outside factor affects the demand function, then the
102
Money, Banking, and International Finance
demand function would shift. Economists call a rightward shift an “increase in demand,” while a shift to the left is a “decrease in demand.” We show demand function shifts in Figure 5.
Figure 4. A movement along a demand function
Figure 5. A demand function shifts
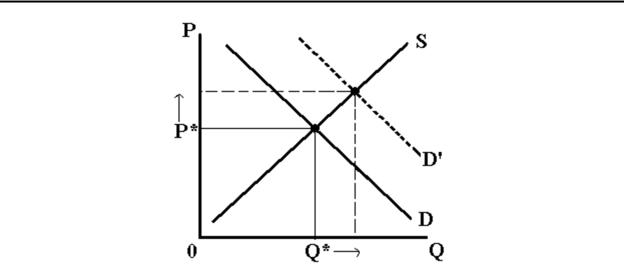
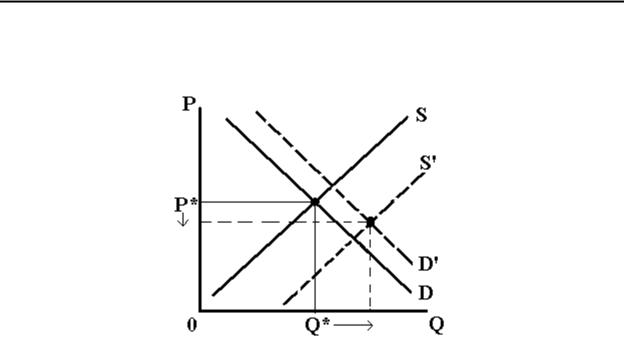
We listed six factors to show an increase in the demand function, shifting it rightward. We show the increase in the demand function in Figure 6. When the investors increase their demand for bonds, the demand function shifts rightward because investors buy more bonds. Thus, both the equilibrium quantity, Q*, and bond’s market price, P*, rise. When we discount the bonds using the present value formula, the market interest rate for the bonds fall.
103
Kenneth R. Szulczyk
Figure 6. A demand function increases
Listing the six factors that increase the demand function:
An increase in wealth increases the bond’s demand function shifting rightward. A growing economy creates wealth. Thus, the demand for bonds increases too because investors and the people have more wealth and invest more in the bond market.
A decrease in the expected returns on investment increases the bond’s demand function shifting rightward. If investors believe the interest rates will become lower, then investors would buy more bonds now. For example, if you believe interest rates will fall, subsequently, the bond prices would increase. Consequently, you buy bonds now because you buy bonds for a cheap price at a high interest rate and could resell the bonds in the future for a greater price as market interest rate falls.
A decrease in expected inflation increases the bond’s demand function shifting rightward. Inflation erodes the purchasing power of households, businesses, and governments. Inflation also erodes the value of investments, such as stocks and bonds. Thus, the investors would buy fewer bonds if they believe the inflation rate will rise in the future, especially long-term bonds. If investors believe inflation would decrease in the future, then investors buy more bonds for investment.
A decrease in the risk of bonds increases the bond’s demand function shifting rightward. Investors loan funds to borrowers, who will not default on their loans. Investors are usually risk averse. If investors believe the bond market becomes more stable and “safer," then they buy more bonds.
An increase in the liquidity of the bond market increases the bond’s demand function shifting rightward. Investors are attracted to highly liquid bonds. Future is uncertain, and
104
Money, Banking, and International Finance
investors can sell an asset fast for little transaction cost. If the bond market becomes more liquid, such as U.S. government securities, then investors boost their demand for U.S. government bonds.
A decrease in information costs increases the bond’s demand function shifting rightward. Investors continually need information, so they can evaluate their investments. For example, firms like Standard & Poor’s evaluate the financial strength of large corporations and the corporations’ ability to repay their debts. Investors have low information costs for large corporations, increasing their demand for large corporate bonds.
Please note the demand function can shift leftward by the same six factors. You just reverse the logic for the six factors. For example, an increase in expected inflation causes the demand function to decrease and shift leftward. Consequently, the bond price falls while the interest rate rises.
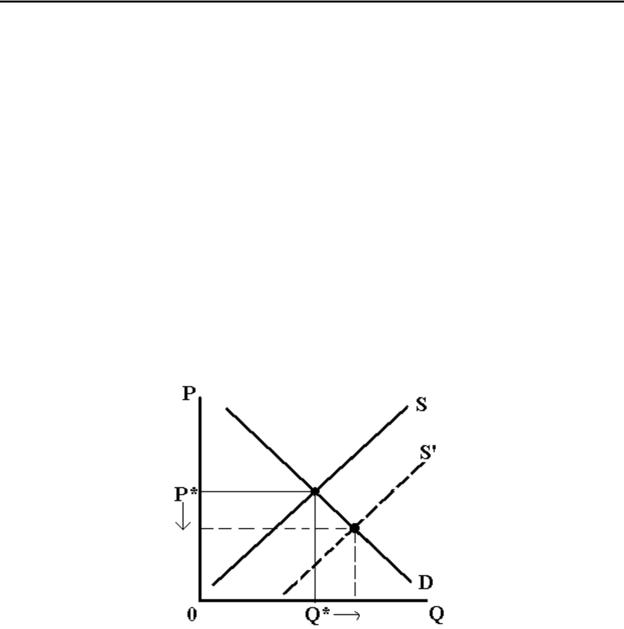
Four factors cause the supply function to shift. We listed them in a way that causes the supply function to increase and shift rightward in Figure 7. When businesses and governments issue more bonds, the supply function shifts rightward, causing the equilibrium quantity (Q*) to increase while the bond’s market price (P*) falls. When we discount the bond’s price using the present value formula, then the bond's market interest rate rises.
Figure 7. A supply function increases
Four factors shift the supply function:
A rise in expected profits increases the bond’s supply function shifting rightward. A business would borrow and boost its debt to buy assets like machines and equipment if the business expects larger profits. Usually businesses issue bonds for machines and
105

Kenneth R. Szulczyk
equipment during a business cycle because of profit expectations, while the opposite occurs during a recession.
A decrease in business taxes increases the bond’s supply function shifting rightward. If a government subjects a business to high taxes, then the business has a low incentive to invest in machines and equipment or expand its production. More investment, such as borrowing funds through the bond market, enlarges the firm, increasing its tax burden. If a government had lowered the tax burden on businesses, subsequently, businesses would invest more by using bonds, increasing the bond’s supply of bonds, and the bond supply would shift rightward.
A rise in expected inflation increases the bond’s supply function shifting rightward. Inflation erodes the value of the dollar. Consequently, the value of debt decreases over time. If businesses and government believe inflation would rise, they borrow more funds by issuing bonds. Then, they repay their loans with “cheaper” dollars.
A rise in government borrowing increases the bond’s supply function shifting rightward. When government spends more than what it collects in taxes, the government can borrow by issuing government bonds. The United States federal government operated with budget deficits for the last 40 years. Every year, the U.S. government issues more debt via bonds, and the supply of bonds keeps increasing, which raises interest rates and reduces bond prices.
Please note the supply function can shift leftward by the same four factors. You just reverse the logic for the four factors. For example, a drop in expected inflation causes the supply function to decrease and shift leftward. Consequently, the bond price rises while the interest rate falls.
Interest Rates and the Business Cycle
Empirical evidence indicates that market interest rates rise during a business cycle and fall during recessions. During a business cycle, the amount of goods and services produced in the economy increases because businesses become optimistic about future profits and invest in machines and equipment by issuing more bonds. Consequently, the bond's supply increases. Moreover, if an economy produces more goods and services, the economy creates more wealth. Investors save more and invest in the financial markets. Thus, the bond's demand increases and the demand function shifts rightward in Figure 8.
When both the supply and demand functions shift, we know either the price or quantity while the other variable becomes indeterminate. In this case, both functions increase, causing the quantity of bonds to increase, but bond prices and interest rates become unknown. If you do not believe me, then experiment with the supply and demand functions. First, increase the demand function by a good deal, and increase the supply function by a little. Second, increase the demand function by a little and increase the supply function by much. Consequently, the
106
Money, Banking, and International Finance
market price is greater in the first case and lower in the second case. Therefore, changes in bond prices and interest rates become ambiguous. Unfortunately, we cannot prove interest rates rise during economic expansions and fall during recessions.
Figure 8. Both supply and demand functions increase
The Fisher Effect
We only discussed nominal interest rates. We did not adjust the nominal interest rates for inflation. Unfortunately, inflation can have a significant influence on the financial markets. Investors and savers are concerned about the real interest rate because the real interest rate reflects the true cost of borrowing. The Fisher Effect relates nominal and real interest rates and we define the notation as:
i is the nominal interest rate.
r equals the real interest rate.
e is the expected inflation rate.
We show the Fisher Effect Equation in Equation 1. It equals a geometric average of the expected inflation rate and real interest rate.
i+1 = 1+ r 1+πe |
(1) |
For low inflation and low interest rates, we can use the approximation that we had derived in Equation 2. We set the cross term r e to zero because it becomes a tiny number. However, if
107

Kenneth R. Szulczyk
the inflation rate or interest rate becomes high, then the approximation loses accuracy as the cross term becomes large.
i +1 = 1+ r 1+ πe |
|
i 1 1 r e r e |
(2) |
i r + πe |
|
For example, you expect the inflation rate will be zero ( e = 0 ), and you grant a loan for 5% for one year. At the end of Year 1, you have 5% more money in real terms because you can purchase 5% more in goods and services. We calculated the real interest rate in Equation 3.
r i πe 5 0 = 5 |
(3) |
What would happen if you believe inflation will increase to 5% ( e = 5% ), and you grant a loan for one year at 5%? At the end of year 1, you would have 5% more money, but prices, unfortunately, became 5% greater too. Consequently, your purchasing power would not change in real terms. We calculated the real interest rate in Equation 4.
r i πe 5 5 = 0 |
(4) |
Real interest rate, therefore, reflects the true cost of borrowing and becomes a better indicator of incentives to lend and borrow. Many financial analysts use nominal interest rates because inflation is low in the United States, averaging 3% per year or less.
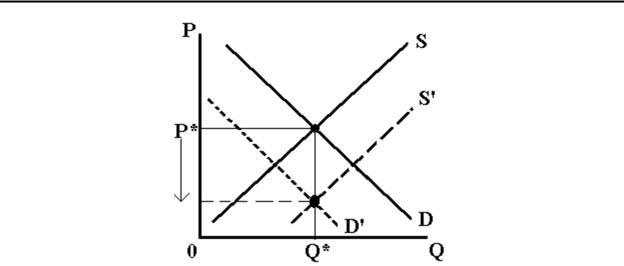
We can use the bond market to show the Fisher Effect. If the investors and businesses expect higher inflation in the future, then investors buy fewer bonds while businesses sell more bonds. Investors know the inflation would erode the value from their investment while businesses could repay the bonds with inflated dollars. Consequently, the demand for bonds shifts toward the left while the supply for bonds shifts rightward. We show the impact on the bond market in Figure 9. Accordingly, the price of bonds decreases and the interest rates increases. In this case, the amount of bonds (Q*) in the market is ambiguous. You prove this by shifting the demand and supply curve enough, so the quantity does not change. Then shift either function a little more and the equilibrium quantity changes direction. Thus, the greater inflationary expectations cause greater bonds prices and lower bond interest rates as we discount bond prices.
Financial analysts always write interest rates for financial instruments in nominal terms. If investors and the public have higher expectations of inflations ( e ), then nominal interest rates
(i) become greater. If the government wants low nominal interest rates, then the public and investors must believe the inflation rate will be low.
108
Money, Banking, and International Finance
Figure 9. Supply and demand functions explain the Fisher Effect
Bond Prices in an Open Economy
In the previous supply-demand graphs, the bond was the good for the market. However, we could switch the analysis, where the money exchanged for the bond becomes the commodity. Then money becomes the loanable funds. Consequently, the bond and loanable funds markets yield identical results because we examine the same picture in a different manner. Nevertheless, loanable funds switch the roles of supply and demand. If investors buy bonds, then they have a demand for bonds. Investors become a source of loanable funds because they trade money for bonds. Thus, the investors represent the supply function in the loanable funds market. If a businesses or governments sell bonds, then they demand loanable funds. Therefore, they represent the demand function for loanable funds. Equilibrium price in the loanable funds market is the interest rate while the equilibrium quantity is the amount of loanable funds.
Previous supply-demand examples viewed the bond market as a closed economy. A closed economy has no financial transactions with other countries because the country does not allow money and goods to flow across its borders. However, we could alter the analysis to allow international investors into the market. An open economy is a country allows goods, services, and financial securities to flow freely in or out of a country. Consequently, the analysis uses the loanable funds approach. Quantity represents the amount of loanable funds while the price is the real interest rate. We use the real interest rate because investors are concerned about their investment return after accounting for inflation. Thus, we deduct a country’s inflation rate from the nominal interest rate, yielding the real interest rate.
If a country were a closed, small economy, the loanable funds market would be at equilibrium. Domestic investors represent the supply of loanable funds while businesses and governments demand them. Furthermore, we assumed the country is small because the investors, government, and businesses cannot influence the international interest rate.
109
Kenneth R. Szulczyk
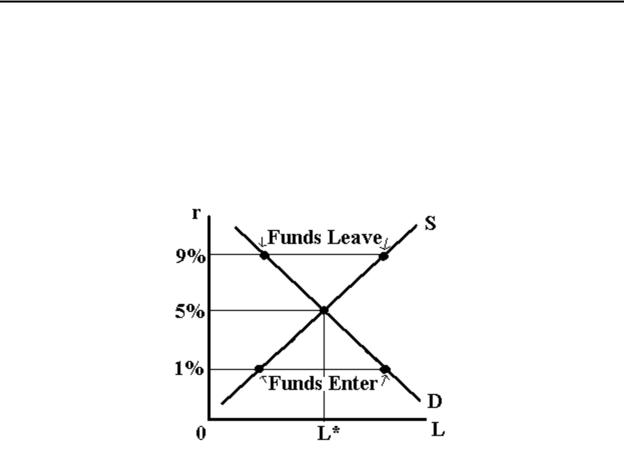
Consequently, the real interest rate equals 5% in Figure 10 while the amount of funds in the market is L*.
If the world’s real interest rate were 9%, then the domestic investors would invest their funds in the international market, earning a higher interest rate in Figure 10. However, businesses and governments would not borrow funds at this interest rate because it is too high. Consequently, the difference between quantity supplied and quantity demanded reflects the amount of funds leaving the country at 9% real interest rate. If this country were a closed economy, subsequently, the market would have a surplus, and market forces would lower the real interest rate to 5%.
Figure 10. Loanable funds in an open economy
If the world’s real interest rate were 1%, then firms and the government would borrow at the cheap rates in Figure 10. However, the domestic investors would not lend at that rate. Consequently, the difference between quantity demanded and quantity supply reflects the amount of funds entering the country. If this country were closed, then the loanable funds market would cause a shortage, and market forces would increase the real interest rate.
We assumed the country is a small open economy because this country is too little to influence the world’s real interest rate. Many countries, such as the Netherlands and Belgium would fall within this category. However, a large country like the United States, Germany, or Japan would affect the world’s real interest rate.
Key Terms |
|
bond market |
increase in demand |
demand function |
decrease in demand |
supply function |
Fisher Effect |
equilibrium |
loanable funds |
|
110 |