

414 |
Appendix E: Calculations with Finned Tubes |
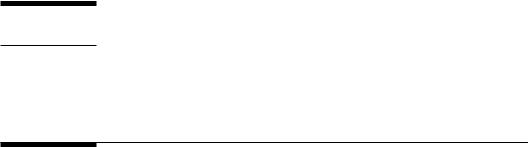
Serrated ns
Solid ns
FIGURE E.1
Solid and serrated fins.
Why Finned Tubes?
First let us understand why finned tubes are used. Finned tubes make boiler components compact and light and reduce the gas pressure drop compared to a plain tube design for the same parameters. In addition, the space occupied by the finned bundle will be smaller compared to a plain tube bundle. Given in Table E.1 is a summary of design details for a boiler evaporator with plain and finned tubes for the same duty. The procedure for sizing with plain tubes is discussed in Appendix C. We will discuss the calculation procedure for finned tubes a little later.
A study was made for a boiler evaporator with plain tubes and finned tubes. The steam and gas parameters are shown in Table E.1. The first column shows a plain tube design with a given cross section, while column 2 shows a finned tube bundle design using serrated fins with the same cross section. The third column shows a plain tube bundle designed to match the gas pressure drop of the finned tube bundle.
It may be seen that for the same cross section, the number of rows deep for the plain tube boiler is 57, while for the finned tube option, it is only 13. As a result, the length of the headers will be small. This means a large savings in space if finned tubes are used. In addition, the gas pressure drop and weight of the finned tube bundle are lower. However, the surface area is much more and so is the heat flux inside the tubes, which will increase the tube wall temperature. If the choice of fins is properly done, the boiler can be compact
Appendix E: Calculations with Finned Tubes |
|
415 |
|||
|
TABLE E.1 |
|
|
|
|
|
Plain Tube versus Finned Tube Evaporator |
|
|
|
|
|
|
|
|
|
|
|
Boiler Design |
Plain Tubes |
Finned Tube |
Plain Tubes |
|
|
|
|
|
|
|
|
Tubes/row |
21 |
22 |
21 |
|
|
Number of rows deep |
57 |
13 |
52 |
|
|
Effective length, m |
4 |
4 |
5 |
|
|
Fins/m |
0 |
197 |
0 |
|
|
Fin height, mm |
0 |
19 |
0 |
|
|
Fin thickness, mm |
0 |
1.5 |
0 |
|
|
Serration, mm |
0 |
4 |
0 |
|
|
Transverse pitch, mm |
101 |
101 |
101 |
|
|
Longitudinal pitch, mm |
101 |
101 |
101 |
|
|
Surface area, m2 |
762 |
1,588 |
868 |
|
|
U, kcal/m2 h °C (W/m2 K) |
62.9 (73) |
30.3 (35.2) |
55.2 (64.1) |
|
|
Tube wall temperature, °C |
259 |
293 |
259 |
|
|
Gas pressure drop, mm wc |
55 |
32 |
33 |
|
|
Weight of tubes, kg |
20,600 |
12,150 |
23,500 |
|
|
Heat flux inside tubes, kW/m2 |
26.3 |
110 |
26 |
|
Notes: Tubes: 50.8 × 44 mm at 101 mm square pitch. Steam pressure = 39 kg/cm2 g, steam generation = 3.39 kg/s. Feed water at 105°C. Gas flow = 27.8 kg/s at 560°C in and 302°C out. Duty = 8 MW. Gas analysis: % volume CO2 = 3, H2O = 7, N2 = 75, O2 = 15. Fouling factors on gas and steam sides—0.0002 m2 h °C/kcal (0.000172 m2 K/W).
and operate well within its allowable temperature limits. That is why we see finned tube bundles used in all sections of a gas turbine HRSG or in any clean gas heat recovery application. Finned tubes have also been used in gas-fired package boilers for the superheater as well as the evaporator as discussed in Chapter 3. If one had used plain tubes, it would be nearly impossible to build HRSGs with multiple pressure modules. Also one may note that the weight of the finned evaporator is lower due to the fewer number of rows deep. If we try to match the gas pressure drop of finned tubes by manipulating the tube spacing and geometry, the cross section of the plain tube bundle will be larger and also its weight. This is shown in the third column of Table E.1. In spite of a bigger cross section, the length occupied by the evaporator will be much more than the finned tube bundle. At 101 mm longitudinal spacing, the minimum length for plain tube bundle is 5.2 m, while for the finned bundle, it is only 1.3 m.
Heat Transfer Calculations
Sizing or performance evaluation of finned tubes is a tedious process. The determination of heat transfer coefficient itself requires inputs on tube wall and fin tip temperatures and number of rows of tubes deep. Hence, the tube-side as well as the overall heat transfer coefficient has to be evaluated to correct the gas-side coefficient, which implies that this is an iterative process. This is aptly done using a computer program written for the purpose. One has to assume a cross section and the number of rows deep for a given duty and check if that configuration meets the duty or try another tube geometry that meets the duty. This is the general procedure for design as well as off-design performance evaluation of

Appendix E: Calculations with Finned Tubes |
421 |
||
|
TABLE E.3 |
|
|
|
F Factors |
|
|
|
|
|
|
|
Material |
F |
|
|
|
|
|
|
304, 316, 221 alloys |
1.024 |
|
|
Carbon steel |
1 |
|
|
409, 410, 430 alloys |
0.978 |
|
|
Nickel 200 |
1.133 |
|
|
Inconel 600, 625 |
1.073 |
|
|
Inconel 800 |
1.013 |
|
|
Inconel 825 |
1.038 |
|
|
Hastelloy B |
1.179 |
|
|
|
|
|
Note that these correlations have a margin of error, and hence, based on experience and field measurements, suitable correction factors are applied. The author’s experience is that these correlations are conservative and underpredict actual hc (obtained in the field) by about 10%.
Weight of Finned Tubes |
|
Solid fins : w = 10.68 × Fbn (d + h)× (h + 0.03) |
(E.27) |
Serrated fins : †w = 10.68 × Fbnd × (h + 0.12) |
(E.28) |
w is the weight in lb/ft. Factor F is given in Table E.3. Note that d, h, b are in in. in (E.27) and (E.28) and n is fins/in.
Example E.1
A 50.8 × 44 mm solid finned superheater having a fin density of 78.7 fins/m of height 12.7 mm and thickness 1.52 mm is arranged in inline fashion at 101.6 mm square pitch. The supplier has used 18 tubes/row and 6 rows deep, 3.1 m long tubes with 9 streams. Gas flow is 100,000 kg/h with the following analysis by volume% CO2 = 3, H2O = 7, N2 = 75, O2 = 15. The bundle is designed with inlet and exit gas temperatures of 550°C and 479°C; steam flow is 25,000 kg/h (6.94 kg/s) at 369°C at 49 kg/cm2 g (4,804 kPa) at superheater exit, and saturated steam enters the superheater in counter-flow fashion at 265°C. Surface area is 188 m2. Check the suitability of the design.
Solution
Flue gas data from Appendix F at the average gas temperature of 514°C is
Cpg = 0.2755 kcal/kg °C, µg = 0.127 kg/m h, kg = 0.0468 kcal/m h °C
Ao = 0.0508 + 2 × 78.7 × 0.00152 × 0.0127 = 0.0538 m2/m
Af = π × 78.7 × (2 × .0508 × .0127 + 2 × .0127 × 0.0127 + .00152 × 0.0508 + 2 × .00152 × .0127) = 0.427 m2/m
At = 0.427 + π × .0508 × (1 − 78.7 × .00152) = 0.567 m2/m
S = clearance between fins = (1/78.7) − .00152 = 0.0112 m

Appendix E: Calculations with Finned Tubes |
425 |
Density at an average gas temperature of 514°C is ρg = 12.17 MW/Tg = 12.17 × 28.38/787 = 0.4388 kg/m3
Pg = 0.205 × (0.0676 − 0.00394)× 10.4142 × 6 = 19.3 mm wc. 0.4388
Steam-Side Pressure Drop
Let us estimate the total developed length. From Appendix B, Le = 3.1 × 6 × 18/9 + 32 ×
.044 × 18/9 (9 streams) = 54 m. (Standard bend data from Table B.7 were used). Friction factor is 0.02. From steam tables, the specific volume of steam at 50 kg/cm2 g and 315°C is obtained as 0.04868 m3/kg.
Hence, using the equation from Table B.1, ΔP = 0.6375 × 10−12 × 0.02 × 54 × (25,000/9)2 × 0.04868/0.0445 = 1.57 kg/cm2 (22.3 psi) (154 kPa).
Inlet velocity of steam = 3.46 × 10−4 × (25000 / 9)× 0.0394 = 19.6 m/s 0.0442
Exit velocity = 19.6 × 0.0554/0.0394 = 27.5 m/s (specific volumes of steam at inlet and exit are 0.0394 and 0.0554 m3/kg, respectively)
Inlet velocity head = 19.6 × 19.6/(2 × 9.8 × 0.0394) = 497 kg/cm2. Loss = 0.5 × 497 (half the velocity head) = 248 kg/m2 = 0.025 kg/cm2.
Exit velocity head = 27.5 × 27.5/(2 × 9.8 × 0.0554) = 696 kg/m2. Exit loss = 0.07 kg/cm2 (one velocity head).
Total pressure drop = 1.57 + 0.025 + 0.07 = 1.67 kg/cm2. It may be seen that these calculations are tedious. Hence, a computer program developed for the purpose is used.
High Fin Density in Superheaters Is Not Recommended
Many HRSG suppliers, in order to reduce the cost of fabrication, use high-density fins in superheaters; high fin density reduces the number of rows along gas flow path for the same cross section of the HRSG, and hence, some labor may be saved; however, it is not a good practice when gas and steam temperatures are high. When the tube-side heat transfer coefficient is low as in superheaters (compared to evaporators or economizers), high fin density not only increases the heat flux inside the tubes but also increases the tube wall temperature and gas pressure drop. This increases the operating cost as well as cost of materials or reduces the life of the superheater. It may be fine with low steam temperature applications where tube wall temperature is not in severe creep range. This point is illustrated in the following example [5,6].
Example E.2
A simple finned tube superheater design with T11 material and alloy steel fin is presented with several solid fin density options. Tube size is 50.8 × 3.1 mm. There are 24 tubes/row, and effective length is 3.1 m. Fin height is 15 mm, and thickness is 1.52 mm. Fin density is varied to study the superheater performance for the same duty. The tubes are in staggered fashion and in counter-flow direction. Steam pressure is 35 kg/cm2 a (3431 kPa) at the superheater inlet.
 Stress 1000 psi
Appendix E: Calculations with Finned Tubes |
429 |
Let us try 435°C as steam temperature. Qa = (787.5 − 669) × 60,000 = 7.1 × 10⁶ kcal/h. Gas temperature drop = 234°C. Hence, exit gas temperature = 800°C − 294°C = 506°C.
LMTD = 234°C. Qt = 35.3 × 908 × 234 = 7.5 MM kcal/h. Hence, the assumed steam temperature is lower than what it should be. More iterations such as these are required, but assuming 439°C, we get Qa = 60,000 × (789.7 − 669) = 7.24 MM kcal/h. Gas temperature drop = 299°C. Exit gas temperature is 501°C. LMTD = 224°C. Qt = 908 × 35.3.2 × 224 = 7.18 MM kcal/h. Now Qa and Qt agree closely. One should now perform detailed calculations as shown in Example E.1 to arrive at the duty more accurately. The U value will be slightly higher due to the higher average gas temperature and can be shown to be 35.8 kcal/m2 h °C. Also the steam-side coefficient will be slightly higher due to the lower steam temperature (see Appendix B).
Method 2
The NTU method discussed in Appendix A is another way of handling this problem. The specific heat of steam may be estimated as Cps = (789.7 − 669)/(439 − 249) = 0.635 kcal/kg °C using the steam temperatures obtained earlier. Let us use 0.3061 as specific heat of gas from Appendix F at 650°C for natural gas products of combustion.
Qt = Cmin (tg1 − ts1 )
= [1 − exp {−NTU (1 + C)}]/(1 + C) for parallel-flow exchanger.
Cmin = 80,000 × .99 × 0.3061 = 24,243. Cmax = 60,000 × 0.635 = 38,100 C = 24,243/38,580
=0.636. (1 − C) = 0.364. NTU = UA/Cmin = 35.8 × 908/24,243 = 1.34
Hence, = [1 − exp(−1.34 × 1.636)]/1.6284 = 0.543.
Hence, Qt = 0.543 × 24,243 × (800 − 249) = 7.25 MM kcal/h
Exit gas temperature = 800 − 7.25 × 10⁶/(80,000 × 0.3061 × 0.99) = 501°C Exit steam temperature = 249 + 7.25 × 10⁶/(60,000 × 0.636) = 439°C.
The predicted performance is shown in column 2. The other values may be calculated as shown in Example E.1.
In counter-flow arrangement, the steam exit end will always see the higher tube wall temperature. However, in parallel-flow arrangement, one has to calculate the tube wall temperatures at both the steam inlet end and exit end.
Heat flux inside the tube at the exit in parallel-flow mode = 35.8 × (501 − 439) × 10.9 = 24193 kcal/m2 h. Inner wall temperature = 439 + 24,193 (0.0002 + 1/1,363) = 462°C.
At the gas inlet end, heat flux = 35.8 × (800 − 249) × 10.9 = 215,011 kcal/m2 h. Inner wall temperature = 249 + 215,011/(0.0002 + 1/1,363) = 450°C.
With counter-flow arrangement, the steam exit end will see the hottest temperature. Heat flux = 35.3 × (800 − 472) × 10.9 = 125,820 kcal/m2 h. Tube wall temperature = 473 + 125,820/(0.0002 + 1/1,333) = 593°C. If we consider the actual heat transfer coefficients at the inlet and exit conditions, the heat flux will be higher and hence the tube wall temperatures. Also, some margins over calculated values are used in practice. These are shown in the Table E.6. One can see that the wall temperatures are much lower with parallel-flow arrangement.
How Does Gas-Side Heat Transfer Coefficient Vary with Fin Density?
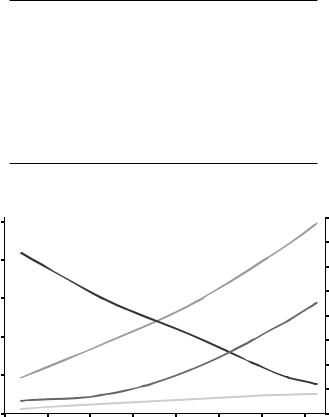
With finned tubes, the surface area variations with fin geometry can be significant. The following data were used in generating Figure E.4 for a boiler evaporator. Gas flow is 100,000 kg/h at 560°C in and 300°C out, 51 × 44 mm tubes, serrated fins of height 19 mm, 1.5 mm thick and 4 mm serration, with fin density varying from 78 to 236 fins/m and staggered tubes at 101 mm transverse and longitudinal spacing.
Appendix E: Calculations with Finned Tubes |
431 |
Figure E.4a through c show the gas pressure drop, convective heat transfer coefficient, and fin effectiveness as a function of gas mass velocity for various fin densities ranging from 78 to 236 fins/m. It is seen that for a given gas mass velocity,
1.The heat transfer coefficient increases as the fin density decreases
2.The gas-side pressure drop for the same number of rows deep increases as the fin density increases
3.Fin effectiveness is slightly higher for the higher fin density; however, the U value will be lower as will be shown later
Hence, one may see a wide variation in surface areas for a given duty depending on fin geometry used and should not be carried away by a large surface area in finned tube components as ηhc varies and hence the U value, which is close to hc.
Effect of hi on Fin Selection
The tube-side coefficient plays a dominant role in the selection of fin geometry. If the tubeside heat transfer coefficient is small, then it does not pay to use a large fin surface on the tube to take the advantage of finning. For example, in a tubular air heater, both the gasside and air-side heat transfer coefficients are comparable, and hence, it does not make sense to use fins on the tubes. In a boiler superheater, the tube-side coefficient is reasonably high but not as much as that in the economizer or evaporator. Hence, we should use low fin density on a superheater. Using 5 or 6 fins/in. does not make sense on a superheater as it unnecessarily increases the heat flux inside the tubes and increases the tube wall temperature and reduces the superheater life as shown earlier. In an economizer or evaporator, the tube-side coefficient is very high compared to that on the gas side, and hence, we can afford to use 5 or even 6 fins/in.
The following example shows why the finning is not effective when the tube-side coefficient is small.
Example E.4
Over a tube bundle, 150,000 kg/h of flue gas from the combustion of natural gas at 600°C flows. The tube-side coefficient is 150 kcal/m2 h °C (174 W/m2 K) in one case and 7000 kcal/m2 h °C (8140 W/m2 K) in another case. For both cases, study the performance using fins of density 216 fins/m versus 78 fins/m. Fin height = 19 mm, serration = 4, thickness = 1.5 mm, staggered tubes.
The following conclusions may be drawn (Table E.7):
1.When the tube-side coefficient is very low, it is not productive to use a high fin
density. The ratio of Ui values between 216 and 78 fins/m (tube-side coefficient) is only 1.19 with hi = 150 kcal/m2 h °C when we have used 2.12 times the surface area. That is, if we have 2.12 times increase in surface area, we should get at
least some increase in Ui close to 2.0. With higher tube-side coefficient, for the surface area increase ratio of 1.46, we get about 1.71 times increase in Ui, which is much better. That is, the use of high fin density is justified when tube-side coefficient is high. Else, it is counterproductive.
432 |
Appendix E: Calculations with Finned Tubes |
TABLE E.7
Effect of Tube-Side Coefficient on Finned Bundle Performance
Item |
Case 1 |
Case 2 |
Case 3 |
Case 4 |
|
|
|
|
|
Tube-side coefficient |
7000 |
7000 |
150 |
150 |
Duty, MM kcal/h (MW) |
11.64 (13.53) |
11.50 |
11.55 |
11.5 |
Gas press. drop, mm wc |
43 |
31 |
220 |
106 |
Tube wall temp., °C |
344 |
305 |
550 |
513 |
Number of rows deep |
6 |
10 |
28 |
32 |
Uo, kcal/m2 h °C |
40.1 |
56.9 |
8.45 |
17.8 |
Heat flux inside tubes |
175,235 |
117,235 |
42,265 |
36,675 |
Fin density, fins/m |
216 |
78 |
216 |
78 |
Ui, kcal/m2 h °C |
571 |
334 |
120.4 |
104.4 |
Ratio Ui |
1.71 |
|
1.19 |
|
Ratio ΔPg |
1.39 |
|
2.07 |
|
Surface area, m2 |
1,573 |
1,080 |
7,340 |
3,456 |
Ratio of surface area |
1.456 |
|
2.12 |
|
Note: 36 tubes/row, 3.65 m length, ST = SL = 101 mm. Heat flux in kcal/m2 h.
2.The gas pressure drop increases by only 1.39 times when hi is 7000 kcal/m2 h °C, compared to 2.07 times when we have hi = 150 kcal/m2 h °C. The gas pressure drop increase is too much.
3.The tube wall temperature is also very high when we use fins with hi = 150 kcal/m2 h °C, which is obvious as the temperature drop across the low tubeside film is much higher.
Tube-side film temperature drop with hi = 150 kcal/m2 h °C and fins/m of 216 = 42,265/150 = 282°C, while with hi = 7,000 kcal/m2 h °C, the tube-side film drop = 175,235/7,000 = 25°C only. Thus, tubes also run much hotter when high fin densities are used in low tube-side heat transfer coefficient cases.
The bottom line is as follows: Avoid fins when tube-side coefficients are very low. In superheaters where hi can be in the range of 1200–1600 kcal/m2 h °C, use 78–119 fins/m and not more; otherwise, the heat flux inside the tubes will shoot up, increasing the tube wall temperature and decreasing the life of the superheater. The author has seen several designs of superheaters using 5 fins/in. or even 6. This is a very poor design. Some boiler suppliers do this either without the knowledge of heat flux and tube wall temperatures (whose ill effects will be seen after the warranty period usually!) or with an eye on reducing the number of tubes deep, which reduces the manufacturing costs. The end user is stuck with such poor designs as the life is reduced when superheater tubes operate continuously at a higher temperature.
Effect of Fin Geometry on Heat Transfer Coefficients
When the tube-side heat transfer coefficient is large as in evaporator or economizer, then a high density makes sense. Here is an example of an evaporator designed with different fin densities. The tube length and spacing were adjusted slightly to obtain the same duty and gas pressure drop.

Appendix E: Calculations with Finned Tubes |
|
|
433 |
|
TABLE E.8 |
|
|
|
|
Effect of Fin Geometry in Evaporator |
|
|
|
|
|
|
|
|
|
Item |
Case 1 |
Case 2 |
Case 3 |
Case 4 |
|
|
|
|
|
Gas temperature in, °C |
600 |
600 |
600 |
600 |
Gas temperature out, °C |
281 |
281 |
281 |
281 |
Duty, MM kcal/h (MW) |
8.53 (9.92) |
8.54 |
8.53 |
8.52 |
Gas pressure drop, mm wc |
50 |
48 |
50 |
50 |
Steam flow, kg/h |
15,230 |
15,235 |
15,230 |
15,215 |
Fins/m, height, thickness, serration |
78 × 15 × 1.5 × 4 |
117 × 15 × 1.5 × 5 |
157 × 15 × 1.5 × 4 |
197 × 15 × 1.5 × 4 |
ST × SL (staggered) |
90 × 90 |
92 × 90 |
92 × 90 |
90 × 90 |
Tubes/row |
20 |
20 |
20 |
20 |
Number of rows deep |
16 |
13 |
11 |
9 |
Length, m |
5 |
5 |
5 |
5.5 |
Weight of tubes, kg |
10,750 |
10,850 |
10,700 |
11,000 |
Uo, kcal/m2 h °C (W/m2 K) |
60 (69.8) |
53.5 (62.2) |
49.2 (57.2) |
44.6 (51.9) |
Tube wall temperature, °C |
293 |
303 |
313 |
320 |
Surface area, m2 |
1,075 |
1,207 |
1,310 |
1,440 |
Heat flux inside tubes, kcal/m2 h |
102,500 |
126,200 |
148,900 |
164,600 |
Note: Reduce weight of tube bundles using smaller tubes.
Example E.5
In an HRSG evaporator, 100,000 kg/h of gas turbine exhaust at 600°C is cooled to 281°C. Tubes are 50.8 × 44 mm. Arrangement is staggered. Steam pressure is 39 kg/cm2 g (saturation temperature is 249°C) and feed water is at 105°C. Fouling factors are 0.0002 m2 h °C/kcal on both gas and steam sides.
Analysis: All the options have nearly the same weight, duty, and gas pressure drop and cross section (Table E.8).
•The number of rows deep is lesser when the fin density is higher. Hence, one can evaluate the cost of the bundle considering material and labor costs and choose the best option. In some locations, cost of labor may be low, and hence, lower fin density option may work out to lower cost as cost of finned tubes will be lower, and more rows can be assembled at an overall attractive cost.
•Surface areas are higher with higher fin density as expected due to the lower heat transfer coefficients with higher fin densities.
•Heat flux inside the tubes is higher with higher fin densities. However, considering the steam pressure, these heat fluxes are acceptable as discussed in Chapter 2.
•The tube wall temperature is higher with higher fin density due to higher heat flux. Hence, plant engineers should ask for this information also when obtaining quotes from various vendors. It is likely that some vendors may have offered designs with much higher gas velocity and high gas pressure drop with higher heat flux inside the tubes and consequent higher tube wall temperatures.
Reduce Weight of Tube Bundles Using Smaller Tubes
It is possible to reduce the weight of a boiler using smaller tubes for the same duty and gas pressure drop values. This is true for plain as well as finned tubes. The reason is the higher heat transfer coefficient with smaller-diameter tube. The weight of the tube

434 |
Appendix E: Calculations with Finned Tubes |
bundle will also be less. However, the number of tubes used will be more with smaller tube option, which may increase the labor cost or cost of fabrication of the boiler as the number of tubes to be welded increases as the tube diameter decreases. Hence, the decision must be made based on not only the cost of material and weight of boiler but also the cost of fabrication.
Example E.6
Here is an example of an HRSG with an evaporator and economizer generating saturated steam at 40 kg/cm2 g using feed water at 111°C. Exhaust gas flow = 150,000 kg/h at 580°C and analysis is % volume CO2 = 3, H2O = 7, N2 = 75, O2 = 15. Two options were considered in the design of the HRSG. One uses 50.8 tubes for the evaporator and economizer, while the other uses 38 mm tubes for evaporator and economizer. Tubes are all in staggered arrangement. Tables E.9 and E.10 show the geometry for both options, while Table E.10 shows the performance results.
1.Total gas pressure drop and duty are same for both the options. Steam production is the same.
2.It is seen that the 38 mm tube option has higher heat transfer coefficients about 3%–8%.
3.The 38 mm tube option has lower weight; about 60,000 kg versus 67,500 kg for the 51 mm tube option. With large boilers, this may be a deciding factor as shipping costs can be lowered.
4.The evaporator has 720 tubes and economizer has 561 tubes to be welded in the 38 mm option, while the 51 mm tube option has only 540 tubes in the evaporator and 420 in the economizer. In countries where labor costs are high, this may be a deciding factor.
Hence, based on local conditions, shipping, cost of labor or materials, and cost of fabrication, one may make suitable decisions. This exercise shows that with smaller tubes, it is possible to lower the weight of boilers and perhaps the shipping and manufacturing costs also.
TABLE E.9
Geometrical Data for 38 and 50.8 mm OD Tubes
Item |
Evaporator |
Economizer |
Evaporator |
Economizer |
|
|
|
|
|
Tube OD, mm |
38 |
38 |
50.8 |
50.8 |
Tube ID, mm |
31.8 |
31.8 |
43 |
43 |
Fins/m |
197 |
197 |
197 |
197 |
Fins height, mm |
19 |
19 |
19 |
19 |
Fin thickness, mm |
1.5 |
1.5 |
1.5 |
1.5 |
Serration, mm |
4 |
4 |
4 |
4 |
Tubes/row |
36 |
33 |
30 |
30 |
Number of rows deep |
20 |
17 |
18 |
14 |
Length, m |
5 |
5 |
5.3 |
5.3 |
Transverse pitch, mm |
88 |
88 |
101 |
101 |
Longitudinal pitch |
88 |
88 |
101 |
101 |
Streams |
— |
11 |
— |
6 |
Arrangement |
Staggered |
Staggered |
Staggered |
Staggered |
Flow direction |
|
Counter-flow |
|
Counter-flow |
|
|
|
|
|
Appendix E: Calculations with Finned Tubes |
|
|
435 |
|||
|
TABLE E.10 |
|
|
|
|
|
|
Performance Results for 38 and 50.8 mm OD Tubes |
|
|
|
||
|
|
|
|
|
||
|
Item |
Evaporator-38 Economizer-38 |
Evaporator-51 Economizer-51 |
|||
|
|
|
|
|
|
|
|
Gas temp. in, ±5°C |
580 |
253 |
580 |
253 |
|
|
Gas temp. out, ±5°C |
253 |
149 |
253 |
150 |
|
|
Gas spec. heat, kcal/kg °C |
0.2715 |
0.2584 |
0.2715 |
0.2584 |
|
|
Duty, MM kcal/h |
13.18 |
3.99 |
13.18 |
3.95 |
|
|
Surface area, m2 |
5,023 |
3,914 |
5,190 |
4,036 |
|
|
Gas pressure drop, mm wc |
65 |
46 |
73 |
40 |
|
|
Fouling factor—gas |
0.0002 |
0.0002 |
0.0002 |
0.0002 |
|
|
U, kcal/m2 h °C |
39.51 |
36.64 |
38.01 |
33.80 |
|
|
LMTD, °C |
67 |
28 |
67 |
29 |
|
|
Gas velocity, m/s |
15 |
10 |
16 |
10 |
|
|
Weight, kg |
33,662 |
26,228 |
37,962 |
29,526 |
|
|
Fluid temp. in, ±5°C |
233 |
111 |
232 |
111 |
|
|
Fluid temp. out, ±5°C |
251 |
233 |
251 |
232 |
|
|
Pressure drop, kg/cm2 |
— |
1.39 |
— |
1.47 |
|
|
Fouling factor—fluid |
0.0002 |
0.0002 |
0.0002 |
0.0002 |
|
|
Fluid velocity, m/s |
— |
1.1 |
— |
1.1 |
|
|
Steam flow, kg/h |
30,760 |
|
30,687 |
— |
|
|
|
|
|
|
|
|
Inline versus Staggered Arrangement
In the case of plain tubes, using staggered arrangement is not helpful as the increase in overall heat transfer coefficient is not significant while the increase in gas pressure drop is. This fact was illustrated with an example in Appendix C. Hence, plain tubes are often used in inline arrangement only. However, with finned tubes, staggered arrangement may help reduce weight and size for the same duty and gas pressure drop.
Example E.7
Over a finned evaporator bundle, 200,000 kg/h of flue gas from natural gas combustion flows. Gases are cooled from 700°C to 263°C. Using 51 × 43 mm tubes and 216 fins/m × 19 mm high, 1.5 mm thick with 4 mm serration, determine how inline arrangement fares against staggered arrangement. Duty and gas pressure drop should be approximately the same for both options. Steam pressure is 40 kg/cm2 a, and feed water temperature is 120°C.
Solution
Table E.11 shows the results of calculations. Tube length and pitch were slightly manipulated to obtain the same duty and gas pressure drop in column 3 as in column 1 for inline arrangement.
It is seen that due to the higher overall heat transfer coefficient Uo, the staggered arrangement requires fewer tubes and lesser surface area. However, if we do not manipulate the tube spacing or length, the gas pressure drop will be higher. Column 3 shows that when we manipulate the tube pitch and length, the gas pressure drop becomes comparable to the inline arrangement. (Some manufacturers prefer inline arrangement as drilling patterns are simpler or have been streamlined.) Due to the higher heat transfer coefficients in staggered arrangement, the tube wall and fin tip temperatures will be higher than those in inline arrangement.
436 |
|
Appendix E: Calculations with Finned Tubes |
|||
|
TABLE E.11 |
|
|
|
|
|
Inline versus Staggered Finned Evaporator |
|
|
||
|
|
|
|
|
|
|
Item |
Inline |
Staggered |
Staggered |
|
|
|
|
|
|
|
|
Gas flow, kg/h |
200,000 |
200,000 |
200,000 |
|
|
Inlet gas temperature, °C |
700 |
700 |
700 |
|
|
Exit gas temperature, °C |
264 |
263 |
264 |
|
|
Duty, MM kcal/h |
25.29 |
25.37 |
25.31 |
|
|
Steam generation, kg/h |
46,390 |
46,540 |
46,420 |
|
|
Tubes/row |
32 |
32 |
32 |
|
|
Number of rows deep |
20 |
15 |
14 |
|
|
Effective length, m |
5.0 |
5.0 |
5.5 |
|
|
Surface area, m2 |
6,384 |
4,788 |
4,915 |
|
|
Uo, kcal/m2 h °C |
31 |
42.6 |
40.5 |
|
|
Gas pressure drop, mm wc |
93 |
126 |
89 |
|
|
Tube wall temperature, °C |
340 |
374 |
368 |
|
|
Fin tip temperature, °C |
470 |
543 |
530 |
|
|
Transverse pitch ST, mm |
101 |
101 |
103 |
|
|
Longitudinal pitch, SL, mm |
101 |
101 |
101 |
|
Effect of Tube-Side Fouling
When tube-side fouling is likely, finned tubes are not attractive. Higher the ratio of fin to tube inner surface, poorer its performance will be. (This is similar to the use of high fin density when tube-side coefficient is low.) To illustrate this point, an evaporator has been designed for the same duty conditions in clean conditions, and then its performance is checked when tube-side fouling builds up. Results are shown in Table E.12.
TABLE E.12
Effect of Tube-Side Fouling
Item |
Case 1 |
Case 2 |
|
Case 3 |
|
Case 4 |
Case 5 |
Case 6 |
|
|
|
|
|
|
|
||
Gas temp. in, °C |
600 |
600 |
600 |
600 |
600 |
600 |
||
Gas out, °C |
339 |
356 |
339 |
379 |
340 |
398 |
||
Duty, MM kcal/h |
7.56 |
7.15 |
7.56 |
6.43 |
7.51 |
5.88 |
||
Gas press. drop, mm wc |
30 |
30.5 |
11 |
|
11.5 |
12.5 |
13.5 |
|
Steam flow, kg/h |
13,860 |
13,115 |
13,840 |
11,788 |
13,780 |
10,780 |
||
Fins—n × h × t |
None |
None |
78 |
× 19 × 1.5 |
78 |
× 19 × 1.5 |
216 × 19 × 1.5 |
216 × 19 × 1.5 |
ST × SL |
76 × 76 |
76 × 76 |
95 |
× 95 |
95 |
× 95 |
95 × 95 |
95 × 95 |
Tubes/row |
30 |
30 |
28 |
|
28 |
|
28 |
28 |
Number of rows deep |
20 |
20 |
10 |
|
10 |
|
6 |
6 |
Length, m |
6 |
6 |
5 |
|
5 |
|
5.3 |
5.3 |
Tube-side fouling |
0.0002 |
0.002 |
0.0002 |
0.002 |
0.0002 |
0.002 |
||
Uo, kcal/m2 h °C |
69.3 |
60.6 |
34.39 |
25.27 |
22.1 |
14.1 |
||
Ratio At/Ai |
1.18 |
1.18 |
6.08 |
6.08 |
14.75 |
14.75 |
||
Heat flux inside tubes |
28,703 |
25,128 |
73,390 |
53,928 |
114,417 |
73,000 |
||
Tube wall temp., °C |
262 |
310 |
281 |
378 |
299 |
421 |
||
Notes: Gas flow = 100,000 kg/h, 50.8 × 43 mm tubes, steam pressure = 40 kg/cm2 a, feed water = 120°C. Gas-side fouling = 0.0002 m2 h °C/kcal (0.000172 m2 K/W) (heat flux in kcal/m2 h. Inline arrangement of tubes is used.
Appendix E: Calculations with Finned Tubes |
437 |
Cases 1 and 2 are with plain tubes in clean and dirty conditions. Cases 3 and 4 are for 78 fins/m design in clean and dirty conditions. Cases 5 and 6 are for 216 fins/m design in clean and dirty conditions.
1.The cases 1, 3, and 5 are the design cases with plain tubes, tubes with 78 fins/m and tubes with 216 fins/m. Cases 2, 4, and 6 show their off-design performance when tube-side fouling increases from 0.0002 m2 h °C/kcal to 0.002 m2 h °C/kcal (0.000172–0.00172 m2 K/W).
2.In the design cases 1, 3, and 5, the boiler duty and exit gas temperatures are the same, namely, 340°C and hence the steam generation. However, when the tubeside fouling is high, the off-design performance shows significant differences.
3.The loss of duty or steam production is minimal when tubes are plain. The exit gas temperature goes up to only 353°C from 339°C, and steam output drops from 13,860 to 13,115 kg/h, a decrease of 5.5% only. However, when we used 216 fins/m, though the design is for the same steam output, the duty decreases drastically when tube-side fouling increases. The exit gas temperature goes up to nearly 400°C with steam output dropping by 22%! Thus, one should use caution when tube-side fouling is high.
4.The heat flux inside the tubes is also shown. Though Uo and heat flux decrease with higher fouling, the drop across the fouling layer will be much higher. Hence, there is an increase in tube wall temperatures. The tube wall temperature goes up to 421°C when fins/m is 216 compared to 310°C with plain tubes.
Effect of Outside Fouling Factor
The effect of outside fouling factor is not significant. The decrease in duty is marginal with gas-side fouling (Table E.13).
TABLE E.13
Effect of Gas-Side Fouling
Item |
|
Case 1 |
|
Case 2 |
Case 3 |
Case 4 |
|
|
|
|
|
||
Gas temp. in, °C |
600 |
600 |
600 |
600 |
||
Gas out, °C |
339 |
347 |
340 |
345 |
||
Duty, MM kcal/h (MW) |
7.56 (8.79) |
7.33 (8.52) |
7.51 (8.73) |
7.37 (8.56) |
||
Gas pressure drop, mm wc |
11 |
|
11 |
|
12.5 |
12.5 |
Steam flow, kg/h |
13,840 |
13,450 |
13,780 |
13,500 |
||
Fins—n × h × b |
78 |
× 19 × 1.5 |
78 |
× 19 × 1.5 |
216 × 19 × 1.5 |
216 × 19 × 1.5 |
ST × SL |
95 |
× 95 |
95 |
× 95 |
95 × 95 |
95 × 95 |
Tubes/row |
28 |
|
28 |
|
28 |
28 |
Number of rows deep |
10 |
|
10 |
|
6 |
6 |
Length, m |
5 |
|
5 |
|
5.3 |
5.3 |
Gas-side fouling, m2 h °C/kcal |
0.0002 |
0.002 |
0.0002 |
0.002 |
||
Uo, kcal/m2 h °C |
34.39 |
32.36 |
22.1 |
21.23 |
||
Ratio At/Ai |
6.08 |
6.08 |
14.75 |
14.75 |
||
Heat flux inside tubes, kcal/m2 h |
73,390 |
69,059 |
114,417 |
109,930 |
||
Tube wall temp., °C |
281 |
279 |
299 |
297 |
||
|
|
|
|
|
|
|
438 |
Appendix E: Calculations with Finned Tubes |
For the evaporator used in the earlier example, the effect of gas-side fouling was studied for two fin geometries, namely, 78 and 216 fins/m. It is seen that the effect is marginal only, about 2%–3% loss in duty. Hence, tube-side fouling is more serious compared to gas-side fouling.
Optimizing Finned Surface Design
Example E.8
An evaporator has to be designed for the following parameters. Turbine exhaust gas flow = 100,000 kg/h at 600°C in and 315°C out. Duty = 7.65 MM kcal/h. Steam pressure is 40 kg/cm2 g. Tube size 51 × 43 mm and 95 mm square pitch. Steam flow = 14,000 kg/h at 40 kg/cm2 a, and 120°C feed water. How does one arrive at the optimum design?
Solution
Though this problem is often encountered by the boiler supplier, plant engineers should know that several design options are possible with finned tubes. Here is a way to review options for a finned evaporator bundle (one could extend this concept to superheaters and economizers also). It gives the effect of fin geometry and gas velocity on gas pressure drop for the same duty at one glance. Curves are shown for just two fin geometries, but one can work out for different tube sizes and fin geometries and plot the gas pressure drop on one scale and surface area on the other. Now for a desired gas pressure drop, one can select various tube or fin geometry as described later.
It is seen that as fin density increases, the surface area required for the same duty is more. The gas pressure drop is higher for the smaller fin density for the same duty. One can see that the variation in surface area can be 50% for the same duty and gas pressure drop. Hence, while evaluating bids for HRSGs, one should not get carried away by surface areas but understand why there is so much difference. The smaller fins have a higher U as discussed earlier and hence lesser surface area requirements. However, as more rows are required with smaller fins, the gas pressure drop goes up. The results are shown in Figure E.5 as well as in Table E.14.
Let us, say, limit the gas pressure drop to 30 mm wc. As we move from 30 mm wc on the right-hand scale to the left, the line intersects the pressure drop curve. For the 78 fins/m design, the gas velocity to meet this pressure drop is about 19 m/s, while for the 216 fins/m design, it is about 21.5 m/s. Then go up to intersect the corresponding
Surf. area, m2 |
|
|
Gas press drop, mm wc |
|
2100 |
|
|
60 |
|
|
|
55 |
|
|
1900 |
|
|
50 |
|
|
|
45 |
216 ns/m |
|
1700 |
|
|
||
|
|
40 |
||
|
|
78 ns/m |
||
1500 |
|
|
35 |
78 ns/m |
1300 |
|
|
30 |
216 ns/m |
|
|
25 |
|
|
1100 |
|
|
20 |
|
|
|
15 |
|
|
|
|
|
|
|
900 |
17 |
22 |
10 |
|
12 |
27 |
|
||
|
|
Gas velocity, m/s |
|
|
FIGURE E.5
Chart relates gas velocity, pressure drop, and surface area.
Appendix E: Calculations with Finned Tubes |
|
|
|
|
439 |
||||||
|
TABLE E.14 |
|
|
|
|
|
|
|
|
|
|
|
Evaporator Design with Different Gas Velocities and Fin Geometry |
|
|
|
|
||||||
|
|
|
|
|
|
|
|
|
|
|
|
|
Tubes/row |
20 |
20 |
20 |
20 |
20 |
20 |
20 |
20 |
|
|
|
Number of |
13 |
15 |
16 |
7 |
8 |
9 |
8 |
14 |
|
|
|
rows deep |
|
|
|
|
|
|
|
|
|
|
|
Length |
6.22 |
4.67 |
3.73 |
7.71 |
5.78 |
4.62 |
5.5 |
5.0 |
m |
|
|
Fins/m |
78 |
78 |
78 |
216 |
216 |
216 |
216 |
78 |
|
|
|
Fin height |
19 |
19 |
19 |
19 |
19 |
19 |
19 |
19 |
mm |
|
|
Fin thick |
1.5 |
1.5 |
1.5 |
1.5 |
1.5 |
1.5 |
1.5 |
1.5 |
mm |
|
|
Serration |
4 |
4 |
4 |
4 |
4 |
4 |
4 |
4 |
mm |
|
|
Surf. area |
1,334 |
1,155 |
985 |
2,161 |
1,851 |
1,666 |
1,762 |
1,155 |
m2 |
|
|
Uo |
34.3 |
40.4 |
45.7 |
20.9 |
24.5 |
27.5 |
25.1 |
38.9 |
kcal/m2 h °C |
|
|
Gas press. drop |
18 |
35 |
57 |
13 |
26 |
45 |
28 |
28 |
mm wc |
|
|
Gas velocity |
15 |
20 |
25 |
15 |
20 |
25 |
21 |
19 |
m/s |
|
|
Weight |
13,500 |
11,691 |
9,960 |
15,370 |
13,169 |
11,842 |
12,533 |
11,683 |
kg |
|
|
|
|
|
|
|
|
|
|
|
|
|
lines for surface areas. It is seen that for 78 fins/m design, the surface area is about 1200 m2, while for the 216 fins/m design, it is about 1800 m2. Table E.14 shows the actual results from a computer program. The last two columns show the desired design for both the fin geometries.
Developing such charts helps one to understand the effect of fin geometry and also how an optimum design can be arrived at. Based on tubes deep and length and fin geometry, one can estimate the material and labor cost and arrive at an optimum design. Say for 28 mm wc gas pressure and same duty, we have two options; one with 78 fins/m, but it has 14 rows deep, while the 216 fins/m option has 8 rows deep, and though the surface area is more, the labor cost could be less. One can also study the effect of using 38 mm tubes and so on as discussed earlier. Plant engineers need to be aware that a wide difference can exist in tube or fin geometry or surface area for the same performance with finned tube exchangers, and hence, this study explains the reason.
Effect of Fin Thickness and Conductivity
The thickness of fins and the thermal conductivity of fins used in boiler tubes affect the heat transfer, duty, and tube wall and fin tip temperatures and hence should be chosen with care. Thermal conductivity of alloy steels is lower than that of carbon steels as seen in Table E.15. Hence, when we use alloy fins in carbon steel evaporators, then the K value of fin material reduces decreasing the U value and increases the fin tip temperature as shown later. Note that the K value of stainless fins will be much lower than that of carbon steel. When gas inlet temperature is high, say, above 700°C, the boiler is designed with a few rows of plain tubes, followed by a few rows of tubes with alloy steel fins and then followed by several rows of carbon steel fins. As the gas cools, carbon steel fins are used. In finned superheaters, it may be necessary to use the alloy steel fins with alloy steel tubes.
Example E.9
A boiler evaporator uses the following geometry: 50.8 × 44.6 tubes, 36 tubes/row, 15 deep, 5 m long, 101 mm ST,SL, staggered arrangement, 216 fins/m, 19 mm high, 1.5 mm thick, 4 mm serration, 40 kg/cm2 a steam pressure, 105°C feed water. Gas flow = 150,000 kg/h. Study the effect of using alloy steel material for fins and thicker fins.
440 |
|
Appendix E: Calculations with Finned Tubes |
||||
|
TABLE E.15 |
|
|
|
|
|
|
Effect of Fin Thickness and Thermal Conductivity |
|
|
|||
|
|
|
|
|
|
|
|
Gas inlet temperature, °C |
800 |
800 |
800 |
800 |
|
|
Exit gas temperature, °C |
255 |
251 |
254 |
260 |
|
|
Duty |
23.96 |
24.1 |
24.0 |
23.73 |
|
|
Gas pressure drop, mm wc |
66 |
140 |
141 |
61 |
|
|
U , kcal/mm2 h °C |
37.74 |
38.9 |
34.0 |
31.9 |
|
|
o |
|
|
|
|
|
|
Steam generation, kg/h |
42,770 |
43,000 |
42,840 |
42,350 |
|
|
Surface area, m2 |
5,386 |
6,228 |
6,228 |
5,386 |
|
|
Fin conductivity, kcal/m h °C |
30 |
30 |
15 |
15 |
|
|
Fin thickness, mm |
1.5 |
2.67 |
2.67 |
1.5 |
|
|
Max tube wall temperature, °C |
372 |
396 |
377 |
354 |
|
|
Max fin tip temperature, °C |
557 |
532 |
596 |
635 |
|
|
|
|
|
|
|
|
Solution
The results from the computer program are shown as follows. The differences in surface areas are due to the fin thickness though the number of tubes remains unchanged.
The following points may be noted.
1.As fin conductivity decreases for the same fin thickness, duty decreases slightly.
2.As the fin conductivity decreases, the tube wall temperature decreases while the fin tip temperature increases.
3.Flue gas pressure drop increases significantly if fin thickness is increased due to an increase in obstruction area Ao.
4.As the fin thickness increases, the fin tip temperature decreases while the tube wall temperature increases.
Hence, it is not prudent to increase the fin thickness as the operating cost in the form of gas pressure drop increases significantly. If we can keep the tube wall and fin tip temperatures within limits, using a nominal fin thickness of 1.25–1.5 mm is fine; else, we are unnecessarily increasing the weight and cost of the boiler tubes. The boiler duty also does not improve much due to the use of thicker fins. One should also note the impact of using alloy steel fins with low thermal conductivity.
The purpose of this example is to make plant engineers aware of the effect of fin thickness on performance and discuss intelligently with the HRSG suppliers if they use thick fins in their design. The operating costs in the form of gas pressure drop can be reduced by using nominal fin thickness. Thick fins may be required to lower the fin tip temperature in some instances to avoid the use of alloy steel fins.
Why Are Fins Not Used in Gas–Gas Exchangers?
Finned surfaces are not used in tubular air heaters as both the air-side and flue gas–side heat transfer coefficients are in the same range. The effect of adding finned surface will not be reflected in the duty.
Example E.10
Tubes of size 50.8 × 46.4 mm are used in inline arrangement in an air–flue gas exchanger. Three options are reviewed, one with plain tubes and two others with 78 and 197 serrated fins with a fin height of 15 mm and thickness of 1.5 mm and serration width of 4 mm. Calculations for the plain tube exchanger are worked out in Chapter 4 on waste


Appendix E: Calculations with Finned Tubes |
|
|
445 |
||
|
TABLE E.17 |
|
|
|
|
|
Performance of Air Heater with and without Fins |
|
|
||
|
|
|
|
|
|
|
Air Flow |
200,000 |
200,000 |
200,000 |
|
|
|
|
|
|
|
|
Inlet air temperature, °C |
25 |
25 |
25 |
|
|
Exit air temperature, °C |
182 |
182 |
181 |
|
|
Duty, MM kcal/h |
7.69 |
7.67 |
7.64 |
|
|
Air-side pressure drop, mm wc |
97 |
94 |
95 |
|
|
U , kcal/m2 h °C |
28.93 |
8.02 |
3.98 |
|
|
o |
|
|
|
|
|
Surface area, m2 |
1,360 |
4,883 |
9,772 |
|
|
Flue gas flow, kg/h |
225,000 |
225,000 |
225,000 |
|
|
Flue gas temperature in, °C |
375 |
375 |
375 |
|
|
Flue gas temperature out, °C |
253 |
253 |
253 |
|
|
Flue gas pressure drop, mm wc |
30 |
28 |
26 |
|
|
Fins/m |
0 |
78 |
197 |
|
|
Tubes/row |
50 |
50 |
50 |
|
|
Number of rows deep |
57 |
57 |
56 |
|
|
Length, m |
3 |
2.55 |
2.4 |
|
|
Transverse pitch, mm |
82 |
97 |
107 |
|
|
Longitudinal pitch, mm |
70 |
90 |
90 |
|
|
Ratio of external to internal surface area |
1.09 |
4.48 |
10 |
|
|
Weight, kg |
24,300 |
40,300 |
64,900 |
|
|
|
|
|
|
|
The cross section of the exchanger, duty, and pressure drops on air and gas sides are same. However, the surface area of the finned exchangers are much more and also their weight. We are adding weight and cost to the exchanger for the same duty, which is foolish. Hence, the cost of the finned bundle will also be higher. One can see how low the Uo value is reduced as the fin density increases. Hence, finned tubes are not used when the tube-side heat transfer coefficient is comparable with the tube outside coefficient.
A summary of important points about finned tubes is given in Table E.18.
TABLE E.18
What You Should Know about Finned Tubes
The higher the fin surface area, the lower will be the heat transfer coefficient. One should not evaluate finned surfaces by surface area alone. Product of (UA) should be compared and not A alone, which is what many do!
Surface areas in boiler components can vary by 50%–100% for the same duty due to improper selection of fin geometry!
Higher fin surface also results in higher heat flux inside tubes and hence higher tube wall and fin tip temperatures. Life of superheaters is affected by poor selection of fin geometry.
Use smaller fin density when tube-side coefficient is small. For superheaters, 78–117 fins/m is adequate, while for evaporators and economizers, 157–255 fins/m may be fine.
Staggered arrangement is slightly better than inline for finned tubes.
Smaller-diameter tubes with same fin configuration results in a less heavy tube bundle compared to a larger tube diameter bundle.
Fouling inside the tubes impacts finned tubes more than plain tubes through lower duty and higher tube wall temperatures.
Serrated fins give a slightly higher heat transfer coefficient and also higher gas pressure drop.
Using thick fins increases the tube wall temperature while decreasing the fin tip temperature. The duty increases slightly. Hence, fin thickness may be limited to 1.5–1.9 mm. The use of 3 mm or thicker fins may be permitted for a row or two to limit the fin tip temperature but not for the entire HRSG.

446 |
Appendix E: Calculations with Finned Tubes |
References
1.V. Ganapathy, Industrial Boilers and HRSGs, CRC Press, Boca Raton, FL, 2003.
2.ESCOA Corp., ESCOA Fin Tube Manual, Tulsa, OK, 1979.
3.Fin Tube Technologies, Tulsa, OK.
4.V. Ganapathy, Applied Heat Transfer, Pennwell Books, Tulsa, OK. 1982, p501.
5.V. Ganapathy, Evaluated extended surfaces carefully, Hydrocarbon Processing, Oct. 1990, p65.
6.V. Ganapathy, Understand finned heat exchangers, Chemical Engineering, Sept. 2013, p62.