

Distribution of quantitative characteristics of artificial pine plantations on administrative areas
Administrative region |
Number of seals, pcs. |
Area, thousand hectares |
Stock, million m3 |
Volyn |
61811 |
186.3 |
40.7 |
Zhytomyr |
93454 |
269.2 |
67.8 |
Kiev |
54463 |
164.5 |
46.2 |
Lviv |
21343 |
65.2 |
16.6 |
Rivne |
72497 |
205.4 |
40.3 |
Sumy |
16267 |
56.4 |
19.6 |
Khmelnitsky |
11223 |
39.1 |
11.8 |
Chernihiv |
62620 |
254.0 |
81, 2 |
Together |
393678 |
1240.1 |
324.2 |
The total stock of plantations containing Pinus silvestris – 324.2 million m3. The largest area and reserves of artificially created pine forests is Zhytomyr (21.7%) and Chernihiv region (20.5%), the least – Lviv (5.3%), Sumy (4.6%) and Khmelnytsky (3.2%). In the other areas of Polissya, plantings of this tree species are almost equally – from 13% to 17%.
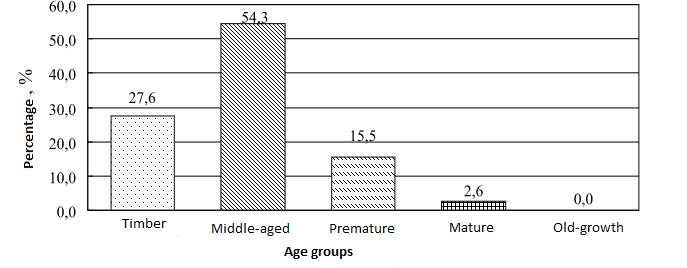
Distribution of area of plantings by age group is shown in picture 1.1. Analyzing the data, we can see that distribution by the age groups is uneven. In this region the most common are medieval pine forests (674.0 thousand hectares or 54.3%), young trees cover 342.4 thousand ha or 27.6% of the area, premature – 191.8 thousand hectares or 15.5%. Quantity of mature and old growth plantations is very little (31.7 thousand hectares), which shows the mass creation of plantations in the postwar years and disadvantages in the organization of forest management in optimizing the age structure.
Fig. 1.1. Distribution of areas of artificial pine forests of Polissya by age group, %
A quantitative description of the distribution of pine plantings by yield classes is shown in picture 1.2.
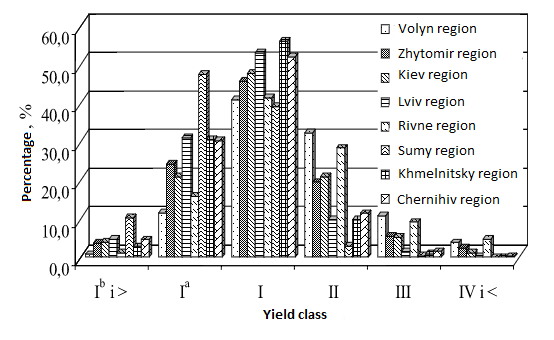
Picture 1.2. Distribution of artificial pine woodland areas by yield classes within administrative areas, %
An analysis of the distribution of areas of artificial pine forest stands on yield classes indicates that most of the region meet high-productive pine – Ia and I yield class, covering 69.6% area of pine plantations. Most of these trees are concentrated in Chernihiv (24.2%) and Zhytomyr (21.8%) regions. The share of pine that describes the second yield class – 19.8%. Negative side of this analysis shows high quantity of pine plantation areas that have III and less yield class – 7.3% and a relatively low number of high yield level class plantations (Ib and above), which quantity stands 3.4%.
In picture 1.3, you can find the distribution of areas of artificial Pinus sylvestris plantations with relative completeness within the administrative regions, which traces the predominance of plantations with a relative completeness of 0.7 and 0.8. The share of these plantations is respectively 28.2% and 44.5%, including Zhytomyr region – 21.9%, Chernihiv region – 20.3%, Rivne region – 17.9%, Volyn region – 15.1%, Kyiv region – 12.1%, in Sumy, Lviv and Khmelnytsky – 4.8%, 4.7% and 3.2% respectively. The share of pine plantations with a fullness of 0.5 and below stands 1.4%, of which 29.7% located in the Rivne region.
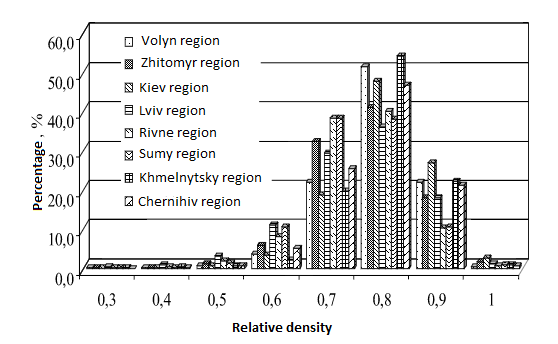
Pic. 1.3. Distribution of artificial pine woodland areas according to their relative completeness within administrative areas, %
Average valuation indicators of artificial pine plantations are given in Table. 1.2. The most productive pine woodlands grow in Sumy and Chernihiv regions (average supply of 338 and 305 m3 · ha-1 respectively), but where their area is not significant. In these areas, the pine trees have the highest average age, diameter and height. The average relative fullness of plantings of the mentioned wood species in all administrative areas is almost the same and ranges from 0.74 to 0.80. Lowest average valuation rate have pine woodlands in Volyn and Rivne regions.
Table 1. 2