

Gels 2018, 4, 39 |
7 of 15 |
That is, in L-ECM, molecular bonds are formed and the structure is expected to change or be extremely intertwined. In addition, it was suggested that the typical relaxation time of L-ECM is short since the decrease of G00 at increasing frequencies was not confirmed in the L-ECM.
2.3.3. Temperature Dependence
The temperature dependence (Figure 5E,F) was investigated at a strain of 5% and a frequency of 1 Hz. As a result of the measurement of the G0 and G00 values in the course of the transition from low to high temperatures, PI Col elicited constant G0 and G00 values as a function of temperature, but began to decrease after a certain temperature. This decline began at the porcine collagen denaturation temperature of 37 C. It seems that the physical properties of the material changed due to protein denaturation. However, G0 and G00 decreased gradually with temperature increases in the case of L-ECM, and a sudden decrease in the elastic modulus was observed at the same temperature as that observed in the case of the PI Col.
Based on the dynamic viscoelasticity evaluation of the L-ECM solution, it was confirmed that its elastic behavior became prominent and dominant in a concentration-dependent manner. In addition, this elicited behavior can be primarily attributed to the small number of molecular associations, and secondarily attributed to the weak intermolecular forces of the L-ECM constituent components. In the ImageJ analyses of the SDS-PAGE results, the proportion of chains was larger in PI Col than in I Col, and the proportion of chains was larger in L-ECM than in PI Col. The removal of the telopeptide decreased the fibrillogenic ability of collagen [20]. Based on this finding, it is considered that in the L-ECM there are few molecules associated with collagen chains, and the entanglement between molecules is poor. Secondly, it is a multicomponent mixed system. It has been reported that molecules, such as proteoglycans and fibronectin, affect the fibril formation of collagen due to their coexistence with collagen [21–23]. Thus, it is suggested that repulsion between molecules exists owing to the multicomponent system.
2.4. SEM Gel Observations
SEM images of L-ECM and the I Col gel are shown in Figure 6. Since these photos were obtained by dehydration treatment, there is no guarantee that they accurately indicate the state of the ECM in the actual hydrogel. However, these images are important data to infer the skeleton structure of ECM gel [15,24]. Fibrous skeleton was observed in all samples. When comparing (A) the 3 mg/mL I Col gel and (B) the 10 mg/mL L-ECM gel samples, the densities of the fibers constituting the gels are comparable, whereas the fiber diameter in the 3 mg/mL I Col gel sample was thicker than that in the 10 mg/mL L-ECM gel sample. In addition, when comparing (B) the 10 mg/mL L-ECM and (C) the 20 mg/mL L-ECM gel samples, the fiber diameter was comparable. However, the fiber density was higher in the 20 mg/mL L-ECM gel sample compared to the 10 mg/mL L-ECM gel sample. Therefore, the diameters of the fibers constituting the gel of the 10 mg/mL L-ECM gel sample were smaller than those of the 3 mg/mL I Col gel sample, but the fiber densities were almost equal. In addition, the fiber density of the 20 mg/mL L-ECM gel was the highest at the conditions at which the tests were conducted. In other words, it was quantitatively found that the skeleton fiber diameter depends on the constituent components, and the fiber density depends on the concentration. In addition, these differences may be the result of other ECM components affecting the spontaneous self-assembly of type I collagen in L-ECM.
Spheroid, a spherical aggregate formed by the assembly of a large number of hepatocytes, expresses relatively better liver-specific functions [25,26]. However, hepatocytes embedded in spontaneously self-assembled collagen gel express liver functions that are equivalent to those of spheroids, even in the dispersed single cell state [9]. Furthermore, collagen gel-embedded hepatocyte spheroids express liver functions that are much higher than the above [9]. In other words, the in vivo-like self-assembled collagen fiber network is meaningful for cell culture and related tissue engineering applications. Therefore, L-ECM [11] gel, which has a synergistic effect with this collagen

Gels 2018, 4, 39 |
8 of 15 |
Gels 2018, 4, 39 |
8 of 15 |
Gels 2018, 4, 39 |
8 of 15 |
fiber network and other ECM components (such as GAGs capable of growth factor immobilization), |
|
fiber network and other ECM components (such as GAGs capable of growth factor immobilization), |
|
is expected be important substrate |
liver tissue formation. |
fiberis expectednetworktoandbe anotherimportantECM componentssubstratepromoting(such as GAGsfunctionalcapableliveroftissuegrowthformafactorion.immobilization), is expected to be an important substrate promoting functional liver tissue formation.
Figure 6. (A |
mg/mL L-ECM |
|
Figure 6. (A) SEM images of 3 mg/mL I Col gel, (B) 10 mg/mL L-ECM gel, and (C) 20 mg/mL L-ECM |
||
Figuregel samples6. (A)(allSEMimagesimagesareofshown3 mg/mLat aImagnificationCol gel, (B) 10ofmg/mL1000 timesL-ECM. Scaleg l,bandr = 10(C)μm)20 mg/mL. |
L-ECM |
|
gel samples (all images are shown at a magnificati |
of 1000 times. Scale bar = 10 m). |
|
gel samples (all images are shown at a magnificationof 1000 times. Scale bar = 10 μm). |
|
|
2.5. Immunostaining of L-ECM Gel
2.5. Immunostaining of L-ECM Gel
2.5. Immunostaining of L-ECM Gel
Immunostaining images of L-ECM gel are shown in Figure 7. Fluorescence was confirmed only
Immunostaining images of L-ECM gel are shown in Figure 7. Fluorescence was confirmed only in theImmunostainingcase where the typeimagesI collagenof L-ECMantibodygel arewasshownusedininFigurethe I Col7. Fluorescencegel sample. Evenwas confirmedif differ ncesonlyin
in theincasethe casewherewherthee thetypetypIecollagenI collagenantibodywaswasusedusedininthetheI ColI Colgel samplegel sample. Even. ifEvendifferencesdifferencesin fluorescence int nsity w re bserved, red fluorescence was observed in the L-ECM gel when any
in fluorescencefluorescenceantibody wasintensityused. Amongwere allobserved,of the stainedredredfluorescencefluorescenceimages, thewasstrongestwasobservintensirvedtheyinintheLred-ECMLfluorescence-ECMgel whengel whenwasany any antibodyantibodydetectedwaswusedhenas usedthe. Among.typeAmongI collagenallallofofthetheansstainedibodyainedwasimages,usedthe. Instrongestherstrongestwords,intensityintensitywas suggredin rfluorescencestedfluorescencethat thewasL- was detectdetectedECMwhengelwhenisthea functionaltypethe typeI collagenIgelcollagensubstratumantibodythatwaswasconsistuseded. In.ofInottotherrECMwords,componentsititwaswassuggestedthat weretthattheoriginallyL-ECM
ECMpresentgelinisthea functionalliver. gel substratum that consisted of the ECM components that were originally
gel is a functional gel substratum that consisted of the ECM components that were originally present
present in the liver. in the liver.
Figure 7. Fluorescent immunostaining images of I Col and L-ECM gel (scale bar = 50 μm).
Figure 7. Fluorescent immunostaining images of I Col and L-ECM gel (scale bar = 50 m).
2.6. Rheological Properties of Gelation Behavior of L-ECM
2.6. Rheological Properties of Gelation Behavior of L-ECM
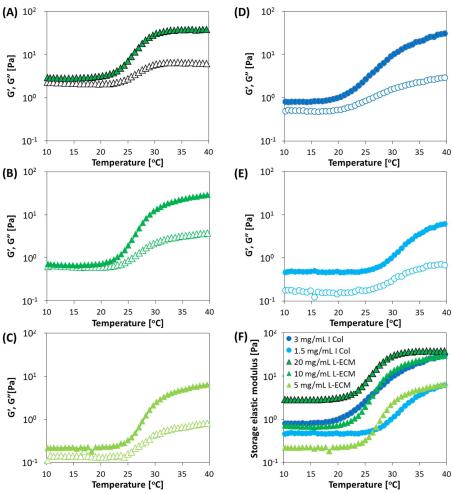
2.6. RheologicalThe gelationPropertiesbehaviorsof Gelationof LBehavior-ECM andof LI -ColECMare shown in Figure 8. For all of the studied
conditions,The gelatioan ncreasebehaviorsin theof elasticL-ECMmodulusand I Colwasareconfirmedshown inasFigurethe tempe8. Foratureall ofincreasedthe studied. In
The gelation behaviors of L-ECM and I Col are shown in Figure 8. For all of the studied conditions, conditions,addition, theanlossincreaseelasticin moduthe elasticus nevermodulusexceededwas confirmedthe storageasmodulusthe temperaturewithin theincreasedmeasured. In
an increase in the elastic modulus was confirmed as the temperature increased. In addition, the loss addition,temperaturetherangeloss.elasticHere, similarmodulusgelationneverbehaviorsexceededwereth observstoragedmodulusbetween 10withinmg/mLtheL-measureECM and
elastictemperaturemodulus neverrange.exceededHere, similarthegelationstoragebemodulushaviors werewithinobservedthe measuredbetween 10temperaturemg/mL L-ECMrangeand. Here,
3 g/mL I Col solutions. In fact, in the pr liminary study using rat L-ECM, the content of type I similar3 mg/mLgelationI Colbehaviorssolutionswere. In fact,observedin the preliminarybetween 10studymg/mLusingL-ECMrat L-ECM,and 3themg/mLcontentI Colof typesolutionsI .
In fact, in the preliminary study using rat L-ECM, the content of type I collagen was only about half of L-ECM (data not shown). Though there may be some effects of differences in species, their similarity in gelation kinetics can be deduced to be reasonable.
Gels 2018, 4, 39 |
9 of 15 |
Gels 2018, 4, 39 |
9 of 15 |
collagen was only about half of L-ECM (data not shown). Though there may be some effects of
differences in species, their similarity in gelation kinetics can be deduced to be reasonable.
Normally, in the solution state, the loss elastic modulus yields a value higher than the storage
Normally, in the solution state, the loss elastic modulus yields a value higher than the storage modulus. Conversely, in the gel, the storage modulus exceeds the loss elastic modulus. This is due to
modulus. Conversely, in the gel, the storage modulus exceeds the loss elastic modulus. This is due to the change to a solid state by gelation, whereby externally applied energy is stored and converted to a
the change to a solid state by gelation, whereby externally applied energy is stored and converted to repulsivea repulsiveforce. However,force. However,the earlithestearliestgel formationgel formationL-forECML-ECMstartedstartedat concentrationat a concentrationof 20ofmg/mL20 .
This ismg/mLthought. Thistoisbethoughtdue totothebe duefr quentto the frequententanglentanglementt of componentsof componentsowingowingto anto ani increasein the conceintrationthe concentrationd relativelyand relativelyearly initiationearly initiationof nucleationof nucleationof fibersof fibersthatthatococcurat theinitialstagestage of fibril offormationfibril formation. .
Figure 8. Change in0 G′ and00G′′ at different concentrations of I Col (3 and 1.5 mg/mL) and L-ECM
Figure 8. Change in G and G at different concentrations of I Col (3 and 1.5 mg/mL) and L-ECM solutions (20, 10, and 5 mg/mL) with the rheometer measurements conducted in a DTR mode. (A) 20 solutions (20, 10, and 5 mg/mL) with the rheometer measurements conducted in a DTR mode. mg/mL L-ECM, (B) 10 mg/mL L-ECM, (C) 5 mg/mL L-ECM, (D) 3 mg/mL I Col, (E) 1.5 mg/mL I Col,
(A) 20 mg/mL L-ECM, (B) 10 mg/mL L-ECM, (C) 5 mg/mL L-ECM, (D) 3 mg/mL I Col, (E) 1.5 mg/mL and (F) storage modulus for all tested conditions. (A–E) Open and closed symbols indicate storage
I Col, and (F) storage modulus for all tested conditions. (A–E) Open and closed symbols indicate and loss moduli, respectively (conditions of DTR: frequency, 1 Hz, and strain, 5%. Temperature was
storageincreasedand lossatmoduli,2°C/minrespectivelyfrom10to40(conditions°C.ThepHofofallDTR:samplesfrequency,wasadjusted1 Hz,toanditsvaluestrain,in5%physiological. Temperature was increasedconditions)at. 2 C /min from 10 to 40 C. The pH of all samples was adjusted to its value in
physiological conditions).
2.7. Degradation Behavior of L-ECM Gel
2.7. Degradation Behavior of L-ECM Gel
The decomposition behaviors of L-ECM and I Col gel by collagenase are shown in Figure 9. TheSampldecompositionunderwent digestionbehaviorswithofcollagenaseL-ECM andat allI Coltestedgelconditiby ons,llagenaseand decareashowne in gelinweightFigure 9.
Samplesoverundtimerwentwas confirmeddigestion. Inwithaddition,collagenasesolutionsatofall10testedmg/mLconditions,L-ECM and 3andmg/mLa decreaseI Col gelinshowedgel weight over time was confirmed. In addition, solutions of 10 mg/mL L-ECM and 3 mg/mL I Col gel showed comparable degradation rates. Since L-ECM is composed of atelocollagen from which telopeptide had been removed, it can be easily degraded by proteases. The condition with the highest degradation

Gels 2018, 4, 39 |
10 of 15 |
Gels 2018, 4, 39 |
10 of 15 |
comparable degradation rates. Since L-ECM is composed of atelocollagen from which telopeptide
Gels 2018, 4, 39 10 of 15 comparablehad been removed,degradationit canratesbe. SinceeasilyL-ECMdegradedis composedby proteasesof atelocollagen. The ditionfrom whichwith theelopeptidehighest
haddegradationbeen removed,rate was thatit canforbeI Coleasilygel withdegradedconcentrationby proteasesof 1.5.mg/mL,The conditionand the conditionwwith the hithghestthe ratedegradationslowestwasdegradationthatratefor wasI ColratethatgelwasforwithIthatColcforgelncentrationLwith-ECMconcengelofwith1.ration5 mg/mL,concentrationof 1.5andmg/mL,theofco20andmg/mLitionthe conditionwith. thewithslowestthe degradationslowest degradationrate wasratethatwasfor Lthat-ECMforgelL-ECMwithgela concentrationwith concentrationof 20 mg/mLof 20.mg/mL.
Figure 9. Degradation profiles of I Col gels (3 and 1.5 mg/mL) and L-ECM gels (20 and 10 mg/mL)
Figureusing collagen9. Degradatise solutionprofilesat aofconcentrationI Col gels (3ofand0.051.5mg/mL)asandfunctionL-ECMofgelsincubation(20 and time10 mg/mL)(n = 3,
Figure 9. Degradation profiles of I Col gels (3 and 1.5 mg/mL) and L-ECM gels (20 and 10 mg/mL) usingbars representcollagenasestandardsolutiondeviation)a concentration. of 0.05 mg/mL as a function of incubation time (n = 3, using collagenase solution at a concentration of 0.05 mg/mL as a function of incubation time (n = 3,
bars representstandarddeviation)..
2.8. Stress on Compression of L-ECM Gel
2.8. Stress on Compression of L-ECMGel
The stress-strain curves of L-ECM and I Col gel are shown in Figure 10, and the upper yield pointTheandstresselastic--strainmodulusccurvesofofeachofL-LECM-sampleandandareI ColIshownCgelgelareinareshownTableshown1in. TheFigureincompressionFigure10, and10,theandstressupperthewasupperyielddetectepointyield atpointndallelastictestedand elasticmconditionsdulusmodulusof.eachInofaddition,sampleeach sampleareconcentratioshownare shownin Table-independentTable1. The1compression. The compressionstresponsestresswas detectedectwas ob ainedat all tesatwithalledtestedIconColconditionsand .LIn-ECMaddition,. In. addition,Comparisonconceconcentrationof the-deupperdependent- yieldcomprespointscompressionof respI ColresponseandwasL-obtainedainedECMwas witheach IwithconcentrationCol andI ColL-ECMandyielded.LComparisonparison-ECMmaxi. umof theat 3uppermg/mLof theyieldforupperIpointsCol,yieldanof IitspointsColvalueandofwasL-IECMCol0.0112atandeachN/mmL-ECMconcentration2. The elasticeach yielconcentrationmodulused mwasximumyieldedalso theat a3highestmaximummg/mLatfortheatI 3Col,samemg/mLandconditionsitsforvalueI Col,andwasandits0its.0112valueN/mmwas020.0825.The0112elasticN/mmmodulus2.2.ComparingThe elasticwas alsomodulusthe ItheColhighestwasand alsoL-atECMthesamegelshighestatconditionstheat thesamesameandconceitsnditionstrationv lue was(3andmg/mL),0its.0825valueN/mmthewasupper20. .Comparing0825yieldN/mmpoint2the. ComparingandI Colelasticnd Lthemodulus-ECMI ColgelsofIandatColLthe-ECMweresamegels0concentration.0112andthe same0.0825N/mm(3concentrationmg/ L),2 respectively,the upp(3 mg/mL),yieldwhilepointthethoseupperandofLelasticyield-ECMpointmoduluswereand0.0008andofelasticI Col weremodulus0.0057.0112N/mmof IandCol2, respectively0were.08250N/mm.0112. Furthermore,and2 respectively,0.0825 N/mmthewhilegel2, respectively,compressionthose of L-whileECMtest showedtwerese0of.0008thatL-ECMandthewereL0-.ECM0057.0008N/mmgel withand2, respe0a.0057concentrationtivelyN/mm. Furthermore,2 respectivelyof 10 mg/mLthe. Furthelicitgel compressionermore,d an inferiorthe testgelmechanicalcompressionshowed thatstrengththetestLshowed-ECMresponsegelthatwithcomparedthe Lconcentration-ECMto 3gelmg/mLwithof 10aI Colconcentrationmg/mL. elicitedof 10anmg/mLinferiorelicitedmechanicalinferiorstrengthmechanicalresponsestrengthcomparedresponseto 3 mg/mLcomparedI Col.to 3 mg/mL
I Col.
Figure 10. Average stress-strain responses (n = 3) of (A) L-ECM gel, and (B) I Col gel.
Figure 10. Average stress-strain responses (n = 3) of (A) L-ECM gel, and (B) I Col gel.
Figure 10. Average stress-strain responses (n = 3) of (A) L-ECM gel, and (B) I Col gel.