

Gels 2018, 4, 39 |
2 of 15 |
transplantation. The recellularization of the decellularized tissue should be optimized in order to fabricate a functional reconstructed liver. Previous reports suggested that recellularized liver inoculated with hepatocytes expresses liver-specific functions such as albumin and urea synthesis [5,6]. Also, site-specific cell inoculation has been successfully performed [7]. However, the hepatocytes density of recellularized liver evaluated from the inoculum cell number was 106–107 cell/mL. These values are significantly below the level of 1–2 108 cells/mL, which is considered to be the cell density in a healthy liver. In this regard, the formation of new liver tissue accompanied by cell growth within the organ template is essential. Also, recellularized liver transplantation experiments have not been successful for even a few days of cell engraftment [3,8]. Furthermore, in in vivo, cells are embedded in the ECM. Therefore, when the decellularized tissue is used as a scaffold material, it is difficult to reproduce a similar in vivo environment to that which existed before decellularization, where individual cells will be embedded in a similar manner within the ECM. In order to overcome the above problems, liver-specific ECM gel construction is indispensable as a suitable environment in the formation of functional liver tissue accompanied by angiogenesis [9,10]. Meanwhile, functional liver tissue formation accompanied with angiogenesis and hepatocyte proliferation has been reported in vivo by implanting cells with ECM model gel [7,10].
Recently, the maintenance and promotion of the liver phenotype [11–14] was reported to be effective when decellularized liver was solubilized (L-ECM) in the effort to construct a new culture substrate and generate a 3D injectable hydrogel platform for liver tissue engineering [15]. In addition, it is reported that the composition and structure of extracellular matrix (ECM) constituting each organization differs in accordance with the organ type [16,17]. Likewise, it is suggested that organ-specific ECM constitutes an optimal microenvironment around cells. Thus, the solubilized liver-specific ECM (L-ECM) is an effective substrate for different applications, from basic use in drug screening with hepatocyte culture to constructive application in liver regenerative medicine.
The behavior of cells is influenced by the components and structure of the scaffold, and by the material’s physical properties. For example, when hepatocytes were embedded using alginate gel with different elastic moduli (1 kPa, 12 kPa), increased albumin synthesis activity was elicited in conditions where the elastic modulus was 1 kPa. In addition, it was reported in the same study that increased albumin synthesis activity was elicited in conditions where the softest PEG-heparin material was used [18]. In other words, material properties are considered to be factors that affect cell behavior. However, cell adhesion, morphology, tissue formation ability, and functional expression are determined by the overall influence of the composition, surface characteristics, and mechanical properties of the substrate. Though there is a report on the mechanical properties of rat L-ECM [15], it is essential to consider the L-ECM of other animals (e.g., porcine) clinically and to examine their physical properties in detail.
For these reasons, it is important to quantify the physical properties of L-ECM. However, detailed investigations on them have not been reported. Therefore, in this study, L-ECM obtained by the solubilization of decellularized porcine liver, as well as L-ECM gel obtained by the spontaneous association of L-ECM, were prepared and their physical properties were evaluated.
2. Results and Discussion
2.1. Decellularization of Porcine Liver Tissue and Preparation of L-ECM
The immunohistological evaluation of porcine liver slices decellularized by Triton X-100 treatment was performed. In the histological evaluation of the liver after decellularization, the absence of the cellular cytoplasms and nuclei of cellular components was confirmed (Figure 1). Furthermore, since 92.4% of the DNA in the porcine tissue was removed in this treatment, it was confirmed that the decellularization of porcine liver slices by 1% Triton X-100 treatment was successful. Using immunohistological evaluations of this decellularized liver slice, collagen types I, III, IV, and V, and laminin originally contained in the native liver were detected (Figure 2). Despite the qualitative
Gels 2018, 4, 39 |
3 of 15 |
nature of fluorescence imaging, distinct red fluorescence was observed by staining using type I collagen
antibodies. In addition, white powder was obtained by the lyophilization of this decellularized liver
Gels 2018, 4, 39 3 of 15
tissueGels. These2018, 4series, 39 of processes lasted approximately 15 days and led to the harvesting of 18.03 of 015.2 mg
decellularized liver tissue. These series of processes lasted approximately 15 days and led to the |
|||||
of decellularizedGels 2018, 4, 39 porcine liver dry powder per 1 g (wet weight) of porcine liver tissue. Furthermore,3 of 15 |
|||||
harvestingdecellularizedof 18liver.0± 0tissue.2mg.ofThesed c llularizedseriesof proorcessesineliverlasteddryapproximatelypowderper 1 g15(wetdaysweight)and ofledporcineto th |
|||||
by treating this powder with pepsin, L-ECM was obtained as liver-specific solubilized ECM (Figure 3). |
|||||
liverharvestingtissue.ofFurth18.0 ±more,0.2 mgbyoftrdecellularating th zedspowderporcinewithliverpepsin,dry powderL-ECMperwas1gobtained(wet weight)as liverof-speporcific |
|||||
decellularized liver tissue. These series |
of processes lasted approximately 15 days and led to thne |
||||
This L-ECM contained approximately 0.15 |
g/mg of glycosaminoglycan (GAG), which was equivalent |
||||
solubilizedlivertissue.ECMFurthermore,(Figu 3)by. Thistr atingL-ECMthiscontainedpowder withapproximatelypepsin, L-ECM0.15was obtainedof glycosaminoglycanas liver-spe fic |
|||||
harvesting of 18.0 ± 0.2 mg of decellularized porcineliver dry powder perμg/mg1 (wet weight) of porcine |
|||||
to the concentration yield of our previous study [11]. These results indicate that the acquisition of |
|||||
(GAG),solubilizedwhichECMwas(Figuequivalent3). ThistoLthe-ECMconcentrationcontained approximatelyyield of our previous0.15 μg/mgstudyof glycosaminoglycan[11]. These results |
|||||
liver tissue. Furthermore, by treating this powder with pepsin, L-ECM was obtained as liver-specific |
|||||
L-ECM as |
solubilized substrate had a liver-specific matrix composition since all of the cellular |
||||
indicate(GAG), |
wthichatthewasacquivalesitiont ofto theL-ECMconcentras |
tionsolubilizedyield of substrateprevioushadstudya liver[11]-specific.These resultsmatrix |
|||
solubilized ECM (Figure 3). This L-ECM contained approximately |
0.15 μg/mg of glycosaminoglycan |
||||
componen |
were removed. |
|
|
weresolubilizedrem veds . |
had a liver-specific matrix |
compositionindicate atsincethe allacofisitionthecellularof Lcomponents-ECM as |
|||||
(GAG), |
which was equivalent to the concentration yield of oubstrateprevious study [11]. These results |
||||
indicatecompositionthatsincethe allacquisitionof the cellularof L-componentsECM as a weresolubilizedremovedsubstrate. had a liver-specific matrix composition since all of the cellular components were removed.
Figure |
A) |
and |
Figure 1. |
liver (A) and |
|
decellularizedFigure |
A) |
and |
decellularized liver (B) (scale bars = 100 m). |
|
|
decellularized liver (B) (scale bars = 100 μ |
). |
|
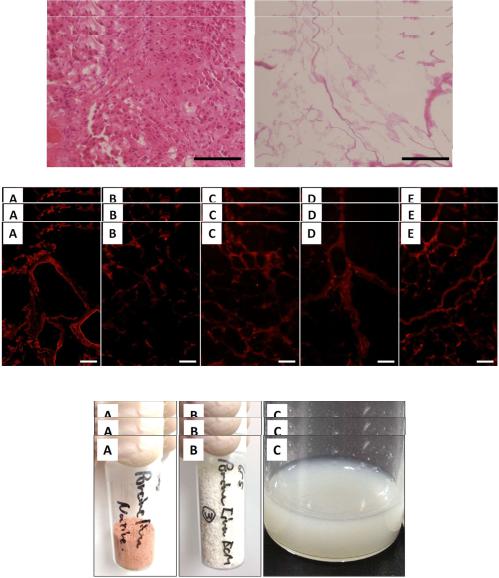
Figure 1. Histological observation (Hematoxylin and eosin staining) of native liver (A) and decellularized liver (B) (scale bars = 100 μm).
Figure 2. Immunolabeling of collagen types (A) I, (B) III, (C) IV, (D) V, and laminin (E),
(scaledecellularizedbarsImmunolabeling= 50saμ ples). with Triton solution. All images are displayed at a magnification of 20 times Figure 2. of collagen types (A) I, (B) III, (C) IV, (D) V, and laminin (E), in
in decellularized samples with Triton solution. All images are displayed at a magnification of 20 times decellularized(scale bars = 50samplesμ ). with Triton solution. All images are displayed at a magnification of 20 times
(scale bars = 50 m).
(scale bars = 50 μm).
Figure 3. (A) |
and (C) L-ECM. |
EachFigurepowder3. (A) ty e |
and. (C) L-ECM. |
Each powder type was obtained by the lyophilization of the corresponding liver tissue.
Figure 3. (A) Appearance of natural liver powder, (B) decellularized liver powder, and (C) L-ECM.
Figure2.2. Characterization3. (A) Appearanceof L-ECMof natural liver powder, (B) decellularized liver powder, and (C) L-ECM.
Each powder type was obtained by the lyophilization of the corresponding liver tissue.
Each2.2. Characterizationpowder type wasof Lobtained-ECM by the lyophilization of the corresponding liver tissue.
SDS-PAGE results and the signal ratios for each molecular weight band of all studied solutions
2.2. Characterization of L-ECM
2.2. CharacterizationareshownSDS-PAGEinFigureofresultsL4-ECM.Molecularand the signalweightratiosbandsforwereeachobservedmolecularatweightMW=116bandandof227allkDastudiedat allsolstutionsdied
conditionsareshownSDS-PAGEin(FiguFigureresults4A).Molecular.anAdditionally,the signalweightratiosinbandseachforsolutiwereeachomolecularbservedn,differencesatweightMWin=116thebandandrelativeof227kDaall studieddensia iesallstudiedsolutionsof each SDSmolecularconditions-PAGEwei(Figureresultsht band4A)andMolecular. wereAdditithe signalonfirmedally,ratiosin. Therefeachforseacholutire,observedasmolecularn,showndifferencesin weightFigurein the4B,bandrelativetheofproportalldensstudieditieons of solutionseach areshownin . weight bandswere atMW=116and227kDaat allstudied
are shownconditionsmolecularin Figureweight(Figure4.bandMolecular4A). forwereAdditiallcstudiedweonfally,ghtrmedinbandsmolecules.eachTherefore,weresolution,wereobservedas shownquantifdifferencesatednMWFigurebyinimage=the4B,116relativeanalysestheandproport227densitiesukDangonsatImageofalleacstudiedJh. conditionsmolIn theculacid(Figurer we-solubilizedght4A)band. Additionally,pfwerecineallconfirmedstudiedtypeIincollmolecules. Therefore,agchnsolution,(I Col)wereas(NittashownquantifdifferencesGelatin,edFigurebyOsimina4B,theka,getheanalysesJapan),r lativeproporttheusdensitiesiγonsngandImagoftheeachofβJ.each molecularmolecularIn theweightacidweight-solubilizedbandbandwerepforcineconfirmedall studiedtype I collagenmolecules. Therefore,(I Col)wereas(NittaquantifiedshownGelatin,byFigureOsimaka,ge4B,analysesJapan),the proportionstheusingγ andImagetheofJβ.each
In the acid-solubilized porcine type I collagen (I Col) (Nitta Gelatin, Osaka, Japan), the γ and the β

Gels 2018, 4, 39 |
4 of 15 |
molecular weight band for all studied molecules were quantified by image analyses using Image J. In the acid-solubilized porcine type I collagen (I Col) (Nitta Gelatin, Osaka, Japan), the and the chainsGelswere2018,the4, 39most prominent, while the proportion of the chains was relatively small. Conversely,4 of 15
in pepsin-solubilized porcine type I collagen (PI Col) (Nitta Gelatin), the proportion of the chains
chains were the most prominent, while the proportion of the α chains was relatively small. was large and the ratio of the and chains was small. Additionally, the same trend was observed for
Conversely, in pepsin-solubilized porcine type I collagen (PI Col) (Nitta Gelatin), the proportion of
L-ECM as that for the PI Col. In other words, it can be said that the L-ECM obtained in this study is a the α chains was large and the ratio of the γ and β chains was small. Additionally, the same trend
pepsin-solubilized liver-specific matrix substrate.
was observed for L-ECM as that for the PI Col. Inother words, it can besaid that the L-ECM obtained
In the solubilization of collagen by pepsin, telopeptide is cleaved by hydrolysis [19]. Therefore, in this study is a pepsin-solubilized liver-specific matrix substrate.
the chains,In thewhichsolubilizationa trimerof collagenof thebycollagenpepsin, telopeptidechain andisthecleaveddimerizedby hydrolysischains,[19].areTherefore,present in increasthedγquchains,ntitieswhichin theis acidtrimer-solubilizedof the collagenchain. In contrast,and the dimerizedthe chain,β chains,whichareis apresentsingle instrand, existsincreasedpepsinquantities-solubilinzedthecollagenacid-solubilizedin increasedcollagenquantities. In contrast,. Sincethe α chain,L-ECMwhichwasispepsina single-solubilized,strand,
the proportionexistsinpepsinof -thesolubilizedchainscollagenwas theinincreasedmost prominentquantities..SinceTherefore,L-ECMwasit waspepsinexpected-solubilized,thatthepepsin
proportion of the α chains was the most prominent. Therefore, it was expected that pepsin removed removed telopeptides from the L-ECM. In type I collagen, the triple helix-forming site is composed
telopeptides from the L-ECM. In type I collagen, the triple helix-forming site is composed of glycine–
of glycine–X–Y (X and Y represent other amino acids; proline and hydroxyproline are used in many
X–Y (X and Y represent other amino acids; proline and hydroxyproline are used in many cases). cases). Conversely, since the telopeptide does not contain this type of repeating sequence and is a
Conversely, since the telopeptide does not contain this type of repeating sequence and is a species- species-specific sequence for the animal that is being studied, it becomes the main antigenic site of specific sequence for the animal that is being studied, it becomes the main antigenic site of collagen
collagen [19]. Therefore, the removal of telopeptides leads to the suppression of immune reactions
[19]. Therefore, the removal of telopeptides leads to the suppression of immune reactions so that
so thatpepsinpepsin-treated- reatedL-ECML-ECMis expectedis xpectedto becometo becomea biocompatiblebiocompatiblematerialterialfor realizingfor realizingtissuetissue engineeringengineeringtechnologies. .
FigureFigure4. I 4(.AI) (SDSA) SDS-PAGE-PAGEofofeacheachsample. . (1) Solubilizationwithwithacidacid(I Col),(I Col),(2) (2)pepsinpepsin-acid-acid
solubilizationsolubilization(PI Col),(PI Col),andand(3)(3)L-ECML-ECM. The. Theconcentrationofofeacheachsolutionsolutionwaswas0.750.75mg/mLmg/mL. (B).Ratios(B) Ratios
of detected bands in the all components (n = 3, bars represent standard deviation.). of detected bands in the all components (n = 3, bars represent standard deviation).
2.3. Rheological |
of L-ECM Based on |
|
2.3. Rheological Propertiertiesof L-ECM Based on Dynamic ViscoelasticEvaluation |
|
|
All of the rheological measurements were performed in wet conditions. |
|
|
All of the rheological measurements were performed in wet conditions. |
|
|
2.3.1. Strain Dispersion Test |
|
|
2.3.1. Strain Dispersion Test |
|
|
In the strain dispersion test (Figures 5A,B), PI Col yields a constant value within the strain range |
|
|
In the strain dispersion test (Figure 5A,B), PI Col yields a constant value within the strain range of |
||
of 0.1–20%. When the strain amount exceeds 10–20%, G′ suddenly drops, and the relative value of G′′ |
is |
|
0.1–20%. When the strain amount exceeds 10–20%, G0 suddenly drops, and the relative value of G00 |
||
is increased.It can be judged that the viscous behavior became more prominent. At the concentration |
|
|
increased. It can be judged that the viscous behavior became more prominent. At the concentration of 2 mg/mL or higher, the strain amount at G′ = G′′ (intersection of G′ and G”) shifted to a higher
of 2 mg/mL or higher, the strain amount at G0 = G00 (intersection of G0 and G”) shifted to a higher distortion side as the concentration increased. This ind cates that the elastic behavior becomes more
distortionprominentside as theconcentrationincreasesincreased. At.1Thismg/mL,indicatesno intersectionthat thepointelasticbetweenbehaviorG′ andbecomesG′′ wasmore prominentobservedas thein theconcentrationmeasured strainincreasesrange. Therefore,At 1 mg/mL,the materialno intersectionwas consideredpoint betweento in aGrelatively0 and G00 was observedviscousin statethe measured. strain range. Therefore, the material was considered to be in a relatively
viscous state.
Gels 2018, 4, 39 |
5 of 15 |
Gels 2018, 4, 39 |
5 of 15 |
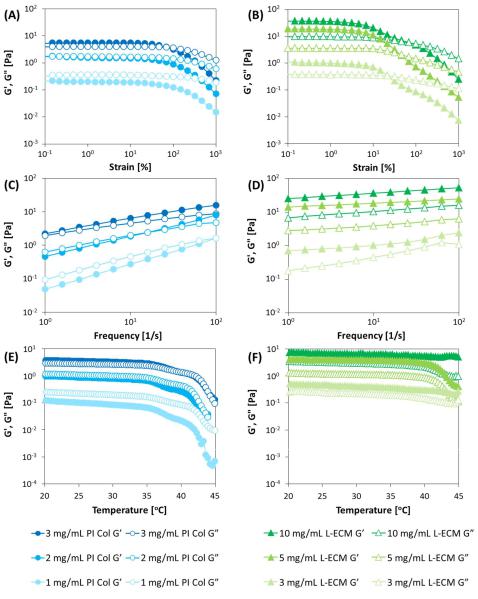
FigureFigure5. (A5,C. (,AE,)CVariations,E) Variationsin Gin0G′andandGG′′00 atatdiffferent concentrationsofofPIPIColCol(3,(3,2, and2, and1 mg/1 mg/mL), (B,D,F(B),DL-,ECMF)L-ECMconcentrationsconcentrations(10,(10,5,5,and33mg/mL)mg/mL).Corresponding. CorrespondingvariationsvariationsofG′andofG′′0withand(AG,B00)with
dynamic strain sweep (DSS) mode, (C,D) dynamic frequency sweep (DFS) mode, and (E,F) dynamic
(A,B) dynamic strain sweep (DSS) mode, (C,D) dynamic frequency sweep (DFS) mode, and (E,F)
temperature ramp (DTR) mode measured by a rheometer (conditions for DSS: frequency 1 Hz, dynamic temperature ramp (DTR) mode measured by a rheometer (conditions for DSS: frequency 1 Hz, temperature 10 °C; conditions for DFS: strain 5%, temperature 10 °C; and conditions for DTR: temperature 10 C; conditions for DFS: strain 5%, temperature 10 C; and conditions for DTR: frequency frequency 1 Hz,andstrain 5%). Allsamples were dissolvedinan aqueoussolution adjusted with HCl
1 Hz, and strain 5%). All samples were dissolved in an aqueous solution adjusted with HCl at pH = 3.0. at pH = 3.0.
However, L-ECM yielded a constant value in the strain range of 0.1 to 10% and exhibited a linear
However,L-ECMyieldedaconstant valueinthestrainrange of 0.1to 10%andexhibitedalinear behaviorbehaviorin narrowerin a narrowerrangerangecomparedcomparedtotoPIPIColCol..In regardtotothethestrainstraindispersion,dispersion,thethereductionreductionof of
G0 and G00 owing to the increasein the strainis considered to benonlinear in terms of themateriaterial’s
G′ and G′′ owing to the in the is to be in terms of the physicalphysicalpropertiertiessimplysimplyowingtotoits complicatedinternalinternalstructurestructure. From. FromFiguresFigure5A,B, it5A,B,can beit can be observedthat thestrainsexhibitexhibitnonlinearitynonlinearity(distortion(distortionvaluesatvalueswhichatG′ andwhichG′′ beginG0 andto decrease)G00 begin to
decrease)decreaseddecreasedwhen thewhencontentthe wascontentlow. Inwasthislowinstance,. In thistheinstance,internal structurethe internalremarkablystructurechangedremarkablythe
rheological behavior. Inother words,itisconsidered that the material that exhibitsamore prominent changed the rheological behavior. In other words, it is considered that the material that exhibits a
more prominent nonlinearity has G0 > G00, and the difference between them is larger. As the content increases, both G0 and G00 increase, but the difference between them decreases. It is thought that this is due to an increase in the number of molecules, rendering the material difficult to deform owing to the