

Биоинженерия / Биомеханика_микрофлюидные_устройства / статьи / b823180j
.pdfPublished on 03 April 2009. Downloaded on 11/18/2019 10:55:52 AM.
View Article Online / Journal Homepage / Table of Contents for this issue
PAPER |
www.rsc.org/loc | Lab on a Chip |
|
|
A novel multishear microdevice for studying cell mechanics
Lien Chau, Michael Doran and Justin Cooper-White*
Received 7th January 2009, Accepted 27th March 2009
First published as an Advance Article on the web 3rd April 2009
DOI: 10.1039/b823180j
Shear stresses are known to influence the morphology, and even the fate, of many cell types, including endothelial, smooth muscle, and osteoblast cells. This paper describes a novel shear device for the study of cell mechanics. Unlike all other published shear devices, such as parallel-plate flow chambers, where a single shear stress is evaluated for a single input flow rate, the described device enables the simultaneous evaluation of 10 different shear stresses ranging over two orders of magnitude (0.7–130 dynes cm 2, 0.07–13 Pa). Human umblical vein endothelial cells (HUVECs) were exposed to the shear stress profiles provided by the device over a 20 h perfusion period, and the secretion level of von Willebrand factor (vWF) was investigated. Confirming previous studies, increasing shear resulted in increased vWF secretion. Furthermore, changes in cell morphology, including cell and nuclear size (area) and perimeter with shear, were analysed. HUVECs under shear stresses ranging from 1–3 dynes cm 2 (0.1–0.3 Pa) showed similar vWF content, cell and nuclear size and perimeter to static cultures, while cells under shear stresses above 5 dynes cm 2 (0.5 Pa) showed significantly higher vWF secretion and were at least 30% smaller in cell size. We also note that cells exposed to perfusion rates resulting in a shear stress of 0.7 dynes cm 2 (0.07 Pa) showed significantly lower levels of vWF and were 35% smaller in size than those under static conditions. Overall, the results confirm the significant utility of this device to rapidly screen cellular responses to simultaneously imposed physiologically relevant ranges of shear stress.
Introduction
The inner surface of arteries and veins is lined with a continuous layer of endothelial cells. As blood flows across this surface, shear stresses are generated and can be sensed directly by the endothelial cells.1 Shear stress is known to regulate a number of endothelial cell functions. In particular, cell shape and orientation, and cytoskeleton protein production, secretion and organisation, are significantly influenced or modulated by flow.
A number of studies have looked at shear devices to investigate the effects of shear stress on endothelial cells.2–4 In a study conducted by Davies and colleagues,2 a shear device having a geometry similar to a cone-plate viscometer was utilised. The fluid shear stress was produced by the rotation of a shallow cone with respect to a stationary base plate. The combination of viscosity, cone angle, and rotational speed in the study produced shear stresses in the range of 1–15 dynes cm 2 (0.1–1.5 Pa). Cone- and-plate apparatus have also been used to study cells at constant shear stresses up to 50 dynes cm 2 (5 Pa).5,6 Another shear device is the parallel-plate flow chamber, which have been used by numerous groups to study endothelial cells at shear stresses of 8 dynes cm 2 (0.8 Pa),7 15.2 dynes cm 2 (1.52 Pa),8 and 10 and 25 dynes cm 2 (1 and 2.5 Pa).9 However, like the cone- and-plate apparatus, only one shear stress can be presented to cells in a parallel-plate flow chamber in each experiment, which is dependent upon the flow rate and the gap between two plates. Studying the effect of an entire physiologically relevant range of
Australian Institute for Bioengineering and Nanotechnology, The University of Queensland, St. Lucia, 4072, Australia. E-mail: j.cooperwhite@uq.edu.au; Fax: +61 7 3346 3973; Tel: +61 7 3346 3858
shear stresses on cells is thus costly in terms of time and resources.
Usami and colleagues designed a device that is able to generate a linear variant shear stress profile within the same flow field at a constant flow rate by introducing a tapered parallel-plate channel to the flow chamber device concept.4 The study investigated platelet adhesion versus shear stress with shear stress ranging from 0–43 dynes cm 2 (0–4.3 Pa). However, it was difficult to pinpoint shear effects with the device as the cells spread without a clear boundary between varying shear stress values.
Very recently, in line with our work, Gutierrez and colleagues recognised the need for a microfluidic multishear device to minimise sample volume.10 They devised a microfluidic device that had an array of 8 parallel channels covering a shear stress range from 0.5 to 50 dynes cm 2 (0.05–5 Pa). All flow chambers had a depth h ¼ 24 mm and a width w ¼ 200 mm. Gaver and Kute have shown that when the cell aspect ratio (CAR, g ¼ R/H, where R is the cell size and H is the channel height, dictating the size of the gap width between the channel wall and top of the cell) is greater than 0.25, cells will cause significant flow disruption and thus the stress, force, and torque can be significantly greater than predicted based on flow in a cell-free system.11 According to this criteria, for CAR < 0.25, the device from Gutierrez and colleagues can only be utilised for very small cells (<6 mm in height, which is lower than the mean height of a human umbilical vein endothelial cell (HUVEC) monolayer (7 mm),12 and that of many other cell types).13,14
We have developed a multishear microdevice that is simpler in design, yet enables four times greater cell sizes and spans twice the shear stress range achieved with all other shear devices. Our microdevice comprises of 10 channels, all with h ¼ 100 mm and
This journal is ª The Royal Society of Chemistry 2009 |
Lab Chip, 2009, 9, 1897–1902 | 1897 |
Published on 03 April 2009. Downloaded on 11/18/2019 10:55:52 AM.
View Article Online
w ¼ 200 mm to |
study cells up to 24 |
m |
m in height (e.g. oviductal |
|
|
|
|
|
|
|
|
|
|
||||||||
15 |
|
|
|
|
|
|
|
|
|
|
|
|
|
|
|
|
|||||
epithelial cells). |
|
In addition, our device spans a shear stress |
|
|
|
|
|
|
|
|
|
|
|||||||||
range of 0.7–130 dynes cm 2 (0.07–13 Pa), which also covers the |
|
|
|
|
|
|
|
|
|
|
|||||||||||
physiological shear stresses (1–70 dynes cm 2, 0.1–7 Pa)16,17 in |
|
|
|
|
|
|
|
|
|
|
|||||||||||
resting conditions. It exceeds this range to accommodate for |
|
|
|
|
|
|
|
|
|
|
|||||||||||
increased wall shear stress during exercise17 and high shear |
|
|
|
|
|
|
|
|
|
|
|||||||||||
pathologic states, e.g. thrombosis (70 to >100 dynes cm 2, 7 to |
|
|
|
|
|
|
|
|
|
|
|||||||||||
>10 Pa).16 |
|
|
|
|
|
|
|
|
|
|
|
|
|
|
|
|
|
|
|||
This paper outlines the design and development of our novel |
|
|
|
|
|
|
|
|
|
|
|||||||||||
and simple multishear microdevice that can be used as a tool to |
|
|
|
|
|
|
|
|
|
|
|||||||||||
simultaneously investigate the effect of a wide range of shear |
|
|
|
|
|
|
|
|
|
|
|||||||||||
stresses on cell behaviour. The utility of this device was validated |
|
|
|
|
|
|
|
|
|
|
|||||||||||
by studying the effect of shear stress on the von Willebrand |
|
|
|
|
|
|
|
|
|
|
|||||||||||
factor (vWF, a large multimeric glycoprotein involved in platelet |
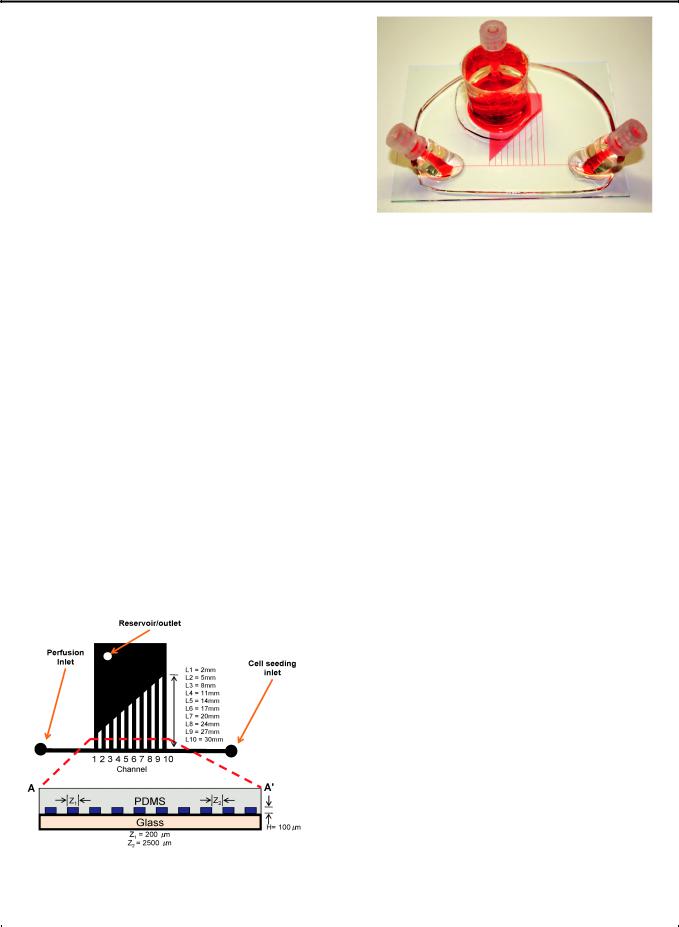
Fig. 2 The microfluidic device with ten parallel channels. |
||||||||||||||||||||
adhesion and aggregation) production of HUVECs over a range |
|||||||||||||||||||||
|
|
|
|
|
|
|
|
|
|
||||||||||||
of 0.7–130 dynes cm 2 (0.07–13 Pa). |
|
|
|
|
|
|
|
|
|
|
|
|
|
||||||||
|
|
|
|
|
|
|
|
|
|
|
(where m is the viscosity, and L is the length of the channel). As |
||||||||||
Experimental |
|
|
|
|
|
|
|
all channels were designed to possess identical width and height, |
|||||||||||||
|
|
|
|
|
|
|
the relationship between flow rate and resistance between two |
||||||||||||||
|
|
|
|
|
|
|
|
|
|
|
|||||||||||
Design and fabrication |
|
|
|
|
|
channels was simplified to LAQA ¼ LBQB. Based on this equality, |
|||||||||||||||
The device has one inlet, one outlet and ten channels (Fig. 1). The |
and the condition that the sum of flow rates in the individual |
||||||||||||||||||||
channels equal the main inlet flow rate into the device, the |
|||||||||||||||||||||
flow rate within a microchannel is given by Q ¼ DP/R, where Q is |
|||||||||||||||||||||
channel lengths were calculated to create a two order of magni- |
|||||||||||||||||||||
the flow rate, DP is the pressure drop across the channel, and R is |
tude difference in flow rates between channel 1 and channel 10, |
||||||||||||||||||||
the channel resistance. With a common reservoir outlet (Fig. 1 |
|||||||||||||||||||||
which in turn gave two orders of magnitude difference in shear |
|||||||||||||||||||||
and Fig. 2), the pressure drop of each channel was designed to be |
|||||||||||||||||||||
stress, according to tw ¼ 6Qm/(wh2), where tw is the shear stress, |
|||||||||||||||||||||
equal (i.e. DPA ¼ DPB, where DPA and DPB are the pressure |
and m is the viscosity of the media (0.001 N s m 2). The Reynolds |
||||||||||||||||||||
drops in channel A and channel B, respectively. Similarly, QARA |
number (Re ¼ nDhr/m, where v is the velocity, Dh is the hydraulic |
||||||||||||||||||||
¼ QBRB, where QA and RA are the flow rate and resistance in |
|||||||||||||||||||||
diameter (Dh |
|
2wh/(w + h)), and r is the density of the media |
|||||||||||||||||||
channel A, and QB and RB are the flow rate and resistance in |
|
3 ¼ |
|
|
|
|
|
|
|
||||||||||||
channel B). The resistance of a rectangular microchannel with an |
(998.2 kg m |
|
)), and the entrance length (le ¼ (0.5 + 0.065Re)Dh) |
||||||||||||||||||
aspect ratio of 2 (i.e. w z h, where w is the width and h is the |
were also calculated |
to ensure |
laminar |
flow and established |
|||||||||||||||||
Poiseuille flow profiles in the channels. |
|
|
|||||||||||||||||||
height) can be found by: |
|
|
|
|
|
||||||||||||||||
|
|
|
To validate the device design, fluid flow profiles in the device |
||||||||||||||||||
|
|
|
|
|
|
|
|
|
|
|
|||||||||||
R |
¼ |
(12 mL/wh3)[1 |
|
(h/w)((192/p5)PN |
(1/n5)tanh(npw/ |
were obtained using micro particle image velocimetry (mPIV). |
|||||||||||||||
|
|
|
|
2h))] 1 |
|
n¼1,3,5 |
|
For these measurements, the fluid was seeded with red fluores- |
|||||||||||||
|
|
|
|
|
|
|
|
|
|
cent particles of mean diameter 0.49 mm. A TSI PIVCAM 13 - 8 |
|||||||||||
|
|
|
|
|
|
|
|
|
|
|
|||||||||||
|
|
|
|
|
|
|
|
|
|
|
CCD (1280 1024 pixel resolution) camera synchronised with |
||||||||||
|
|
|
|
|
|
|
|
|
|
|
a dual-head Nd:YAG pulse laser was used to obtain sequential |
||||||||||
|
|
|
|
|
|
|
|
|
|
|
images. The time delay between two images was 40 ms. A total of |
||||||||||
|
|
|
|
|
|
|
|
|
|
|
25 instantaneous velocity vector fields were extracted from the |
||||||||||
|
|
|
|
|
|
|
|
|
|
|
particle images and ensemble-averaged to calculate the mean |
||||||||||
|
|
|
|
|
|
|
|
|
|
|
local velocity. A 32 32 (pixel) interrogation window with |
||||||||||
|
|
|
|
|
|
|
|
|
|
|
50–75% overlapping was used, corresponding to a spatial reso- |
||||||||||
|
|
|
|
|
|
|
|
|
|
|
lution of 400 mm2. Velocity fields were then obtained using |
||||||||||
|
|
|
|
|
|
|
|
|
|
|
Matlab, and wall and fluid shear stresses were derived from plots |
||||||||||
|
|
|
|
|
|
|
|
|
|
|
of2 velocity versus |
displacement (i.e. t |
¼ |
dv |
z/dx ¼ 2vmaxx/((w/ |
||||||
|
|
|
|
|
|
|
|
|
|
|
|
2 |
2 |
|
|||||||
|
|
|
|
|
|
|
|
|
|
|
2) ) since vz ¼ vmax[1 (x /((w/2) ))]). |
|
|
|
|||||||
|
|
|
|
|
|
|
|
|
|
|
The device was fabricated using conventional microfabrication |
||||||||||
|
|
|
|
|
|
|
|
|
|
|
techniques involving SU-8 photolithography and poly- |
||||||||||
|
|
|
|
|
|
|
|
|
|
|
dimethylsiloxane (PDMS) soft lithography. Briefly, the designs |
||||||||||
|
|
|
|
|
|
|
|
|
|
|
were generated using AutoCAD 2007 (Autodesk) and printed on |
||||||||||
|
|
|
|
|
|
|
|
|
|
|
transparencies with 4000 dpi resolution (Graphic Skills, Bris- |
||||||||||
|
|
|
|
|
|
|
|
|
|
|
bane, Australia). The transparencies were used as masks in |
||||||||||
|
|
|
|
|
|
|
|
|
|
|
contact photolithography and a 365 nm light source (OAI, San |
||||||||||
Fig. 1 Schematic of the multishear device containing ten channels with |
Jose, CA, USA) was used to yield masters composed of a positive |
||||||||||||||||||||
relief of SU-8 photoresist on a silicon wafer. |
|||||||||||||||||||||
varying lengths (H ¼ height; Z1 ¼ channel width; Z2 ¼ channel spacing; |
|||||||||||||||||||||
The pattern created on the silicon wafers was replicated in |
|||||||||||||||||||||
L1, 2, 3, 4, 5, 6, 7, 8, 9, 10 |
¼ |
length of channels). AA0 |
is the cross-sectional |
||||||||||||||||||
view of this device. |
|
|
|
|
|
|
poly-dimethylsiloxane (i.e. silicone elastomer). The silicone |
||||||||||||||
|
|
|
|
|
|
|
|||||||||||||||
|
|
|
|
|
|
|
|||||||||||||||
1898 |
| Lab Chip, 2009, 9, 1897–1902 |
|
|
|
|
This journal is ª The Royal Society of Chemistry 2009 |
|||||||||||||||

Published on 03 April 2009. Downloaded on 11/18/2019 10:55:52 AM.
View Article Online
elastomer (Sylgard 184, Dow Corning, Midland, MI, USA) was |
average of three separate experiments. Student t-test was |
|
mixed 10 : 1 (w/w) with a silicone elastomer curing agent. The |
peformed and the results are represented as mean SE. |
|
mixture was poured over the patterned wafer to completely cover |
|
|
the pattern and placed in the oven for 40 min at 60 C to cure. |
Immunofluorescence labeling |
|
The PDMS replica of the network design was cut out and finally |
||
|
||
bonded to a clean glass slide using an air plasma to produce |
After exposure to shear, the cells in the shear devices were rinsed |
|
a sealed microfludic network. In addition, a special mould |
with PBS. They were then fixed with 4% paraformaldehye in PBS |
|
featuring an inverted cone, to allow easy removal of air bubbles |
solution for 10 min and permeabilised with 1% Triton-X100 in |
|
in the device, was made for the reservoir outlet. The PDMS |
PBS for 10 min. The device was incubated with normal goat |
|
replica of the reservoir was bonded to the rest of the device after |
serum for 30 min to prevent nonspecific binding. The von Wil- |
|
being treated with air plasma (Fig. 2). |
lebrand factor of the cells was labelled with indirect immuno- |
|
|
fluorescence staining. Firstly, polyclonal rabbit anti-human vWF |
|
Cells |
antibody (DakoCytomation, Denmark) at a 1 : 400 dilution was |
|
used to incubate the cells for 45 min, at room temperature |
||
|
||
HUVECs were harvested from human umbilical cord veins. |
( 20 C). Alexa Fluor 633 (lem ¼ 515 nm) conjugated goat anti- |
|
Briefly, the cells were isolated by perfusing the veins with a digest |
rabbit IgG (Molecule Probes, USA) was used to label the cells as |
|
solution (0.2% w/v Collagenase Type 2 (Worthington) in Hank’s |
the second antibody at a dilution of 1 : 250 for 30 min, at room |
|
balanced salts solution (Sigma)) for 10 min at 37 C. The |
temperature. Cells were thereafter rinsed with PBS. Phalloidine- |
|
harvested cells were grown in medium RPMI 1640 (Gibco) with |
rhodamine (2 U mL 1, lem ¼ 565 nm) was used to label the |
|
10% fetal bovine serum (Gibco), 100 mg mL 1 endothelial cell |
F-actin microfilaments of the cytoskeleton of the HUVECs at |
|
growth supplement (ECGS, BD BioSciences), 50 mg mL 1 |
a dilution of 1 : 50 for 30 min. DNA staining was carried out |
|
heparin (Sigma), and 100 mg mL 1 penicillin/streptomycin. Only |
using Hoescht (33342, Invitrogen) for 10 min. |
|
cells from passages 4 to 8 were used in our experiments. Cell |
Images were acquired with a Qimaging CCD camera (Retiga |
|
culture was conducted in a humidified 5% CO2 and 95% air |
Exi FAST 1394) connected to an Olympus BX61 inverted |
|
incubator at 37 C. |
microscope. The fluorescent images obtained from the Qimaging |
|
|
CCD camera were analysed with Invivo and Image-Pro Plus 6.1 |
|
Shear experiment |
software to obtain mean fluorescence intensity (MFI) values. |
|
Image J software was used to obtain cell and nuclear sizes (the |
||
|
||
After bonding, the devices were sterilised by autoclaving and |
area covered per cell and nucleus), perimeters (the length of |
|
allowed to cool down overnight in a laminar flow hood. The |
outline around a cell and nucleus), and circularities (a measure of |
|
channels of the device were then coated with fibronectin (human |
elongation, where a circularity value of 1.0 indicates a perfect |
|
plasma, Sigma) via injection of a solution of 100 mg mL 1 |
circle, and decreasing values indicate increasing elongation). |
|
fibronectin in PBS into the device and incubated for 1 h at room |
|
|
temperature. The channels were then washed with PBS to remove |
Results and discussion |
|
unattached fibronectin. A cell suspension of 1 106 cells mL 1 |
||
|
||
was injected into the fibronectin coated channels and incubated |
Measured and calculated superficial velocities and shear stresses |
|
at 37 C for 6 h. |
are shown in Fig. 4. As designed, the device delivers shear stresses |
|
Microfluidic devices have the advantage of minimising sample |
spanning over at least two orders of magnitude (0.7–130 dynes |
|
volume, and are thus especially ideal when samples are scarce |
cm 2, 0.07–13 Pa). This range of shear stresses exceeds the range |
|
and expensive. However, under the most stringent condition of |
of shear stresses deemed to be physiological (1–70 dynes cm 2, |
|
no perfusion where all nutrient transport into the channels is via |
0.1–7 Pa) within in vivo vasculature. It also exceeds the range of |
|
diffusion, small dimensions are likely to impede nutrient |
shear stresses achieved by former systems, and has the advantage |
|
delivery.18,19 This is particularly evident during the cell attach- |
of confined shear stresses in individual channels for accurate data |
|
ment period. The cell attachment period was selected after cells |
acquisition.4,9,10,18 |
|
were observed at 4, 6, 8, 12, and 24 h without perfusion in the |
The HUVECs were evenly distributed in all channels after 6 h |
|
microchannels. The cells appeared attached by 4 h. They spread |
of cell attachment. While cell attachment is still evident in all |
|
and retained an appearance that was similar to those cultured in |
channels of the device (Fig. 3) after 20 h of perfusion, substantial |
|
macroscopic conditions for up to 8 h. However, at 12 h, 40% of |
reductions in cell density are noted in channel 1 (130 dynes cm 2, |
|
the cells appeared to round up. By 24 h, more than 90% of the |
13 Pa). This shear stress obviously exceeds the limit of HUVEC |
|
cells detached. From this observation, the cell attachment period |
adhesion. This highlights the versatility of this multishear |
|
of 6 h was selected. |
microdevice in detachment studies. It can be used to investigate |
|
The shear device was connected to a peristaltic pump (403U/ |
the ability of endothelial cells to withstand exposure to a range of |
|
VM4 Watson Marlow Pump, Sweden). Silicone tubing (20 cm, |
shear stresses, which is important to the viability of pre-seeded |
|
1500 mm ID, 1000 mm thick) was connected to the system for |
vascular grafts, as seeded cells can be washed away once blood |
|
bubble free oxygen supply. Perfusion was conducted at an inlet |
flow is restored to the graft.20 |
|
flow rate of 20 mL h 1 (steadily ramped up from 0 mL h 1 in 1 |
Von Willebrand factor is a large multimeric plasma protein |
|
min) on sub-confluent layers of HUVECs. The cell seeding inlet |
produced by endothelial cells and it is involved in promoting |
|
(Fig. 1) was not used during perfusion. The cells were then fixed |
platelet adhesion to damaged vessel walls. According to the |
|
and immunostained (Fig. 3). The data presented represents the |
results (Fig. 5), the vWF content of HUVECs increases with |
|
|
|
|
This journal is ª The Royal Society of Chemistry 2009 |
Lab Chip, 2009, 9, 1897–1902 | 1899 |
View Article Online
Published on 03 April 2009. Downloaded on 11/18/2019 10:55:52 AM.
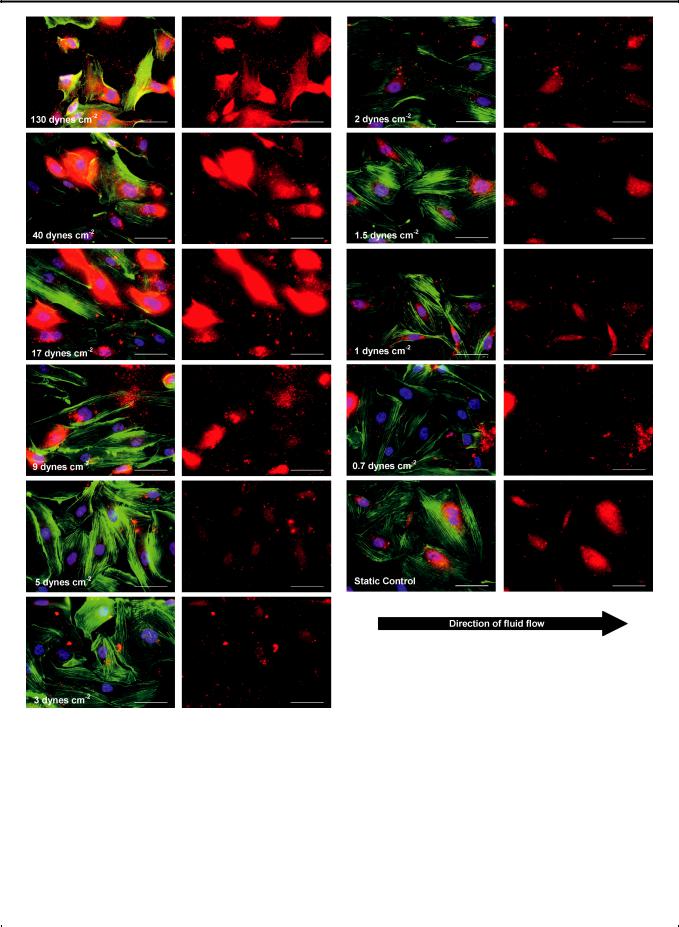
Fig. 3 (A) HUVECs were immunostained for intracellular and extracellular von Willebrand factor (red), rhodamine phalloidon (green), and Hoechst (blue) after 20 h of perfusion. (Scale bar: 50 mm). (B) Red channel showing vWF content of HUVECs (Scale bar: 50 mm).
increasing shear. This finding is in line with a number of |
into the circulating medium and subsequently extracellular vWF |
studies.21,22 In addition, the vWF content tends to be highly |
deposits are observed in the direction of flow. |
concentrated around the nucleus at lower shear stress, and it is |
According to Fig. 5, after 20 h of perfusion, HUVECs under |
noted in the periphery of the intracellular space and the extra- |
shear stresses ranging from 1–3 dynes cm 2 (0.1–0.3 Pa) produce |
cellular matrix at higher shear stresses. Interestingly, under high |
vWF at a level similar to the control (i.e. cells in the far corner of |
shear, vWF appears to be more concentrated at the part of a cell |
the reservoir in the same device where they experience zero to |
that is furthest away from the direction of flow. This suggests |
neglible fluid flow, similar to cells in culture flasks). Significantly |
that endothelial cells, grown under static conditions and that are |
higher vWF content is noted for cells under shear stresses above 5 |
suddenly exposed to shear stress, increase their vWF secretion |
dynes cm 2 (0.5 Pa), suggesting that an increased vWF |
|
|
1900 | Lab Chip, 2009, 9, 1897–1902 |
This journal is ª The Royal Society of Chemistry 2009 |

Published on 03 April 2009. Downloaded on 11/18/2019 10:55:52 AM.
View Article Online
Fig. 4 Measured and calculated superficial velocities and shear stresses for the multishear device at an inlet flow rate of 20 mL h 1. Standard error bars are smaller than symbols.
Fig. 5 Shear-dependent changes of vWF content of HUVECs after 20 h of perfusion. Data are the mean SE. **P < 0.05 flow versus static control.
production is necessary for these cells in terms of cell attachment. As for cells at 0.7 dynes cm 2 (0.07 Pa), the vWF content is significantly lower than the static control. This is interesting, considering that vWF is involved in cell adhesion. One explanation is that the flow rate associated with this shear stress is below the flow rate required for effective nutrient delivery and gas exchange within the microchannels. As aforementioned, microchannels hold very small volumes of medium ( 1 mL per channel) and perfusion is required for maintaining long-term cell viability.18,19 Therefore, it is likely that cells under 0.7 dynes cm 2 (0.07 Pa) were under an imposed quiescent-like state, resulting in reduced protein production. In order to confirm this, the cell morphology was analysed and further discussion is provided later in this paper.
In terms of morphology (cell and nuclear sizes, perimeters and circularities described in the Experimental section), HUVECs under shear stresses between 1–3 dynes cm 2 (0.1–0.3 Pa) closely resemble the static control, especially cells under 1.5 dynes cm 2 (0.15 Pa) (Fig. 3 and Fig. 6). Above 5 dynes cm 2 (0.5 Pa), cells are at least 30% smaller than the static control and display the general trend of decreasing cell size with increasing shear stress, yet the cell perimeter remains similar to the static control (Fig. 6A and Fig. 6B), except for cells at 130 dynes cm 2 (13 Pa), where cytoplasmic fragmentation is observed (Fig. 3). These cells appear to be retracting and blebbing, common signs of
Fig. 6 Quantitative analysis of cell morphology for HUVECs after 20 h of perfusion as a function of shear stress. (A) Cell and nuclear size. (B) Cell and nuclear perimeter. (C) Cell and nuclear circularity (a circularity value of 1.0 indicates a perfect circle. As the value approaches 0.0 it indicates an increasingly elongated polygon). Data are the mean SE. **P < 0.05 flow versus static control.
apoptosis.23,24 In particular, cells under 130 dynes cm 2 (13 Pa) have nuclear sizes that are 22% smaller than those in the static control, and extensive cell detachment is observed.
HUVECs under 0.7 dynes cm 2 (0.07 Pa) are 35% smaller than those in the static control (Fig. 6A). This further confirms our hypothesis that the flow rate corresponding to a shear stress of 0.7 dynes cm 2 (0.07 Pa) is below the ideal perfusion flow rate for maintaining HUVECs in microchannels, as mentioned earlier. Such information is particularly useful for vascular studies investigating the growth of endothelial cells in micronetworks, such as in vitro replicas of capillary beds, where perfusion is necessary for nutrient delivery. According to the results, flow rates associated with shear stresses from 1–3 dynes cm 2 (0.1–0.3 Pa) are most effective for growing HUVECs under perfusion in microchannels and micronetworks.
This journal is ª The Royal Society of Chemistry 2009 |
Lab Chip, 2009, 9, 1897–1902 | 1901 |

Published on 03 April 2009. Downloaded on 11/18/2019 10:55:52 AM.
View Article Online
On a final note, there is more cell elongation and actin filament |
3 |
J. E. Moore, Jr., E. Burki, A. Suciu, S. Zhao, M. Burnier, |
||||||||
alignment in the direction of flow at higher shear levels (Fig. 3 |
|
H. R. Brunner and J. J. Meister, Ann. Biomed. Eng., 1994, 22, 416. |
||||||||
4 |
S. Usami, H. H. Chen, Y. Zhao, S. Chien and R. Skalak, Ann. Biomed. |
|||||||||
and Fig. 6C). This agrees with findings in a number of studies.22,25 |
||||||||||
|
Eng., 1993, 21, 77. |
|||||||||
In addition, in a small 2 h perfusion study, the cells were observed |
|
|||||||||
5 |
C. Urbich, E. Dernbach, A. Reissner, M. Vasa, A. M. Zeiher and |
|||||||||
to migrate downstream in the direction of flow. Future studies |
|
S. Dimmeler, Arterioscler. Thromb. Vasc. Biol., 2002, 22, 69. |
||||||||
will incorporate |
time lapse microscopy to investigate cell |
6 |
J. Seebach, P. Dieterich, F. Luo, H. Schillers, D. Vestweber, |
|||||||
|
H. Oberleithner, H. J. Galla and H. J. Schnittler, Lab Invest., 2000, |
|||||||||
behaviour with shear over time. |
|
|
|
|
|
|||||
|
|
|
|
|
80, 1819. |
|||||
|
|
|
|
|
|
|
|
|
||
|
|
|
|
|
|
|
|
7 |
M. Morigi, C. Zoja, M. Figliuzzi, M. Foppolo, G. Micheletti, |
|
Conclusions |
|
|
|
|
|
|
|
M. Bontempelli, M. Saronni, G. Remuzzi and A. Remuzzi, Blood, |
||
|
|
|
|
|
|
|
|
|
1995, 85, 1696. |
|
This multishear |
microdevice delivers |
physiologically |
relevant |
8 |
C. G. Galbraith, R. Skalak and S. Chien, Cell Motil. Cytoskeleton, |
|||||
shear stresses, spanning over two orders of magnitude for any |
|
1998, 40, 317. |
||||||||
9 |
J. Y. Ji, H. Jing and S. L. Diamond, Circ. Res., 2003, 92, 279. |
|||||||||
one flow rate, making it a very convenient and time saving tool |
||||||||||
10 |
E. Gutierrez, B. G. Petrich, S. J. Shattil, M. H. Ginsberg, |
|||||||||
for mapping or screening cell behaviour. In addition, it requires |
|
A. Groisman and A. Kasirer-Friede, Lab Chip, 2008, 8, 1486. |
||||||||
minimal |
sample |
volume, |
making |
it |
attractive |
for |
studies |
11 |
D. P. Gaver, 3rd and S. M. Kute, Biophys. J., 1998, 75, 721. |
|
12 |
G. Kaplanski, C. Farnarier, A. M. Benoliel, C. Foa, S. Kaplanski and |
|||||||||
involving |
scarce |
and expensive samples. To date, |
this device |
|||||||
|
P. Bongrand, J. Cell Sci., 1994, 107(Pt 9), 2449. |
|||||||||
covers the widest range of shear stresses in comparison to other |
|
|||||||||
13 |
W. Van Driessche, P. De Smet and G. Raskin, Pfluegers Arch., 1993, |
|||||||||
published shear devices. We used it to study HUVECs and our |
|
425, 164. |
||||||||
results showed that there was a shear-dependent regulation of |
14 |
E. B. Hunziker and R. K. Schenk, J. Physiol., 1989, 414, 55. |
||||||||
15 |
H. G. Verhage, M. L. Bareither, R. C. Jaffe and M. Akbar, Am. |
|||||||||
vWF, and cell elongation and actin filament alignment in the |
||||||||||
|
J. Anat., 1979, 156, 505. |
|||||||||
|
|
|
|
|
|
|
|
|
||
direction of shear. |
|
|
|
|
|
16 |
A. M. Malek, S. L. Alper and S. Izumo, Jama, 1999, 282, 2035. |
|||
|
|
|
|
|
|
|
|
17 |
A. Gnasso, C. Carallo, C. Irace, M. S. De Franceschi, P. L. Mattioli, |
|
Acknowledgements |
|
|
|
|
|
|
C. Motti and C. Cortese, Atherosclerosis, 2001, 156, 171. |
|||
|
|
|
|
|
18 |
H. Lu, L. Y. Koo, W. M. Wang, D. A. Lauffenburger, L. G. Griffith |
||||
|
|
|
|
|
|
|
|
|||
The authors wish to acknowledge Dr Nicholas Timmins and |
|
and K. F. Jensen, Anal. Chem., 2004, 76, 5257. |
||||||||
19 |
G. M. Walker, H. C. Zeringue and D. J. Beebe, Lab Chip, 2004, 4, 91. |
|||||||||
Dr Ian Aird from the Australian Institute for Bioengineering and |
||||||||||
20 |
P. Feugier, R. A. Black, J. A. Hunt and T. V. How, Biomaterials, |
|||||||||
Nanotechnology (AIBN) for donating HUVECs, and funding |
|
2005, 26, 1457. |
||||||||
from Australian |
Research |
Council |
(ARC) Discovery |
Grants |
21 |
M. Galbusera, C. Zoja, R. Donadelli, S. Paris, M. Morigi, A. Benigni, |
||||
|
M. Figliuzzi, G. Remuzzi and A. Remuzzi, Blood, 1997, 90, 1558. |
|||||||||
Scheme. |
|
|
|
|
|
|
|
|
||
|
|
|
|
|
|
|
22 |
R. J. Sun, S. Muller, X. Wang, F. Y. Zhuang and J. F. Stoltz, Clin. |
||
|
|
|
|
|
|
|
|
|||
|
|
|
|
|
|
|
|
|
Hemorheol. Microcirc., 2000, 23, 1. |
|
References |
|
|
|
|
|
|
23 |
G. Hacker, Cell Tissue Res., 2000, 301, 5. |
||
|
|
|
|
|
|
|
|
24 |
B. Levkau, B. Herren, H. Koyama, R. Ross and E. W. Raines, J. Exp. |
|
1 D. M. Wootton and D. N. Ku, Annu. Rev. Biomed. Eng., 1999, 1, 299. |
|
Med., 1998, 187, 579. |
||||||||
2 P. F. Davies, C. F. Dewey, Jr., S. R. Bussolari, E. J. Gordon and |
25 |
C. F. Dewey, Jr., S. R. Bussolari, M. A. Gimbrone, Jr. and |
||||||||
M. A. Gimbrone, Jr., J. Clin. Invest., 1984, 73, 1121. |
|
|
|
P. F. Davies, J. Biomech. Eng., 1981, 103, 177. |
||||||
1902 | Lab Chip, 2009, 9, 1897–1902 |
This journal is ª The Royal Society of Chemistry 2009 |