

Epidemiology for English speaking students / How to read a paper / Reading_statistics 1
.pdfHow to read a paper: Statistics for the nonstatistician. I: Different types of data need different statistical tests
Trisha Greenhalgh, senior lecturer a
aUnit for Evidence-Based Practice and Policy, Department of Primary Care and Population Sciences, University College London Medical School/Royal Free Hospital School of Medicine, Whittington
Hospital, London N19 5NF p.greenhalgh@ucl.ac.uk
Introduction
As medicine leans increasingly on mathematics no clinician can afford to leave the statistical aspects of a paper to the "experts." If you are numerate, try the "Basic Statistics for Clinicians" series in the Canadian Medical Association Journal,1 2 3 4 or a more mainstream statistical textbook.5 If, on the other hand, you find statistics impossibly difficult, this article and the next in this series give a checklist of preliminary questions to help you appraise the statistical validity of a paper.
Have the authors set the scene correctly?
Have they determined whether their groups are comparable, and, if necessary, adjusted for baseline differences?
Most comparative clinical trials include either a table or a paragraph in the text showing the baseline characteristics of the groups being studied. Such a table should show that the intervention and control groups are similar in terms of age and sex distribution and key prognostic variables (such as the average size of a cancerous lump). Important differences in these characteristics, even if due to chance, can pose a challenge to your interpretation of results. In this situation, adjustments can be made to allow for these differences and hence strengthen the argument.6
Summary points
In assessing the choice of statistical tests in a paper, first consider whether groups were analysed for their comparability at baseline
Does the test chosen reflect the type of data analysed (parametric or non-parametric, paired or unpaired)?
Has a two tailed test been performed whenever the effect of an intervention could conceivably be a negative one?
Have the data been analysed according to the original study protocol?
If obscure tests have been used, do the authors justify their choice and provide a reference?

What sort of data have they got, and have they used appropriate statistical tests?
Numbers are often used to label the properties of things. We can assign a number to represent our height, weight, and so on. For properties like these, the measurements can be treated as actual numbers. We can, for example, calculate the average weight and height of a group of people by averaging the measurements. But consider an example in which we use numbers to label the property "city of origin," where 1=London, 2=Manchester, 3=Birmingham, and so on. We could still calculate the average of these numbers for a particular sample of cases, but we would be completely unable to interpret the result. The same would apply if we labelled the property "liking for x" with 1=not at all, 2=a bit, and 3=a lot. Again, we could calculate the "average liking," but the numerical result would be uninterpretable unless we knew that the difference between "not at all" and "a bit" was exactly the same as the difference between "a bit" and "a lot."
PETER BROWN
All statistical tests are either parametric (that is, they assume that the data were sampled from a particular form of distribution, such as a normal distribution) or nonparametric (they make no such assumption). In general, parametric tests are more powerful than non-parametric ones and so should be used if possible.
Non-parametric tests look at the rank order of the values (which one is the smallest, which one comes next, and so on) and ignore the absolute differences between them. As you might imagine, statistical significance is more difficult to show with nonparametric tests, and this tempts researchers to use statistics such as the r value inappropriately. Not only is the r value (parametric) easier to calculate than its nonparametric equivalent but it is also much more likely to give (apparently) significant results. Unfortunately, it will give a spurious estimate of the significance of the result, unless the data are appropriate to the test being used. More examples of parametric tests and their non-parametric equivalents are given in table 1).
Table 1 Some commonly used statistical tests
|
Example of |
|
|
|
equivalent non- |
|
|
Parametric test |
parametric test |
Purpose of test |
Example |
|
|
|
|
Two sample |
Mann-Whitney |
Compares two independent |
To compare girls' heights |
(unpaired) t test |
U test |
samples drawn from the same |
with boys' heights |
|
|
population |
|

One sample |
Wilcoxon |
Compares two sets of |
(paired) t test |
matched pairs |
observations on a single |
|
test |
sample |
To compare weight of infants before and after a feed
One way analysis |
Kruskall-Wallis Effectively, a generalisation of |
To determine whether |
|
of variance (F |
analysis of |
the paired t or Wilcoxon |
plasma glucose level is |
test) using total |
variance by |
matched pairs test where three higher one hour, two hours, |
|
sum of squares |
ranks |
or more sets of observations |
or three hours after a meal |
|
|
are made on a single sample |
|
Two way analysis |
Two way |
As above, but tests the |
of variance |
analysis of |
influence (and interaction) of |
|
variance by |
two different covariates |
|
ranks |
|
2 test |
Fisher's exact |
Tests the null hypothesis that |
|
test |
the distribution of a |
|
|
discontinuous variable is the |
|
|
same in two (or more) |
|
|
independent samples |
Product moment |
Spearman's |
Assesses the strength of the |
correlation |
rank |
straight line association |
coefficient |
correlation |
between two continuous |
(Pearson's r) |
coefficient (r ) |
variables. |
Regression by |
Non-parametric Describes the numerical |
|
least squares |
regression |
relation between two |
method |
(various tests) |
quantitative variables, |
|
|
allowing one value to be |
|
|
predicted from the other |
In the above example, to determine if the results differ in male and female subjects
To assess whether acceptance into medical school is more likely if the applicant was born in Britain
To assess whether and to what extent plasma HbA1 concentration is related to plasma triglyceride concentration in diabetic patients
To see how peak expiratory flow rate varies with height
Multiple |
Non-parametric Describes the numerical |
|
regression by |
regression |
relation between a dependent |
least squares |
(various tests) |
variable and several predictor |
method |
|
variables (covariates) |
To determine whether and to what extent a person's age, body fat, and sodium intake determine their blood pressure
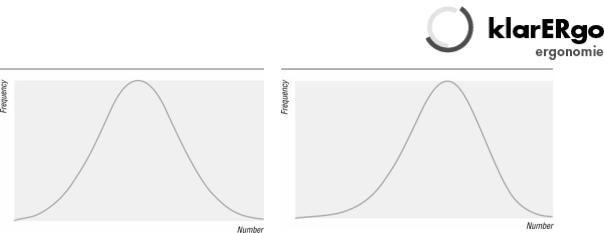
Another consideration is the shape of the distribution from which the data were sampled. When I was at school, my class plotted the amount of pocket money received against the number of children receiving that amount. The results formed a histogram the same shape as figure 2—a "normal" distribution. (The term "normal" refers to the shape of the graph and is used because many biological phenomena show this pattern of distribution). Some biological variables such as body weight show "skew normal" distribution, as shown in figure 3. (Figure 3) shows a negative skew, whereas body weight would be positively skewed. The average adult male body weight is 70 kg, and people exist who weigh 140 kg, but nobody weighs less than nothing, so the graph cannot possibly be symmetrical.
|
|
Fig 1 Normal curve |
Fig 2 Skewed curve |
Non-normal (skewed) data can sometimes be transformed to give a graph of normal shape by performing some mathematical transformation (such as using the variable's logarithm, square root, or reciprocal). Some data, however, cannot be transformed into a smooth pattern. For a very readable discussion of the normal distribution see chapter 7 of Martin Bland's Introduction to Medical Statistics.5
Deciding whether data are normally distributed is not an academic exercise, since it will determine what type of statistical tests to use. For example, linear regression will give misleading results unless the points on the scatter graph form a particular distribution about the regression line—that is, the residuals (the perpendicular distance from each point to the line) should themselves be normally distributed. Transforming data to achieve a normal distribution (if this is indeed achievable) is not cheating: it simply ensures that data values are given appropriate emphasis in assessing the overall effect. Using tests based on the normal distribution to analyse non-normally distributed data, however, is definitely cheating.
If the authors have used obscure statistical tests, why have they done so and have they referenced them?
The number of possible statistical tests sometimes seems infinite. In fact, most statisticians could survive with a formulary of about a dozen. The rest should generally be reserved for special indications. If the paper you are reading seems to describe a standard set of data which have been collected in a standard way, but the test used has an unpronounceable name and is not listed in a basic statistics textbook, you should smell a rat. The authors should, in such circumstances, state why they have used this test, and give a reference (with page numbers) for a definitive description of it.
Are the data analysed according to the original protocol?
If you play coin toss with someone, no matter how far you fall behind, there will come a time when you are one ahead. Most people would agree that to stop the game then would not be a fair way to play. So it is with research. If you make it inevitable that you will (eventually) get an apparently positive result you will also make it inevitable that you will be misleading yourself about the justice of your case.7 (Terminating an intervention trial prematurely for ethical reasons when subjects in one arm are faring particularly badly is a different matter and is discussed elsewhere.7)

Raking over your data for "interesting results" (retrospective subgroup analysis) can lead to false conclusions.8 In an early study on the use of aspirin in preventing stroke, the results showed a significant effect in both sexes combined, and a retrospective subgroup analysis seemed to show that the effect was confined to men.9 This conclusion led to aspirin being withheld from women for many years, until the results of other studies10 showed that this subgroup effect was spurious.
This and other examples are included in Oxman and Guyatt's, "A consumer's guide to subgroup analysis," which reproduces a useful checklist for deciding whether apparent subgroup differences are real.11
Paired data, tails, and outliers
Were paired tests performed on paired data?
Students often find it difficult to decide whether to use a paired or unpaired statistical test to analyse their data. There is no great mystery about this. If you measure something twice on each subject—for example, blood pressure measured when the subject is lying and when standing—you will probably be interested not just in the average difference of lying versus standing blood pressure in the entire sample, but in how much each individual's blood pressure changes with position. In this situation, you have what is called "paired" data, because each measurement beforehand is paired with a measurement afterwards.
In this example, it is using the same person on both occasions which makes the pairings, but there are other possibilities (for example, any two measurements of bed occupancy made of the same hospital ward). In these situations, it is likely that the two sets of values will be significantly correlated (for example, my blood pressure next week is likely to be closer to my own blood pressure last week than to the blood pressure of a randomly selected adult last week). In other words, we would expect two randomly selected paired values to be closer to each other than two randomly selected unpaired values. Unless we allow for this, by carrying out the appropriate paired sample tests, we can end up with a biased estimate of the significance of our results.
Was a two tailed test performed whenever the effect of an intervention could conceivably be a negative one?
The term "tail" refers to the extremes of the distribution—the areas at the outer edges of the bell in figure 2. Let's say that the graph represents the diastolic blood pressures of a group of people of which a random sample are about to be put on a low sodium diet. If a low sodium diet has a significant lowering effect on blood pressure, subsequent blood pressure measurements on these subjects would be more likely to lie within the left tail of the graph. Hence we would analyse the data with statistical tests designed to show whether unusually low readings in this patient sample were likely to have arisen by chance.
But on what grounds may we assume that a low sodium diet could only conceivably put blood pressure down, but could never do the reverse, put it up? Even if there are valid physiological reasons in this particular example, it is certainly not good science always to assume that you know the direction of the effect which your intervention will have. A new drug intended to relieve nausea might actually exacerbate it, or an

educational leaflet intended to reduce anxiety might increase it. Hence, your statistical analysis should, in general, test the hypothesis that either high or low values in your dataset have arisen by chance. In the language of the statisticians, this means you need a two tailed test, unless you have very convincing evidence that the difference can only be in one direction.
Were "outliers" analysed with both common sense and appropriate statistical adjustments?
Unexpected results may reflect idiosyncrasies in the subject (for example, unusual metabolism), errors in measurement (faulty equipment), errors in interpretation (misreading a meter reading), or errors in calculation (misplaced decimal points). Only the first of these is a "real" result which deserves to be included in the analysis. A result which is many orders of magnitude away from the others is less likely to be genuine, but it may be so. A few years ago, while doing a research project, I measured several different hormones in about 30 subjects. One subject's growth hormone levels came back about 100 times higher than everyone else's. I assumed this was a transcription error, so I moved the decimal point two places to the left. Some weeks later, I met the technician who had analysed the specimens and he asked, "Whatever happened to that chap with acromegaly?"
Statistically correcting for outliers (for example, to modify their effect on the overall result) requires sophisticated analysis and is covered elsewhere.6
References
1.Guyatt G, Jaenschke R, Heddle, N, Cook D, Shannon H, Walter S. Basic statistics for clinicians. 1. Hypothesis testing. Can Med Assoc J 1995;152:27-32.
2.Guyatt G, Jaenschke R, Heddle, N, Cook D, Shannon H, Walter S. Basic statistics for clinicians. 2. Interpreting study results: confidence intervals. Can Med Assoc J 1995;152:169-73. [Abstract]
3.Jaenschke R, Guyatt G, Shannon H, Walter S, Cook D, Heddle, N. Basic statistics for clinicians: 3. Assessing the effects of treatment: measures of association. Can Med Assoc J 1995;152:351-7.
4.Guyatt G, Walter S, Shannon H, Cook D, Jaenschke R, Heddle, N. Basic statistics for clinicians. 4. Correlation and regression. Can Med Assoc J 1995;152:497-504. [Abstract]
5.Bland M. An introduction to medical statistics. Oxford: Oxford University Press, 1987.
6.Altman D. Practical statistics for medical research. London: Chapman and Hall, 1995.
7.Hughes MD, Pocock SJ. Stopping rules and estimation problems in clinical trials.
Statistics in Medicine 1987;7:1231-42.
8.Stewart LA, Parmar MKB. Bias in the analysis and reporting of randomized controlled trials. Int J Health Technology Assessment 1996;12:264-75.
9.Canadian Cooperative Stroke Group. A randomised trial of aspirin and sulfinpyrazone in threatened stroke. N Engl J Med 1978;299:53-9.

10.Antiplatelet Trialists Collaboration. Secondary prevention of vascular disease by prolonged antiplatelet treatment. BMJ 1988;296:320-1.
11.Oxman, AD, Guyatt GH. A consumer's guide to subgroup analysis. Ann Intern Med 1992;116:79-84.

How to read a paper: Statistics for the nonstatistician. II: "Significant" relations and their pitfalls
Trisha Greenhalgh, senior lecturer a
aUnit for Evidence-Based Practice and Policy, Department of Primary Care and Population Sciences, University College London Medical School/Royal Free Hospital School of Medicine, Whittington
Hospital, London N19 5NF p.greenhalgh@ucl.ac.uk
Introduction
This article continues the checklist of questions that will help you to appraise the statistical validity of a paper. The first of this pair of articles was published last week.1
Correlation, regression, and causation
Has correlation been distinguished from regression, and has the correlation coefficient (r value) been calculated and interpreted correctly?
For many non-statisticians, the terms "correlation" and "regression" are synonymous, and refer vaguely to a mental image of a scatter graph with dots sprinkled messily along a diagonal line sprouting from the intercept of the axes. You would be right in assuming that if two things are not correlated, it will be meaningless to attempt a regression. But regression and correlation are both precise statistical terms which serve quite different functions.1
The r value (Pearson's product-moment correlation coefficient) is among the most overused statistical instrument. Strictly speaking, the r value is not valid unless the following criteria are fulfilled:
Summary points
An association between two variables is likely to be causal if it is strong, consistent, specific, plausible, follows a logical time sequence, and shows a dose-response gradient
A P value of <0.05 means that this result would have arisen by chance on less than one occasion in 20
The confidence interval around a result in a clinical trial indicates the limits within which the "real" difference between the treatments is likely to lie, and hence the strength of the inference that can be drawn from the result
A statistically significant result may not be clinically significant. The results of intervention trials should be expressed in terms of the likely benefit an individual could expect (for example, the absolute risk reduction)

∙The data (or, more accurately, the population from which the data are drawn) should be
normally distributed. If they are not, non-itemmetric tests of correlation should be used instead.1
∙The two datasets should be independent (one should not automatically vary with the other). If they are not, a paired t test or other paired test should be used.
∙Only a single pair of measurements should be made on each subject. If repeated measurements are made, analysis of variance should be used instead.2
∙Every r value should be accompanied by a P value, which expresses how likely an association of this strength would be to have arisen by chance, or a confidence interval, which expresses the range within which the "true" r value is likely to lie.
Remember, too, that even if the r value is appropriate for a set of data, it does not tell you whether the relation, however strong, is causal (see below).
PETER BROWN
The term "regression" refers to a mathematical equation that allows one variable (the target variable) to be predicted from another (the independent variable). Regression, then, implies a direction of influence, although—as the next section will argue—it does not prove causality. In the case of multiple regression, a far more complex mathematical equation (which, thankfully, usually remains the secret of the computer that calculated it) allows the target variable to be predicted from two or more independent variables (often known as covariables).
The simplest regression equation, which you may remember from your school days, is y=a+bx, where y is the dependent variable (plotted on the vertical axis), x is the independent variable (plotted on the horizontal axis), and a is the y intercept. Not many biological variables can be predicted with such a simple equation. The weight of a group of people, for example, varies with their height, but not in a linear way. I am twice as tall as my son and three times his weight, but although I am four times as tall as my newborn nephew I am much more than six times his weight. Weight, in fact, probably varies more closely with the square of someone's height than with height itself (so a quadratic rather than a linear regression would probably be more appropriate).
Of course, even when the height-weight data fed into a computer are sufficient for it to calculate the regression equation that best predicts a person's weight from their height, your predictions would still be pretty poor since weight and height are not all that closely correlated. There are other things that influence weight in addition to height, and we could, to illustrate the principle of multiple regression, enter data on age, sex, daily calorie intake, and physical activity into the computer and ask it how much each of these covariables contributes to the overall equation (or model).

The elementary principles described here, particularly the criteria for the r value given above, should help you to spot whether correlation and regression are being used correctly in the paper you are reading. A more detailed discussion on the subject can be found elsewhere.2 3
Have assumptions been made about the nature and direction of causality?
Remember the ecological fallacy: just because a town has a large number of unemployed people and a very high crime rate, it does not necessarily follow that the unemployed are committing the crimes. In other words, the presence of an association between A and B tells you nothing at all about either the presence or the direction of causality. To show that A has caused B (rather than B causing A, or A and B both being caused by C), you need more than a correlation coefficient. The box gives some criteria, originally developed by Sir Austin Bradford Hill, which should be met before assuming causality.4
Tests for causation4
∙Is there evidence from true experiments in humans?
∙Is the association strong?
∙Is the association consistent from study to study?
∙Is the temporal relation appropriate (did the postulated cause precede the postulated effect)?
∙Is there a dose-response gradient (does more of the postulated effect follow more of the postulated cause)?
∙Does the association make epidemiological sense?
∙Does the association make biological sense?
∙Is the association specific?
∙Is the association analogous to a previously proved causal association?
Probability and confidence
Have "P values" been calculated and interpreted appropriately?
One of the first values a student of statistics learns to calculate is the P value—that is, the probability that any particular outcome would have arisen by chance. Standard scientific practice, which is entirely arbitrary, usually deems a P value of less than 1 in 20 (expressed as P<0.05, and equivalent to a betting odds of 20 to 1) as "statistically significant" and a P value of less than 1 in 100 (P<0.01) as "statistically highly significant."
By definition, then, one chance association in 20 (this must be around one major published result per journal issue) will seem to be significant when it is not, and one in 100 will seem highly significant when it is really what my children call a "fluke." Hence, if you must analyse multiple outcomes from your data set, you need to make a correction to try to allow for this (usually achieved by the Bonferroni method5 6).
A result in the statistically significant range (P<0.05 or P<0.01, depending on what is chosen as the cut off) suggests that the authors should reject the null hypothesis (the hypothesis that there is no real difference between two groups). But a P value in the non-significant range tells you that either there is no difference between the groups or