5.2 Example of reports creation for database “Product realization of Holding company “Group nord”
5.2.1. Create a report by using Wizard
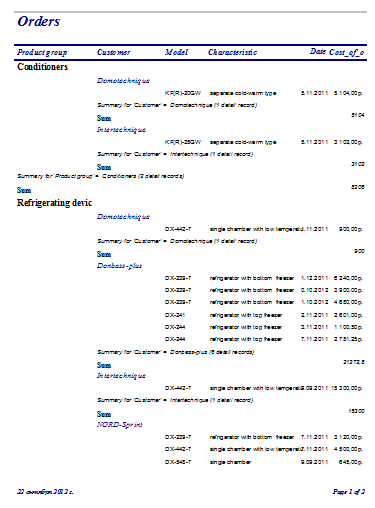
Create a report to view data on “Orders” query. Make a data grouping by products group, in the middle by Customers, the totals for groups must include the total sum of orders.
Click the Reports icon in the Objects bar and double-click “Create report by using wizard”. Click the Tables/Queries list arrow and choose source of data (the “Orders” query) and tell the Wizard which fields you want to display on the report (Customer, Model, Characteristic, Product_group, Date, Cost_of_order). Click the button to add all the fields to your form. Next.
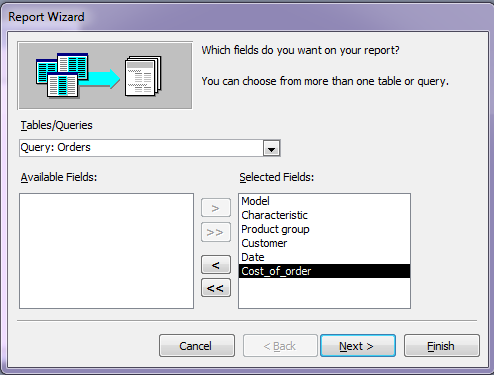

Figure 5.1 - The first step of form Wizard
According the condition set levels of grouping, move to the right part of the windows fields: Product_group and Customer. Next.
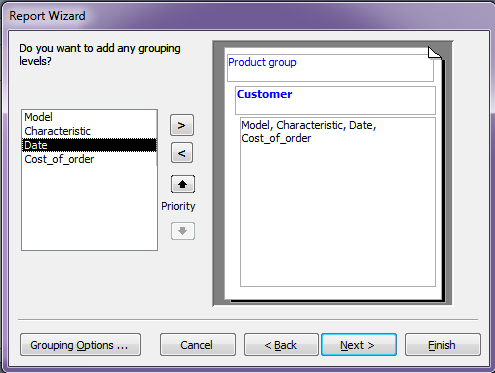
Figure 5.2 - The second step of form Wizard: adding grouping levels
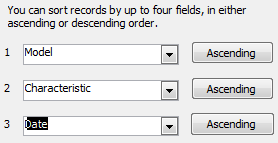
Set the way of sorting records.
Press
![]() button,
choose function Sum.
button,
choose function Sum.
![]() ОК.
Next…
ОК.
Next…
Set layout of data (Stepped). Next …
If you're trying to get a lot of fields onto your report, consider using Landscape orientation. Landscape orientation lays the page along its longest side.
Choose the color styles that you will use in your report (Corporate) Next …
Give your report a name (“Orders”). Click Finish.
After a few moments, your new report appears on screen, as shown in figure.
Close the report.
5.2.2. Create report in design view
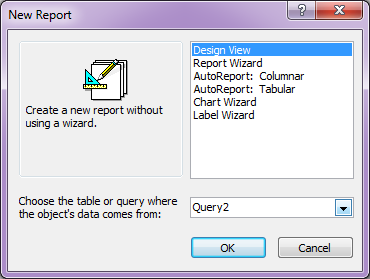
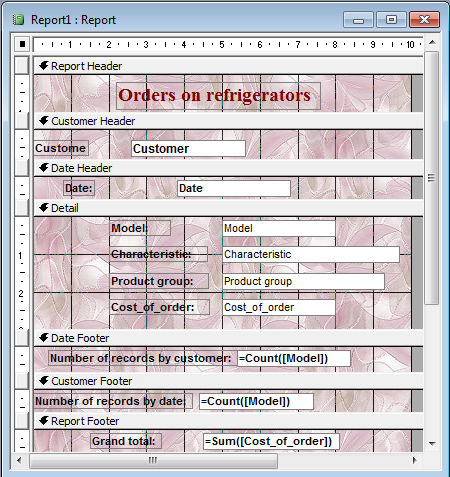
Create report «Orders on refrigerators» in design view. In the report group data by customers, in the middle by dates. Totals for groups should have the total amount of records in it. The grand totals of a report should have average cost of orders. Press New button in the Report menu. In the window select Design view and choose a query where the object’s data comes from (“Orders on refrigerators”).
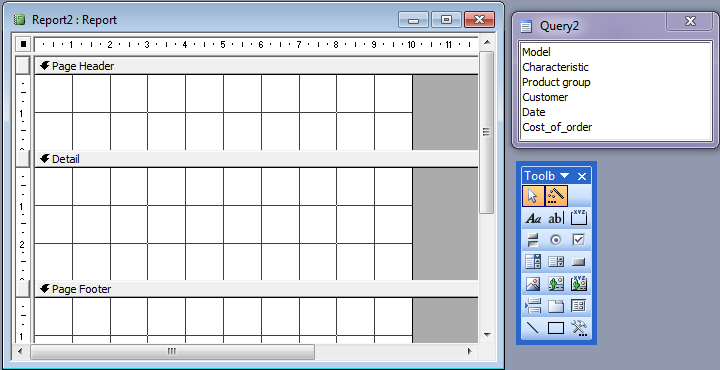
Show the table field list and toolbox. In the field list box we can see all fields of the “Orders on refrigerators” query. This fields can be placed on the report.
Buttons on the toolbox are used to add multiple items to the design grid.
Turn Report Header and Footer on under View Report Header/Footer.
Remove Page Header and Footer by the command of the main menu View Page Header/Footer.
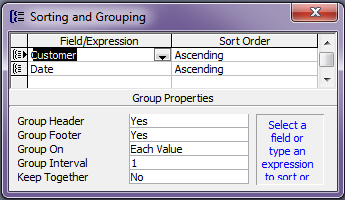
Grouping in design view you can be done with the command of the main menu View Sorting and grouping. You can choose grouping levels by one or several fields. For each field set: Group header – Yes, Group Footer – Yes. For both fields set:
Group Header – Yes
Group Footer – Yes
Close a window.
Drag item Customer on the field list to the report, section Customer group Header.
Drag item Date on the field list to the report, section Date group Header.
All other fields (Model, Characteristic, Product group, Cost of order) drag into Detail section.
To calculate summary values:
- In the Customer Footer create field with the help of (Text box) button, where set:
Number of records by customer: =Count([Model])
- In the Date Footer create field with the help of (Text box) button, where set:
Number of records by date: =Count([Model])
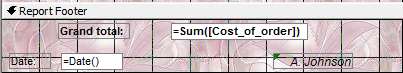
- In the Report Footer create field with the help of (Text box) button, where set:
Grand total: =Sum([Cost_of_order])
With the help of (Label) button on the toolbox create title of the form “Orders on refrigerators”. Format the title as you wish.
Design view of the report.
In the Report Footer create field for current date with the help of (Text box) button and name of accountable person (Label) button.
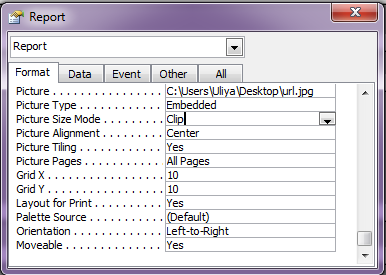
The area of report format with picture.
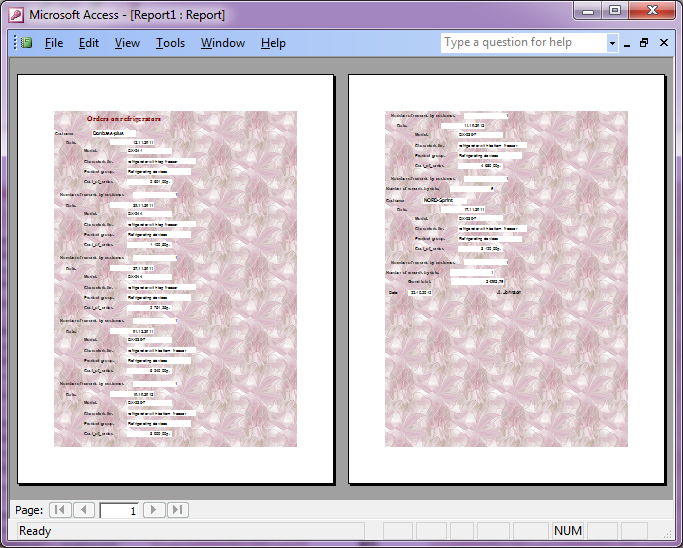
On the Print preview we will see: