- •Industry Overview & Competitive Positioning
- •Investment Summary
- •Valuation
- •Investment Risks
- •Income statement
- •New segment?
- •Effect which appears due to vertical integration and segment interconnection
- •Variance of ebit margin of different segments explained by ebit margin from other segments
- •Cfa Institute Research Challenge
Valuation
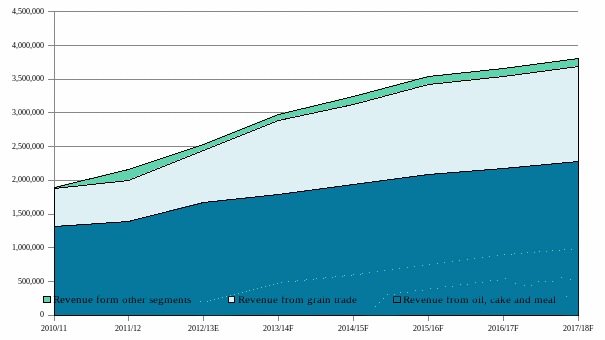
Figure 22. Revenue breakedown Revenue by segment breakedown, Ths USD
Source: KNU estimates
|
DCF Valuation To estimate the fair price of Kernel we used the discounted cash flow model and applied discounted cash flow to firm approach. The company’s strategy disclosure is limited with 3-4 years, accounting for the expansion in the Russian market. We think that after this crucial period company’s figures will reach relative stability. This fact denoted the forecasting period of 5 years. Revenue. The revenues are calculated on the segment basis. On the volume side, the bulk oil volumes are expected to grow up on par with the company’s crushing capacities. The 2013 stands out, representing appreciable 41%yoy leap, 13% of which accounts for the weak sales and high inventories in 2012. We think that the bottled oil segment has moderate market capacity, and therefore the rise of 12% in 2012 and 7% in 2013 is to be replaced by stagnation at 1-2%yoy. Considering inspiring industry outlook, our analysis suggest that Kernel will be able to accomplish its goals in Russia to the full, and both the grain sales and export terminal throughput will grow for additional 2.5mt up to 2016 (see Apendix 4) The prices for the oil and grain products are calculated using the FARPI-ISU 2012 World Agricultural Outlook. The discount rate was applied to the forecasts, obtained by comparing historical FARPI prices to the Ukrainian grain and oil price indices reported by the UkrAgroConsult. The revenues from the export terminals, silos and farming are going up extremely slowly as we mainly suppose them to benefit to the intersegment sales of fast-expanding grain segment. We also supposed that the sugar beet plant will be sold in the nearest future, and therefore, will not bring additional revenue after first quarter of 2013. Costs. The raw material used accounts for around 71% of the sales. We expect this ratio to stay constant as we are sure that Kernel will be successful in passing COGS increase on the final consumer. Rental expenses are based on the land lease rights the company poses and calculated with respect to them. The payroll and other expenses are supposed to grow with the rate of company’s asset expansion. Change in working capital. We projected the inventories using the inventory turnover ratio (6.0), obtained on the basis of company’s historical data with adjustments made to 2012 because of the unusual record-high values. More than 95% of biological assets consist of crops, beans and seeds. So, we assume that their value is mostly preconditioned by the land the company rents. Other components of the working capital were calculated with an assumption of constant WC/Sales proportion. |
|||||||||||||||||||||||||||||||||||||||||||||||||||||||||||||||||||||||||||||||||||||||||||||||||||||||||||||||||||||||||||||||||||||||||||||||||||||||||||||||||||||||||||||||||||||||||||||||||||||||||||||||||||||||||||||||||||||||||||||||||||||||||||||||||
Figure 23. FCFF valuation summary
Source: KNU estimates |
||||||||||||||||||||||||||||||||||||||||||||||||||||||||||||||||||||||||||||||||||||||||||||||||||||||||||||||||||||||||||||||||||||||||||||||||||||||||||||||||||||||||||||||||||||||||||||||||||||||||||||||||||||||||||||||||||||||||||||||||||||||||||||||||||
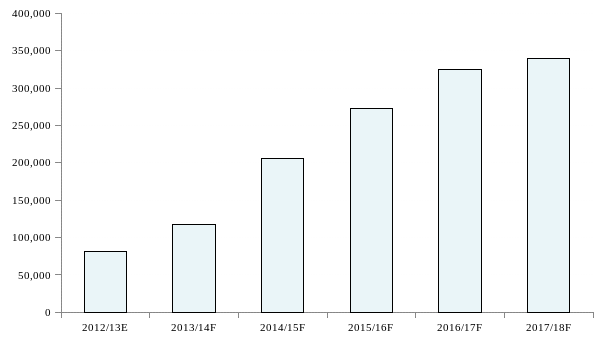
Figure 24. CapEx assumptions Ths. USD
Source: KNU estimates |
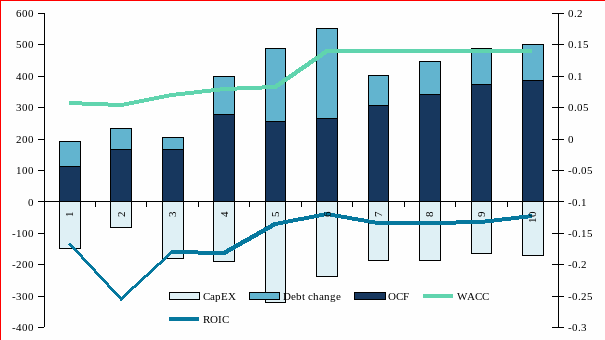
CapEx. The company’s CapEx plan has a time horizon of 3 years. Kernel plans to spend around 100USDM on the acquisition/constructions of new silos and approximately 120USDM. for building a crushing plant in Voronezh. The acquisition of Taman terminal has brought135M.USD CapEx in 2013 and infusion of 20USDM. is expected annually for the two subsequent years aimed at its expansion. On the other hand, Kernel has announced the plans of selling sugar plants. According to our estimation will be sold approximately at their book value, which will create an additional cash inflow of 60USDM. Therefore, considering the estimated expenses on maintaining the PP&E, we suppose CapEx in tangible assets accounts for 200USDM. in 2013 and 150USDM. in 2014 and 2015. We also expect that in 2016-2017 it will represent 105% of depreciation (5% of which accounts for long-term Ukrainian inflation) plus additional 34% (calculated on the basis of historical data) spent on building of new capacities which are then transferred to constructions and production equipment at 2:1 ratio. Increase in intangible assets is supposed to stay constant, equal to 37USDM. spending on purchase of land lease rights and 0.5USDM. on other assets annually. WACC. The WACC was calculated using the market Debt/Equity ratio of the 2012 which is equal to 0.46. We also suppose that the book ratio won’t change dramatically in the future. The cost of debt was taken as a 9.6% average interest paid 2006-2012. Taking into account the positive line of the company’s taxes, we are obliged to assume effective tax rate of 0%. The estimated Cost of Equity is 15.80% (see appendix 11). Thus, we assume constant WACC of 13.83%. Terminal growth rate. We assumed the terminal growth rate of 3.00%, 1.9% of which accounts for long-term US inflation and 1.1% for the annual world population growth rate. Uses of FCF: Kernel has approved that the dividends are to be paid from 2013. Moreover, the company considers the dividends as a main option to deal with the excessive cash. WIG index presents the dividend yield of 3.8%, which accounts for approximately 30% dividend payment ratio for Kernel in 2013. We assume this ratio will stay constant for further periods. |
|||||||||||||||||||||||||||||||||||||||||||||||||||||||||||||||||||||||||||||||||||||||||||||||||||||||||||||||||||||||||||||||||||||||||||||||||||||||||||||||||||||||||||||||||||||||||||||||||||||||||||||||||||||||||||||||||||||||||||||||||||||||||||||||||
Figure 25. FCFF inflows summary Figure 26. Price breakdown by segment*
Stable growth Taman grain terminal brings first income Taman grain terminal acquisition
Taman terminal reaches its capacity income Voronezh plant reaches its capacity income Finishing the Voronezh greenfield plant Inflow of working capital is required Starting the building of new silos Working capital inflows Starting the building of greenfield plant in Voronezh
Expansion of Taman Sugar beet plants are sold
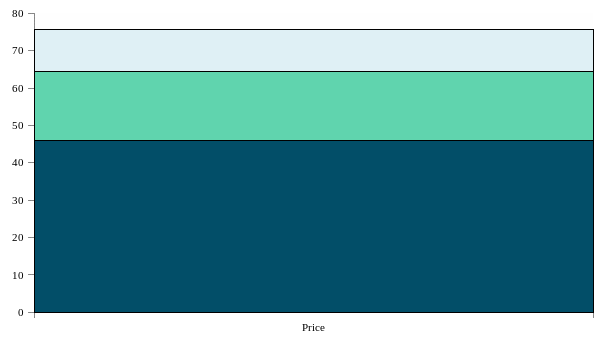
*approximately calculated on basis of EBIT margin Source: KNU estimates Source: KNU estimates |
||||||||||||||||||||||||||||||||||||||||||||||||||||||||||||||||||||||||||||||||||||||||||||||||||||||||||||||||||||||||||||||||||||||||||||||||||||||||||||||||||||||||||||||||||||||||||||||||||||||||||||||||||||||||||||||||||||||||||||||||||||||||||||||||||
|
We understand that the result can be influenced by a lot of factors which we are not able to take into account. Given the fact that grain and oil prices on both Ukrainian and Russian market is a subject of appreciable volatility, we provide the sensitivity matrix for the changes in costs of raw materials and the external price of grain and oil. |
|||||||||||||||||||||||||||||||||||||||||||||||||||||||||||||||||||||||||||||||||||||||||||||||||||||||||||||||||||||||||||||||||||||||||||||||||||||||||||||||||||||||||||||||||||||||||||||||||||||||||||||||||||||||||||||||||||||||||||||||||||||||||||||||||
Source: KNU estimates |
|
|||||||||||||||||||||||||||||||||||||||||||||||||||||||||||||||||||||||||||||||||||||||||||||||||||||||||||||||||||||||||||||||||||||||||||||||||||||||||||||||||||||||||||||||||||||||||||||||||||||||||||||||||||||||||||||||||||||||||||||||||||||||||||||||||
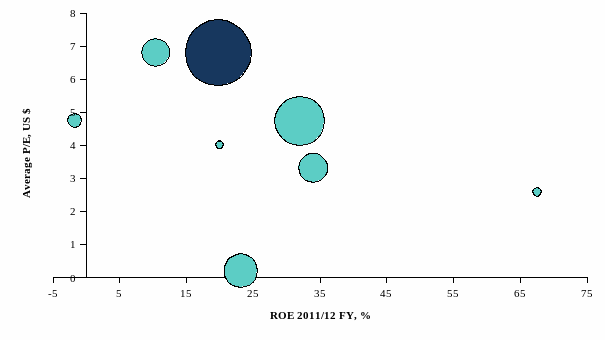
Figure 29. Main competitors of Kernel Holding S.A.
Source: KNU estimates |
Peers Valuation Clearly, not all agro holdings can be directly compared with each other because of great product differentiation, operating margins discrepancy & different production capacity (including landbank). We compare Kernel Holding S.A. with its domestic and Russian peers in terms of 2011/12 EV/EBITDA, EV/Sales and P/E multiples. We think peers comparison may provide some extra perspectives on our analysis. Also some specific production multiple like EV/Landbank was analysed, but any received result wasn’t obtained, because of higher than market medium Kernel crop yield. The most expensive Ukrainian agro holding. According to peers valuation, Kernel Holding S.A. trades with attractive 12,1% discount on EV/EBITDA, 39% discount on EV/S & premium 55% on P/E to its main peers. The aggregate discount/premium to comparables equals to 19.3% was calculated with weighting each premium/discount on appropriate weight (methodology of calculation of weight - see Appendix 6), depend of useful multiples in investment analysis. Company is stable little overvalued by the market, cause of high growth rate performance during last year & resilient position (full operating & delivery cycle) on the investment attractive industry. Positive expectation bases on high investment perspective in oil & grain trading segments of company in Russia (Krasnodarskiu krai and Black Sea bank). Using the peers comparison method we’ve obtained the price of 55.32 PLN. |
|||||||||||||||||||||||||||||||||||||||||||||||||||||||||||||||||||||||||||||||||||||||||||||||||||||||||||||||||||||||||||||||||||||||||||||||||||||||||||||||||||||||||||||||||||||||||||||||||||||||||||||||||||||||||||||||||||||||||||||||||||||||||||||||||
Financial analysis
|
In this section key financial results of the company’s activities are analyzed. Furthermore, existing and potential factors that might change key financial figures, are determined. Permanent income growth in the most profitable sectors. In 2008/2012 an average annual growth rate of the company’s income was equal to 38.8% and 30.3% for EBITDA. The 1Q 2012/2013 showed increase in revenues by 32.2 % and rise in EBITDA by 64.2% comparing to the 1Q 2011/2012 in which the EBITDA margin equaled to 14.3% with season features, positive price and demand trends in the main segments. Regular augmentation of the EBITDA margin was also noticed before 2011 (16.3% in 2011 and 15.5% in 2008). This figure slightly decreased in 2012 to 15.0% (see Figure 30). The increase was provided by favorable market conditions and expansion of income in the most margin-generating sectors, namely sunflower production and processing, farming, silo services and port terminals (in 2012 the EBITDA margin stood at 13.4%, 43.1%, 35.9% and 47.3% correspondingly, see Figure 30). Should an operational margin be at 14.5-15.0% while keeping a business structure of segments and positive synergy effect (USD 30 per ton), and implementation of investment projects be carried out to the full extent, we expect a 9% CAGR of the company’s income. |
|||||||||||||||||||||||||||||||||||||||||||||||||||||||||||||||||||||||||||||||||||||||||||||||||||||||||||||||||||||||||||||||||||||
Figure 30 Net income, ROE & ROA
|
||||||||||||||||||||||||||||||||||||||||||||||||||||||||||||||||||||||||||||||||||||||||||||||||||||||||||||||||||||||||||||||||||||||
|
Solid long-term profitability. The holding’s net income varied from USD 18.6 M in 2007 to USD 226.0 M in 2011 and USD 213.8 M in 2012. This trend ensured increase in a net margin to the year of 2010 (from 5.3% in 2007 to 14.9% in 2010). A growth rate of expenses surpassed a growth rate of income and resulted in reduction of the net income from 11.9% to 9.9% in 2011/2012. A high-level ROE of 37.1% in 2009 confirmed significant profitability of the company’s activities. Yet the ROE figure decreased to 17.9% in 2011/2012 due to the margin fall of grains and increase in fixed expenses while possible ways to raise prices of final output endured limited. According to our estimates key factors that impact on the company’s profit are a level of an EBIT margin and leverage (see Figure 32). Tax and loan interest rate impacts level and offset each other. Profitability of 14.4-16.2% in 2013/2017 is expected to be supported by growth of production capacities and increase in the operation margin of oil and grains. |
|||||||||||||||||||||||||||||||||||||||||||||||||||||||||||||||||||||||||||||||||||||||||||||||||||||||||||||||||||||||||||||||||||||
Figure 31 Net income, ROE & ROA
Source: Company data, KNU estimates |
Figure 32 Main Net income drivers
Source: Company data, KNU estimates |
|||||||||||||||||||||||||||||||||||||||||||||||||||||||||||||||||||||||||||||||||||||||||||||||||||||||||||||||||||||||||||||||||||||
|
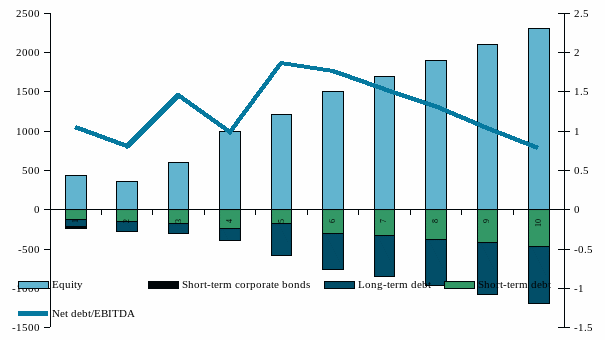
Tax burden remains minimal. A majority of the holding’s companies in Ukraine and Russia operates in accordance with a simplified taxation system of agricultural enterprises, thus agriculture contributes more than 75% of the companies’ income. An agricultural tax is solely paid. Furthermore, the agricultural tax rates in Ukraine and Russia (0.15% and 6% correspondingly) are crucially smaller than income tax rates (21% in Ukraine and 20% in Russia). A majority of export-oriented segments creates grounds for VAT reimbursement from the state budget. Company’s cashflow exceeds operational and capital expenses. Noticeable operational cashflow of the company allows it to fund completely its current and capital expenses (see Figure 33). An amount of accumulated retained earnings during 2008/2012 increased by 8 times and was equal to USD 84 M in 2012. Hence the company has an opportunity to maintain its target Net Debt/EBITDA ratio of 2.5 in case of further expansion. The Net Debt/EBITDA ratio totaled 1.05 in 2008/2009 and 1.86 in 2011/2012. Yet opportunities of external financing have not been exhausted. The company’s debt continues to be comfortable and did not reach its critical level. Nevertheless the company’s debt doubled during the last reporting period. In 2012 own funds stood at 58.3% in the structure of financing (see Figure 34). Indeed, a share of attracted resources grew from 36.6% in 2010/2011 to 42.74% in 2011/2012. An amount of long-term liabilities enlarged to 61.6% in 2011/2012 due to debts of joined companies. However, short-term attracted resources which were more expensive prevailed in the structure of financing in 2008/2011 (60-65%). |
|||||||||||||||||||||||||||||||||||||||||||||||||||||||||||||||||||||||||||||||||||||||||||||||||||||||||||||||||||||||||||||||||||||
Figure.33 Capital structure
Source: Company data, KNU estimates |
Figure. 34 CapEx financing
Source: Company data, KNU estimates |
|||||||||||||||||||||||||||||||||||||||||||||||||||||||||||||||||||||||||||||||||||||||||||||||||||||||||||||||||||||||||||||||||||||
|
Practically a total sum of debt is denominated in USD. Nevertheless there are debts in RUB and EUR which allows to minimize losses in case of debt revaluation due to changes in foreign currency exchange rates. Quality of debt service is satisfactory. Moreover, it is planned to achieve a target EBITDA/Interest ratio which will be greater than 5.0 (this figure varied from 4.4 to 8.3 in 2008/2012). The company’s net financial position amounted to – USD 183.4 M in 2011/2012 comparing to analogical figures of – USD 38.2 M in 2008/2009 and – USD 150 M in 2010/2011 (see appendix 2). Investment plans meet investment opportunities. During 2008/2012 the company’s total assets grew by 3 times from USD 755.6 M in 2008 to USD 2119 M in 2012. Such growth took place due to increase in PP&E, namely expansion of the land bank and processing capacities (plants) mostly carried out by M&A (see Figure 34). Profitability of invested capital is directly proportion to capital expenses. Should investment opportunities in Russia be fully realized, we expect stable profitability of invested capital. |
|||||||||||||||||||||||||||||||||||||||||||||||||||||||||||||||||||||||||||||||||||||||||||||||||||||||||||||||||||||||||||||||||||||
Figure. 35 Asset growth from M&A activity
Source: Company data |
||||||||||||||||||||||||||||||||||||||||||||||||||||||||||||||||||||||||||||||||||||||||||||||||||||||||||||||||||||||||||||||||||||||
|
Key financial figures of the company’s activities used to perform financial analysis are represented in Figure. Aggregated financial reports of the company and analysis of separate elements of financial standing (such as revenues, net profit, operating margin) are provided in Appendixes. |
|||||||||||||||||||||||||||||||||||||||||||||||||||||||||||||||||||||||||||||||||||||||||||||||||||||||||||||||||||||||||||||||||||||
Figure 36. Key financial ratio Source: KNU estimates
|
||||||||||||||||||||||||||||||||||||||||||||||||||||||||||||||||||||||||||||||||||||||||||||||||||||||||||||||||||||||||||||||||||||||

